This is an author-deposited version published in:
http://oatao.univ-toulouse.fr/
Eprints ID: 5254
To cite this version:
Busset, Guillaume and Sangely, Matthieu and Montréjaud-Vignoles, Mireille
and Thannberger, Laurent and Sablayrolles, Caroline Life cycle assessment of
Polychlorinated Biphenyl contaminated soil remediation processes.
International Journal of Life Cycle Assessment . ISSN 0948-3349
O
pen
A
rchive
T
oulouse
A
rchive
O
uverte (
OATAO
)
OATAO is an open access repository that collects the work of Toulouse researchers and
makes it freely available over the web where possible.
Any correspondence concerning this service should be sent to the repository
administrator:
[email protected]
Life cycle assessment of polychlorinated biphenyl
contaminated soil remediation processes
Guillaume Busset&Matthieu Sangely&
Mireille Montrejaud-Vignoles&Laurent Thannberger&
Caroline Sablayrolles
Abstract
Purpose A life-cycle assessment (LCA) was performed to evaluate the environmental impacts of the remediation of industrial soils contaminated by polychlorobiphenyl (PCB). Two new bioremediation treatment options were compared with the usual incineration process. In this attributional LCA, only secondary impacts were considered. The con-taminated soil used for the experiments contained 200 mg of PCB per kilogram.
Methods Three off-site treatment scenarios were studied: 1) bioremediation with mechanical aeration, 2) bioremediation with electric aeration and 3) incineration with natural gas. Bioremediation processes were designed from lab-scale, scale-up and pilot experiments. The incineration technique was inspired by a French plant. A semi-quantitative uncertainty
analysis was performed on the data. Environmental impacts were evaluated with the CML 2001 method using the SimaPro software.
Results and discussion In most compared categories, the bioremediation processes are favorable. Of the bioremediation options, the lowest environmental footprint was observed for electric aeration. The uncertainty analysis supported the results that compared incineration and bioremediation but decreased the difference between the options of aeration. The distance of transportation was one of the most sensitive parameters, especially for bioremediation. At equal distances between the polluted sites and the treatment plant, bioremedi-ation had fewer impacts than incinerbioremedi-ation in eight out of 13 categories.
Conclusions The use of natural gas for the incineration process generated the most impacts. Irrespective of the aeration option, bioremediation was better than incineration. The time of treatment should be taken into account. More precise and detailed data are required for the incineration scenario. More parameters of biological treatments should be measured. LCA results should be completed using eco-logical and health risk assessment and an acceptability evaluation.
Keywords Attributional LCA . CML-method . Environmental evaluation . Midpoint category . Polychlorinated biphenyl
1 Introduction
The management of contaminated soil requires the selection of the most adapted technology from a wide range of options (Suer et al. 2004). Remediation techniques take
G. Busset
CATAR-CRITT Agroressources, 4 Allee Emile Monso,
31030 Toulouse, France M. Sangely
:
L. ThannbergerVALGO,
81 rue Jacques Babinet, 31100 Toulouse, France M. Sangely
:
C. SablayrollesUniversite de Toulouse, INP, LCA (Laboratoire de Chimie Agro-Industrielle), ENSIACET, 4 Allee Emile Monso,
31030 Toulouse, France
M. Sangely
:
M. Montrejaud-Vignoles:
C. Sablayrolles (*)INRA, LCA (Laboratoire de Chimie Agro-Industrielle), 31029 Toulouse, France
e-mail: [email protected] DOI 10.1007/s11367-011-0366-7
place on site, either in situ or ex situ, or off-site and include thermal treatments, biological treatments, soil washing, landfill, electrodialysis, bioleaching, biosparging treatments, chemical treatments (such as oxidation or reduction) and solvent extraction among many others (Cadotte et al. 2007; Lemming et al.2010). In practice, ex situ techniques appear to be the most commonly used (Lemming et al. 2010). These technologies also diverge in their results. They could lead to immobilization, separation, concentration or destruction of the pollutants (Rahuman et al.2000). The primary differences lie in their technology, but their cost, efficiency and duration are also considered.
Pollutants are either inorganic, such as metals, or organic, and their physical and chemical properties, such as volatility, persistence, solubility and conductivity influence the choice of remediation technique.
Until now, polychlorobiphenyl (PCB) contaminants have most often been destroyed by incineration. However, the dedicated incinerators used for this process require a large amount of energy to limit dioxin formation, and few effi-cient alternatives are available. Chemical oxidation has shown a low efficiency (Zhou et al. 2004). Supercritical water oxidation exhibits high destruction efficiency but requires high pressure and temperature conditions (Zhou et al. 2004). A phytoremediation technique using methylated-α-cyclodextrins has been the subject of a recent study (Shen et al. 2009). The results are conclusive: the impact of methylated-α-cyclodextrins must be investigated. To inves-tigate the biological breakdown of PCBs, Sangely et al. (2009) have tested the combination of Phanerochaete cry-sosporium, a fungus capable of breaking down PCBs under anaerobic conditions, and Burkholderia xenovorans, a bac-terium implicated in PCB breakdown under aerobic condi-tions. The combination of aerobic and anaerobic steps has given rise to a new process of bioremediation of PCB-contaminated soils and has been developed on both the laboratory scale and as a pilot project.
Life-cycle assessment (LCA) appears to be a method well adapted for the evaluation of the impacts of remediation techniques (Morais and Delerue-Matos2009). LCA can be attributional or consequential, particularly in the soil remedi-ation domain (Lesage et al. 2007a; Lesage et al. 2007b). Attributional LCA evaluates the primary impacts from resid-ual contamination and/or the secondary impacts from the technique life cycle. Consequential LCA takes into account environmental and economic impacts after remediation (Volkwein et al.1999). Most authors have limited their studies to secondary impacts (Lemming et al.2010). LCA has been applied to contaminations of lead (Page et al.1999), polycy-clic aromatic hydrocarbons, chromium and mineral oils (Volkwein et al.1999), sulfur (Blanc et al.2004), diesel fuel (Toffoletto et al.2007; Cadotte et al.2007) and trichloroethene (Lemming et al. 2010). These studies show that LCA is a
relevant management tool for evaluation of the environ-mental impacts of soil remediation techniques of differ-ent pollutants.
A life-cycle assessment was undertaken to compare dif-ferent treatments of PCB waste in Ohio, USA. This complete study investigated environmental impacts and economic, technologic and health risks (Morris et al. 2000). At that time, biological treatments were only in the R&D stage; therefore, they were not included among the evaluated tech-niques. Another recent LCA investigated PCB treatment techniques but compared a high-temperature process with a base-catalyzed decontamination (Hu et al.2011). No LCA has been performed on the new biological process used in this study.
The objectives of this study are (a) to evaluate, via attribu-tional LCA methodology, the potential environmental impacts of the bioremediation process for PCB-contaminated soils, as recently established by Sangely et al. (2009), and (b) to compare the bioremediation impacts to the impacts of the current incineration technique.
2 Methodology
The life-cycle assessment was undertaken using the ISO14040 (2006) and ISO 14044(2006) standards
2.1 LCA goal and scope
The evaluated system’s function was to restore soil PCB con-tamination levels to waste acceptance criteria (50 mg kg−1of soil) in hazardous (French class 1) waste landfill sites in France (http://www.ineris.fr/aida/?q0consult_doc/consultation/ 2.250.190.28.8.2283). The reference flow was taken as the amount of moist soil (20% moisture) that can be excavated in 1 day under pilot-project conditions; this quantity corresponds to 600 t per day. Laboratory results have shown a potential of PCB degradation in soil of 556 μg kg−1per day. Therefore, the PCB concentration can be reduced from 200 mg kg−1– 50 mg kg−1of soil in 265 days (Sangely2010). The functional unit was therefore defined as treating 600 t of PCB-contaminated moist soil (20% moisture) to reduce its PCB concentration from 200 mg kg−1–50 mg kg−1of soil.
The processes taken into consideration for the studied systems included excavation and transport to the landfill site after the treatment phase. A detailed description is given in the next section. For all of these processes, infrastructure construction, worker transport and landfill site maintenance were not taken into account, primarily because the share of impacts by soil remediation treatments was negligible. The remediation activity of PCB-contaminated soils is not the most important part of the enterprises activity. Systems boundaries are discussed in “Section4”.
2.2 Life-cycle inventory
2.2.1 Systems description
The life-cycle assessment was used to compare two PCB-contaminated soil remediation processes: soil incineration and biological treatment. Three scenarios were defined: BM, treatment by bioremediation with mechanical aeration; BE, treatment by bioremediation with electric aeration; and Inc, treatment by incineration.
Biological treatment The biological treatment is an inno-vative and original process based on experimental laboratory-scale and pilot-scale trial results. The treat-ment’s procedure consisted of alternating aerobic and anaerobic phases. The aerobic conditions favor the devel-opment of the bacteria B. xenovorans, and the anaerobic conditions favor the fungi P. crysosporium; each is capa-ble of partially breaking down PCB. Bacteria broke down the less-chlorinated PCBs, whereas fungi broke down the more highly chlorinated PCBs (Sangely et al. 2009). When the bacteria and fungi were broken down in tan-dem, PCB was broken down to the target concentration or lower. In practice, the treatment of PCB-contaminated soils required three cycles; each cycle consisted of 2 months under anaerobic conditions and 1 month under aerobic conditions.
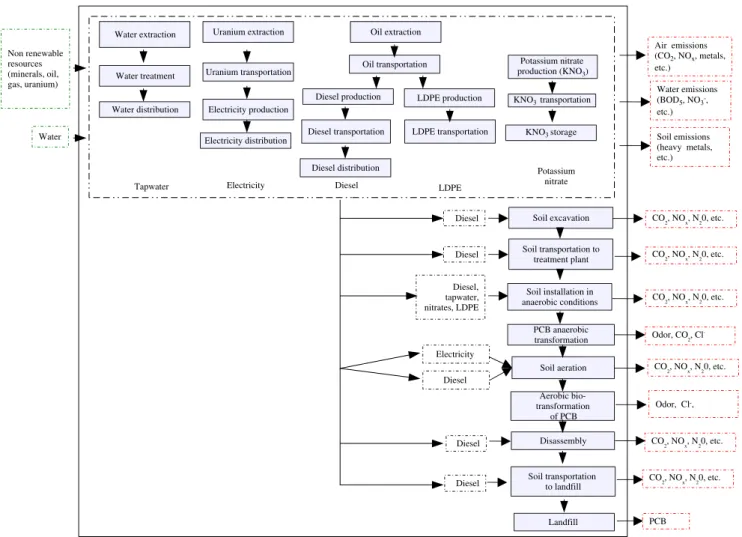
Excavation, the first phase, was followed by transport to the bioremediation site, where the soil was immedi-ately put onto a waterproof concrete platform (not taken into account in the LCA). This soil was then covered with a low-density polyethylene sheet, supplied with nitrates and flooded with water to create anaerobic con-ditions. The aerobic phase was facilitated by soil aera-tion. The two techniques being studied were given two different bioremediation scenarios. These scenarios were designed to allow a comparison of two technical alter-natives and determine the best one. The first technique (BM) involved turning the soil over four times per cycle using a 5-t mechanical digger. The second technique (BE) involved the electrical pumping of air through the soil for 25% of the aerobic phase. An 11-kW compressor was used. The first anaerobic/aerobic cycle was followed by two more identical cycles. After three cycles, the soil was transported to the nearest hazardous waste landfill site. For this stage, the residual amount of PCB met the landfill’s waste acceptance upper limitation criteria. It was considered as an emission to the soil. A flow diagram of the bioremediation procedure and the two aeration options is shown in Fig. 1.
The potential direct emissions from anaerobic and aero-bic PCB decomposition were not known and were not considered.
Treatment by incineration Soil treatment by incineration consisted of excavation followed by transport to the incin-eration site. At the incinincin-eration site, the soil was put into a rotating oven where soils and other organochloride wastes were burned at a high temperature (1200°C) (Séché2010). The gaseous waste was burned in a second combustion at 1200°C, followed by a rapid cooling to 70°C to avoid the formation of dioxins and furans (Séché2010). The gas was then washed with sodium hydroxide in two gas–liquid con-tactors. Dust was then removed by a Venturi followed by an electric filter (Séché 2010). Waste water was treated with lime and complexing and flocculating agents. Solid residues from the incinerated soils and the wash-water treatment sludges were sent to a hazardous waste landfill. Although not all of the PCB was destroyed by incineration, we assumed that there were no emissions due to the very low residual concentration. The incineration procedure and process flow-chart is shown in Fig.2.
2.2.2 Data collection
Inventory data about the bioremediation processes were taken from laboratory-scale and pilot-scale experiments. When results from the pilot scale were not available, laboratory-scale data from Sangely’s dissertation were used for extrapolation (Sangely2010).
Data about incineration were taken from the “Registre Français des émissions Polluantes (French pollutant emis-sion register)” website (http://www.pollutionsindustrielles. ecologie.gouv.fr/IREP/index.php), which provided informa-tion on the main direct emissions for the overall process at the incineration site. A large amount of natural gas was used for the incineration; the LCA impact from its production was taken into account by calculating the quantity of natural gas Eq.1from the amount of CO2emitted.
Volume of natural gas used per incineration calculated from the quantity of CO2emitted:
Vgnv¼
mCO2 Ip
a ð1Þ
where
Vgnv is the volume of natural gas assumed to be consumed by the functional unit in cubic meter mCO2 is the mass of CO2emitted in kg UF−1
Ip is the percentage CO2emitted attributed to the natural gas combustion
α is the conversion coefficient (mass of CO2per volume of burned natural gas: in kilogram per cubic meter).
Finally, all the product and energy inventory data used in the procedure were obtained from the Ecoinvent European data table.
2.2.3 Uncertainty analysis
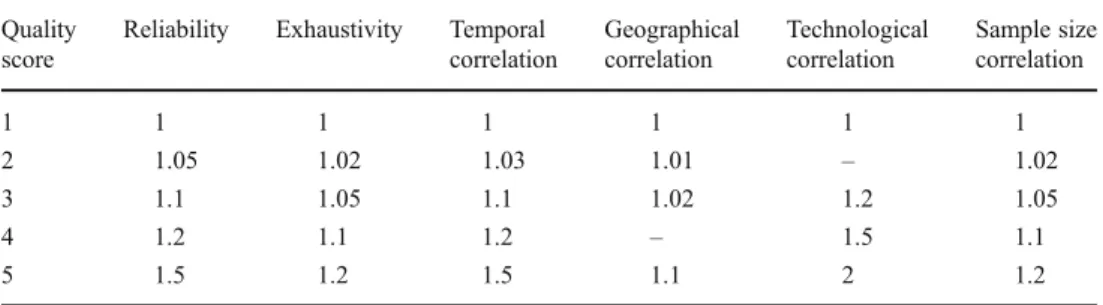
Uncertainty analysis was applied to all inventory data according to the method in Frischknecht et al. (2007). For each data set, six parameters were qualitatively evaluated on a scale of 1–6, and an uncertainty factor was attributed to each evaluation using a correspondence table. The evaluated parameters and the corresponding uncertainty factors are given in Table 1(Jolliet et al.2005). If a parameter did not apply to the data, it was assigned a value of 1. The variance was calculated using Eq.2.
Variance calculation: V95%¼ exp ffiffiffiffiffiffiffiffiffiffiffiffiffiffiffiffiffiffiffi X7 n¼1 ln2Un v u u t ð2Þ where
U1 the uncertainty factor for the reliability parameter U2 the uncertainty factor for the exhaustivity parameter U3 the uncertainty factor for the temporal correlation
parameter
U4 the uncertainty factor for the geographical correlation parameter
U5 the uncertainty factor for the technological correlation parameter
U6 the uncertainty factor for the sample size parameter U7 the basic uncertainty factor. It depends on the
emissions’ measuring and modelling techniques. The uncertainty factors have no units.
The Ecoinvent data used were primarily evaluated as a function of the different correlations. The relative uncertainty of the data was found using Eq.3.
Calculation of relative uncertainties: I%¼ ffiffiffiffiffiffiffiffiffiffi V95% p # 1 & ' 100 ð3Þ
where I%is the relative uncertainty of the data expressed as percent.
2.3 Impact assessment
Impact evaluations were made using the CML 2001 calcu-lation method for 13 chosen midpoint impact categories:
PCB anaerobic transformation Odor, CO2, Cl -Soil installation in anaerobic conditions Diesel, tapwater, nitrates, LDPE CO2, NOx, N20, etc. Diesel Soil transportation to
treatment plant CO2, NOx, N20, etc.
Soil aeration Electricity Aerobic bio-transformation of PCB Odor, Cl-, Disassembly Diesel Landfill
Diesel Soil transportation to landfill CO2, NOx, N20, etc.
PCB CO 2, NOx, N20, etc. Electricity production Uranium transportation Electricity distribution Oil extraction Uranium extraction Diesel transportation Diesel distribution Diesel production Oil transportation Electricity Diesel LDPE transportation LDPE production LDPE Potassium nitrate production (KNO3) KNO3 storage Potassium nitrate Water treatment Water distribution Water extraction Tapwater KNO3 transportation Air emissions (CO2, NOx, metals, etc.) Water emissions (BOD5, NO3-, etc.) Soil emissions (heavy metals, etc.) Non renewable resources (minerals, oil, gas, uranium) Water Diesel CO 2, NOx, N20, etc.
Diesel Soil excavation CO2, NOx, N20, etc.
human toxicity, terrestrial ecotoxicity, photochemical oxidation (low NOx), ionizing radiation, freshwater sed-imentary ecotoxicity, freshwater aquatic ecotoxicity, ma-rine sedimentary ecotoxicity, mama-rine aquatic ecotoxicity, ozone layer depletion (Steady state), global warming (100 year horizon), eutrophication, acidification and abiotic depletion.
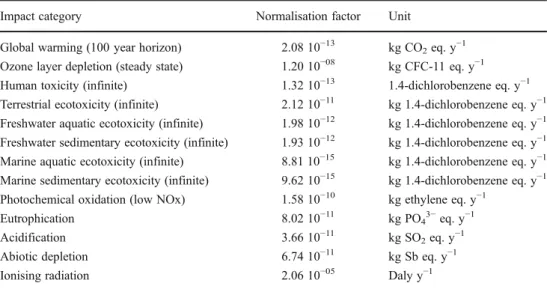
The results were normalized with factors from Western Europe obtained in 1995 (Huijbregts et al.2003) (Table2). The inventory and impact calculations were made using Microsoft Excel and SimaPro® software.
2.4 Iso-distance impacts calculation
The soil transportation distance was a relevant parameter in this study; therefore, the influence of the location of polluted soil was calculated. To this end, Δd defines the difference in distance from which the impacts of the two scenarios com-pensated for each other in a given category. Only the transport-related impacts had a linear relation to distance. Equation4provides the iso-impacts distance. If Δd<0, the distance favored scenario 3 (incineration); if Δd>0, the distance favored scenario 1 (bioremediation).
Soil transportation to treatment plant
CO
2, NOx, N20, etc. Diesel
Incineration CO2, dioxins, etc.
Landfill Clinker transportation to landfill CO 2, NOx, N20, etc. Diesel Natural gas, tapwater Gas transportation
Natural gas distribution
Oil extraction Gas extraction/ production Diesel transportation Diesel distribution Diesel production Oil transportation
Natural gas Diesel Water treatment Water distribution Water extraction Tapwater Non renewable resources (minerals, oil, gas, uranium) Water Soil excavation CO 2, NOx, N20, etc. Diesel Air emissions (CO2, NOx, metals, etc.) Water emissions (BOD5, NO3-, etc.) Soil emissions (heavy metals, etc.)
Fig. 2 Lifecycle of the incineration procedure
Table 1 Uncertainty factors corresponding to possible quality scores for each parameter (Jolliet et al.2005)
Quality score
Reliability Exhaustivity Temporal correlation Geographical correlation Technological correlation Sample size correlation 1 1 1 1 1 1 1 2 1.05 1.02 1.03 1.01 – 1.02 3 1.1 1.05 1.1 1.02 1.2 1.05 4 1.2 1.1 1.2 – 1.5 1.1 5 1.5 1.2 1.5 1.1 2 1.2
Calculation of the iso-impact distances: Δd¼ d2# d1¼ Iscenario1ðd1¼ 0Þ # Iscenario2ðd2¼ 0Þ Itransportðd ¼ d1¼ d2¼ 1Þ ð4Þ where
Δd is the difference in distance travelled between the contaminated site and the treatment centre
d1and d2 the distance travelled between the
contaminated site and the treatment centre for scenario 1 and scenario 2 respectively
Iscenario1and
Iscenario2
the impact of scenario 1 and of scenario 2, respectively, in the case where the contaminated site is treated in situ
Itransport the unitary impact of the transport of soil
over 1 km.
3 Results
3.1 Flow comparisons between the scenarios
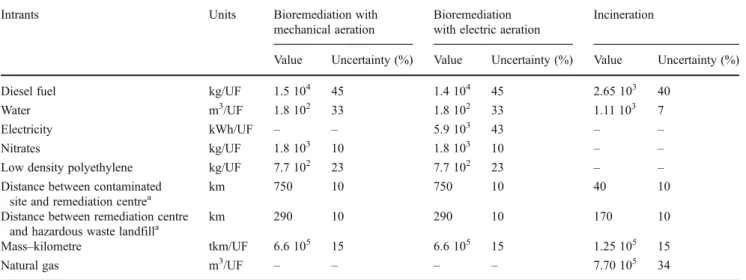
Table3gives the main inputs necessary for each of the three scenarios. The amount of diesel fuel consumed covered trans-port and handling of the soil. The stated uncertainties were calculated using Eqs. 2 and 3. Bioremediation procedures required more diesel fuel, which was directly related to the distance traveled between the contaminated site and the treat-ment centers. In all scenarios, the truck capacity and mass of soil were the same; therefore, the frequency of transport did not vary. As a consequence, it had no influence on diesel consumption. Conversely, incineration consumed more water, especially for the treatment of the gaseous effluents.
Incineration produces direct emissions, and Table 4
shows the emission data declared for a hazardous waste
(including PCB-contaminated soils) incineration plant. This procedure was responsible for many of the direct emissions of heavy metals and chlorinated products into water. In the air, carbon dioxide was emitted from the combustion of the natural gas used for the incineration. The presence of resid-ual dioxins/furans and PCB indicated that PCB was not totally destroyed by incineration. The uncertainty in these data was 40%, as calculated from the Ecoinvent uncertainty database concerning techniques for the determination of these types of emissions. However, there was much less uncertainty in the quantity of CO2produced; it was gener-ally calculated from reliable and proven models.
3.2 Impact analysis
3.2.1 Bioremediation: mechanical versus electric aeration Table 5 shows the results of the impact evaluations for the three scenarios. The biological treatment processes all exhibited the same impact on freshwater aquatic ecotoxicity (1.3×10³kg 1,4-dichlorobenzene eq.). The impact on human toxicity and ionizing radiation was greater for electric than for mechanical aeration because of the contribution of nuclear power in French electricity production. The other ten impact categories all favored electric aeration. With regard to the uncertainty and compared with the incineration results, both biologic techniques could be considered equivalent.
3.2.2 Bioremediation versus incineration
Because the orders of magnitude are the same between the two biological techniques, the comparison of these techni-ques with incineration led to identical conclusions, irrespec-tive of the bioremediation scenario. Only the electric aeration scenario was evaluated because it is the best sce-nario in the French context. The incineration technique had
Table 2 Normalisation factors for West Europe, 1995 (Huijbregts et al.2003)
Impact category Normalisation factor Unit Global warming (100 year horizon) 2.08 10−13 kg CO
2eq. y−1
Ozone layer depletion (steady state) 1.20 10−08 kg CFC-11 eq. y−1
Human toxicity (infinite) 1.32 10−13 1.4-dichlorobenzene eq. y−1
Terrestrial ecotoxicity (infinite) 2.12 10−11 kg 1.4-dichlorobenzene eq. y−1
Freshwater aquatic ecotoxicity (infinite) 1.98 10−12 kg 1.4-dichlorobenzene eq. y−1
Freshwater sedimentary ecotoxicity (infinite) 1.93 10−12 kg 1.4-dichlorobenzene eq. y−1
Marine aquatic ecotoxicity (infinite) 8.81 10−15 kg 1.4-dichlorobenzene eq. y−1
Marine sedimentary ecotoxicity (infinite) 9.62 10−15 kg 1.4-dichlorobenzene eq. y−1
Photochemical oxidation (low NOx) 1.58 10−10 kg ethylene eq. y−1
Eutrophication 8.02 10−11 kg PO
43−eq. y−1
Acidification 3.66 10−11 kg SO 2eq. y−1
Abiotic depletion 6.74 10−11 kg Sb eq. y−1
a greater impact than did bioremediation on the depletion of abiotic resources, the ozone layer, photochemical oxidation, marine ecotoxicity (aquatic and sedimentary) and global warming. For incineration and bioremediation, the impacts were similar for acidification and human toxicity. Finally, the bioremediation impacts exceeded those for incineration in eutrophication, terrestrial toxicity, freshwater ecotoxicity (aquatic and sedimentary) and ionizing radiation (Fig. 3). Furthermore, normalized results showed a higher weight for abiotic depletion, global warming and marine (aquatic and sedimentary) ecotoxicity (see Fig. 3). Other impact catego-ries did not appear with significant weight. These results
confirmed that the environmental impacts of biological treatment were less than those of incineration.
The impact on global warming was nine times greater for incineration than for the biological soil treatment procedures, producing 6.5×10⁵ and 7.2×10⁴ kg eq. CO2, respectively. Carbon dioxide (CO2), nitrous oxide (N2O) and methane (CH4) contributed the most to this effect (Table6). The incin-eration stage of the incinincin-eration scenario was responsible for 94% of the impact on climate warming. For bioremediation, the transport phase contributed 75% of this impact (Fig.4). This result partially confirmed the conclusions of Diamond et al. (1999). The production of nitrates used for the biological
Table 4 Direct emissions from incineration: quantities and emission compartment a Source:http://www.pollution sindustrielles.ecologie.gouv.fr/ IREP/index.php Substance Emission compartment
Quantity emitted per functional unit in kga
Uncertainty (%) Dioxins and furans (DRIRE Rhône-Alpes 2003) Air 1.5 10−6 40
Polychlorinated biphenyls (PCB) Air 3.0 10−3 40
Total CO2 Air 6.1 105 4
Arsenic and its compounds (As) Eau 5.0 10−1 40
Polychlorinated biphenyls (PCB) Eau 2.1 10−3 40
Cadmium and its compounds (Cd) Eau 4.0 10−1 40
Chlorine (total Cl) Eau 5.4 104 40 Organohalogen compounds (AOX) Eau 4.5 101 40
Copper and its compounds (Cu) Eau 1.7 40 Fluorine (total F) Eau 1.0 102 40
Mercury and its compounds (Hg) Eau 1.8 10−1 40
Nickel and its compounds (Ni) Eau 5.0 10−1 40
Lead and its compounds (Pb) Eau 5.0 10−1 40
Trichlorobenzenes (TCB) Eau 3.0 10−3 40
Tetrachloroethylene (PER—perchloroethylene) Eau 1.5 10−1 40
Zinc and its compounds (Zn) (2007) Eau 6.2 48 Table 3 Direct intrants (Sangely2010)
Intrants Units Bioremediation with mechanical aeration
Bioremediation with electric aeration
Incineration
Value Uncertainty (%) Value Uncertainty (%) Value Uncertainty (%) Diesel fuel kg/UF 1.5 104 45 1.4 104 45 2.65 103 40
Water m3/UF 1.8 102 33 1.8 102 33 1.11 103 7
Electricity kWh/UF – – 5.9 103 43 – – Nitrates kg/UF 1.8 103 10 1.8 103 10
– –
Low density polyethylene kg/UF 7.7 102 23 7.7 102 23
– –
Distance between contaminated site and remediation centrea
km 750 10 750 10 40 10
Distance between remediation centre and hazardous waste landfilla
km 290 10 290 10 170 10
Mass–kilometre tkm/UF 6.6 105 15 6.6 105 15 1.25 105 15
Natural gas m3/UF
– – – – 7.70 105 34
aDistance corresponds to specific case study. Bioremediation centre and corresponding hazardous waste landfill are located respectively in Lacq
and in Graulhet (West-Southern France). Incinerator and corresponding hazardous waste landfill are located respectively in Saint-Vulbas and in Drambon (East-Southern France).
Table 5 Score of intermediary impacts for each scenario
Impact category Reference unit Bioremediation with mechanical aeration Bioremediation with electric aeration Incineration Mean Standard error (%) Mean Standard error (%) Mean Standard error (%) Global warming (100 year horizon) kg CO2eq. 7.5 104 16 7.2 104 15 6.5 105 6
Ozone layer depletion (steady state) 10−3kg CFC-11 eq. 9.3 16 8.9 15 21.6 33
Human toxicity (infinite) 104kg 1.4-dichlorobenzene eq. 1.2 20 1.0 16 1.1 34
Terrestrial ecotoxicity (infinite) kg 1.4-dichlorobenzene eq. 106 14 158 23 35 29 Freshwater aquatic ecotoxicity (infinite) 103kg 1.4-dichlorobenzene eq. 1.3 15 1.3 14 0.6 29
Freshwater sedimentary ecotoxicity (infinite) 103kg 1.4-dichlorobenzene eq. 3.2 15 3.1 14 1.4 29
Marine aquatic ecotoxicity (infinite) 106kg 1.4-dichlorobenzene eq. 4.9 16 4.6 14 9.6 33
Marine sedimentary ecotoxicity (infinite) 106kg 1.4-dichlorobenzene eq. 4.2 16 4.0 14 8.2 33 Photochemical oxidation (low NOx) kg ethylene eq. 4.3 20 3.8 16 8.4 33 Eutrophication kg PO43−eq. 43.8 19 38.3 15 14.2 27
Acidification kg SO2eq. 230 18 207 16 139 30
Abiotic depletion kg Sb eq. 446 17 427 16 1.7 103 33 Ionising radiation 10−5Daly 3.5 16 18.9 38 2.1 21
0 20 40 60 80 100 120 140 A D A c i E u t G W 1 0 0 a O L D H T I n f. F W A E T I n f. M A E T I n f. T E I n f. M S E T I n f. F W S E T I n f. IR P h O x % BE Inc 0,00E+00 4,00E-08 8,00E-08 1,20E-07 1,60E-07 A D A c i E u t G W 1 0 0 a O L D H T In f. F W A E T In f. M A E T In f. T E In f. M S E T In f. F W S E T In f. IR P h O x BE Inc
HT Inf. = Human Toxicity Infinite TE Inf. = Terrestrial Ecotoxicity Infinite
Ph Ox = Photochemical Oxidation (Low Nox)
IR = Ionizing Radiation
FWSET Inf. = Freshwater Sedimentary Ecotoxicity Infinite
FWAET Inf. =Freshwater Aquatic Ecotoxicity Infinite
MSET Inf. = Marine Sedimentary Ecotoxicity Infinite
MAET Inf. = Marine Aquatic Ecotoxicity Infinite
OLD = Ozone Layer Depletion (Steady state) GW = Global Warming (100 yr horizon) Eut = Eutrophication Aci = Acidification AD = Abiotic Depletion
Fig. 3 Comparison of the environmental impact midpoints for the bioremediation scenario with electric aeration (BE) and the incineration scenario (Inc): characterisation results (percentage) and normalisation results (no unit)
treatment was responsible for 21% of greenhouse gas emis-sions. Conversely, the excavation undertaken for soil han-dling did not generate significant impacts (see Fig.4).
Oil, natural gas and coal were decreased the most (see Table6) during the bioremediation process. The consumption of oil, natural gas and coal for incineration and bioremediation was 138, 2992 and 24 GJ and 720, 120 and 45 GJ, respec-tively. The difference in quantities of oil could be linked, for
the most part, to the different soil transport distances (see Table4). The high quantities of natural gas used for inciner-ation were for the process itself.
Ecotoxicological impacts on marine, freshwater and terres-trial categories were due to vanadium, nickel, zinc and barium (see Table6). In addition to these substances, human toxicity was subject to the effects of polycyclic aromatic hydrocarbons (PAHs), dioxins (mainly incineration), benzene and some
Table 6 Characterisation of substances contributing over 1% to intermediary impacts
Impact category Reference unit Substances
Air Water Soil
Global warming (100 year horizon)
kg CO2eq. Fossil CO2, nitrous oxide, fossil methane
– –
Ozone layer depletion (steady state)
kg CFC-11 eq. HCFC-22, halon 1301, halon 1211
– –
Human toxicity (infinite) kg 1.4-DB eq. Vanadium, HAP, nitrogen oxides, nickel, dioxins, copper, chrome VI, cadmium, benzene, arsenic
HAP, barium, barytite –
Terrestrial ecotoxicity (infinite)
kg 1.4-DB eq. Vanadium, nickel, mercury, arsenic – Zinc, chrome VI, barium
Freshwater aquatic ecotoxicity (infinite)
kg 1.4-DB eq. Vanadium, nickel Zinc ions, vanadium ions, HAP, nickel ions, copper ions, cobalt, beryllium, barium
Zinc, barium
Freshwater sedimentary ecotoxicity (infinite)
kg 1.4-DB eq. Vanadium, nickel Vanadium ions, nickel ions, cobalt, beryllium, barium, barytite
Barium Marine aquatic
ecotoxicity (infinite)
kg 1.4-DB eq. Vanadium, nickel Vanadium ions, nickel ions, cobalt, barium, barytite
Barium Marine sedimentary
ecotoxicity (infinite)
kg 1.4-DB eq. Vanadium, nickel Zinc ions, vanadium ions, HAP, nickel ions, copper ions, cobalt, barium
Zinc, barium
Photochemical oxidation (low NOx)
kg C2H4eq. Toluene, propane, pentane, fossil methane, hexane, heptane, ethane, carbon monoxide, butane
– –
Eutrophication kg PO43−eq. Nitrogen oxides, ammonia Phosphate, chemical oxygen demand – Acidification kg SO2eq. Sulfur dioxide, nitrogen oxides,
ammonia
– –
Abiotic depletion kg Sb eq. – – Petrol, natural gas, coal
Ionising radiation Daly Radon 222, carbon 14 – –
Bioremediation (Electric aeration)
0% 20% 40% 60% 80% 100% HT Inf. TE Inf. Ph Ox IR
FWSET Inf. FWAET Inf. MSET Inf. MAET Inf.
OLD GW 100a Eut Aci AD Incineration 0% 20% 40% 60% 80% 100% HT Inf. TE Inf. Ph Ox IR
FWSET Inf. FWAET Inf. MSET Inf. MAET Inf.
OLD
GW 100a
Eut Aci AD
Soil transport Nitrate production Soil handling Polyethylene production
Tap water production Electricity production Natural gas production Soil incineration process
heavy metals (copper, mercury, cadmium, chromium(VI), arsenic). These emissions were related to transport (Spielmann et al.2007). The most important impact phases of the biore-mediation scenario were transport and nitrates production; these phases accounted for a total of almost 90% of the impacts. For the incineration scenario, natural gas production accounted for more than 70% of the impact.
Ionizing radiation was a very strong impact from the bioremediation scenario because of electric aeration. More than 80% of the impact was due to the production of elec-tricity (see Fig.4).
Finally, acidification, ozone-layer depletion and photo-chemical oxidation were also largely subject to the influence of transport under bioremediation, with impacts greater than 70%. Overall, natural gas production was responsible for almost 90% of impacts in these categories (see Fig.4).
4 Discussion
4.1 Distance of transport
Transport was an important impact factor (see Fig.4), espe-cially for the bioremediation scenarios. However, the base-line hypothesis used a transport distance of 750 km for bioremediation against 40 km for incineration. Therefore,
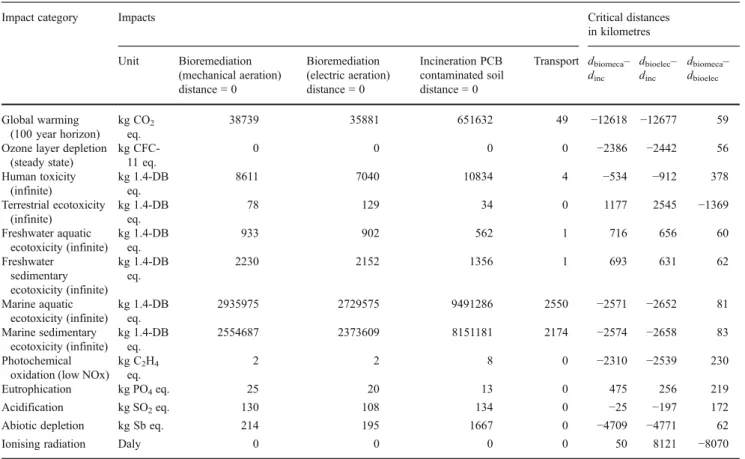
it seemed relevant to simulate variations in the distance that separated a contaminated site for the two remediation cen-ters. From the results, in the case of global warming, it was “better” for the environment to biologically treat soil up to a distance of approximately 12,600 km over that of the incin-eration center (Table7). In the same vein, for depletion of resources, the balance favored bioremediation at a distance disparity of 4700 km. However, for ionizing radiation, there were fewer impacts of incineration compared with biologi-cal treatment with mechanibiologi-cal aeration, up to a distance difference of approximately 8000 km. The iso-impact dis-tance differences were larger in absolute values when bio-remediation was favorable.
4.2 Electricity production mix
Electric aeration depends on the electricity production mix. French production is very specific, with 77% of the produc-tion from nuclear power, which is an energy that features a low carbon footprint. To test this hypothesis, the bioreme-diation scenario with electric aeration was calculated with the European electricity mix and compared to the French reference. Figure5 shows that eight impacts remained the same, irrespective of the production mix. The impact on ionizing radiation was twice as high for the French mix as for the European mix, which confirmed that nuclear power
Table 7 Critical distances for iso-impacts
Impact category Impacts Critical distances
in kilometres Unit Bioremediation (mechanical aeration) distance 0 0 Bioremediation (electric aeration) distance 0 0 Incineration PCB contaminated soil distance 0 0 Transport dbiomeca– dinc dbioelec– dinc dbiomeca– dbioelec Global warming (100 year horizon) kg CO2 eq. 38739 35881 651632 49 −12618 −12677 59
Ozone layer depletion (steady state) kg CFC-11 eq. 0 0 0 0 −2386 −2442 56 Human toxicity (infinite) kg 1.4-DB eq. 8611 7040 10834 4 −534 −912 378 Terrestrial ecotoxicity (infinite) kg 1.4-DB eq. 78 129 34 0 1177 2545 −1369 Freshwater aquatic ecotoxicity (infinite) kg 1.4-DB eq. 933 902 562 1 716 656 60 Freshwater sedimentary ecotoxicity (infinite) kg 1.4-DB eq. 2230 2152 1356 1 693 631 62 Marine aquatic ecotoxicity (infinite) kg 1.4-DB eq. 2935975 2729575 9491286 2550 −2571 −2652 81 Marine sedimentary ecotoxicity (infinite) kg 1.4-DB eq. 2554687 2373609 8151181 2174 −2574 −2658 83 Photochemical oxidation (low NOx)
kg C2H4 eq.
2 2 8 0 −2310 −2539 230
Eutrophication kg PO4eq. 25 20 13 0 475 256 219
Acidification kg SO2eq. 130 108 134 0 −25 −197 172
Abiotic depletion kg Sb eq. 214 195 1667 0 −4709 −4771 62
is importance in French production. The final four catego-ries (freshwater and marine water ecotoxicity (aquatic and sedimentary)) differed by less than a factor two. In regards to this sensitivity analysis, the electricity production mix did not significantly influence the environmental impacts of bioremediation with electrical aeration. The LCA results could be applied across Europe.
4.3 Limits
Bioremediation occurs on a simple platform composed pri-marily of concrete with a pump (in the case of electric aera-tion) and a few piezometers. Incineration requires the construction of a complex plant with a multitude of inputs. Nevertheless, incineration facilities for the treatment of PCB and other hazardous wastes are not built exclusively for con-taminated soil. The share of impacts from the burning of soil might be negligible. In addition, biological treatment requires 9 months, whereas incineration of the same quantity of soil requires a few hours to a few days. Land-use evaluation could also be relevant because biological treatment would require a larger surface to treat a high quantity of soil. The remediation market increased in the 2000s in France; however, the actual market/demand for decontamination remains very difficult to ascertain. Therefore, it has not been possible to include infra-structure impact in the limits of this work (Suez2006).
Apart from natural gas, the main inputs of the incinera-tion procedure, such as the lime and caustic soda, were not possible to estimate.
The potential gas emissions (CO2for the aerobic phase, CH4for the anaerobic phase) of the biological breakdown of soil are not known. The influence of the soil composition on homogenization during aeration is also unknown. The new biological process and the tried-and-tested incineration pro-cess must be compared with respect to the robustness and reliability of each technique.
Only secondary impacts have been evaluated in this life-cycle assessment. The “do nothing” scenario, which includes the primary impacts and an evaluation of the tertiary impacts, has not been explored. To this end, other methodologies, such as ecological risk assessment or health risk assessment, could be applied to complete the LCA results (Payet2008).
The stability of the deposited soil or clinker at a landfill could be measured to extend the system boundary.
The CML 2001 method was chosen even though it does not evaluate the impact of PCB emissions into the environ-ment. Nevertheless, the calculation of the latter using another method, such as IMPACT 2002+, produces a relatively similar picture with PCBs having less influence on the overall results.
5 Conclusions
A life-cycle assessment of three remediation scenarios for PCB-contaminated soils was analyzed. The attributional analysis highlighted the importance of soil transport, partic-ularly for the two bioremediation processes. The incinera-tion phase of the third procedure is responsible for the majority of the impacts. Biological treatment appears more environmentally friendly, especially in terms of global warming and depletion of abiotic resources. Furthermore, bioremediation with mechanical aeration has greater impacts than electric aeration. Nonetheless, the relative dif-ference between these two scenarios remains small because of the preponderance of the transport factor and because of the small influence of the electricity production mix on the results. The results of the LCA of the two technologies for PCB-contaminated soil remediation showed that this study could be a relevant basis on which to choose a soil remedi-ation technique according to environmental criteria.
The study and its limits demonstrate the necessity for in-depth knowledge of the incineration procedure inputs and of
0 10 20 30 40 50 60 70 A D A c i E u t G W 1 0 0 a O L D H T I n f. F W A E T I n f. M A E T I n f. T E I n f. M S E T I n f. F W S E T I n f. IR P h O x % BE/RER BE/FR
Fig. 5 Influence of electricity mix on environmental impacts of bioremediation techniques with electric aeration. European electricity mix (BE/RER) and French electricity mix (BE/FR) are compared
the technical parameters of bioremediation processes. LCA results should also be completed with other methodologies to answer questions about ecological risks, health risks and social acceptability.
Acknowledgements We would like to thank the Agence Nationale pour la Recherche et la Technologie (French National Agency for
Research) for their financial support under the aegis of a CIFRE thesis
contract (n° de convention 0046/2007).
References
Blanc A, Metivier-Pignon H, Gourdon R, Rousseaux P (2004) Life cycle assessment as a tool for controlling the development of technical activities: application to the remediation of a site con-taminated by sulfur. Adv Environ Res 8(3–4):613–627
Cadotte M, Deschênes L, Samson R (2007) Selection of a remediation scenario for a diesel-contaminated site using LCA. Int J Life Cycle Assess 12(4):239–251
Diamond ML, Page CA, Campbell M, McKenna S, Lall R (1999) Life-cycle framework for assessment of site remediation options: method and generic survey. Environ Toxicol Chem 18(4):788–800 Frischknecht R, Jungbluth N, Althaus H-J, Doka G, Dones R, Hischier
R, Hellweg S, Nemecek T, Rebitzer G, Spielmann M (2007) Overview and methodology. Final report Ecoinvent data v2.0, No. 1. Swiss Centre for Life Cycle Inventories, Dübendorf Hu X, Zhu J, Ding Q (2011) Environmental life-cycle comparisons of two
polychlorinated biphenyl remediation technologies: incineration and base catalyzed decomposition. J Hazard Mater 191(1–3):258–268 Huijbregts MAJ, Breedveld L, Huppes G, de Koning A, van Oers L, Suh
S (2003) Normalization figures for environmental life-cycle assess-ment: The Netherlands (1997/1998), Western Europe (1995) and the world (1990 and 1995). J Clean Prod 11(7):737–748
Jolliet O, Saadé M, Crettaz P (2005) Analyse du cycle de vie. Com-prendre et réaliser un écobilan. Collection Gérer l’Environnement. Presse Polytechniques et Universitaires Romandes, Lausanne Lemming G, Hausshild MZ, Bjerg PL (2010) Life cycle assessment of
soil and groundwater remediation technologies: literature review. Int J Life Cycle Assess 15(1):115–127
Lesage P, Ekvall T, Deschênes L, Samson R (2007a) Environmental assessment of brownfield rehabilitation using two different life cycle inventory models Part 1: methodological approach. Int J Life Cycle Assess 12(6):391–398
Lesage P, Ekvall T, Deschênes L, Samson R (2007b) Environmental assessment of brownfield rehabilitation using two different life cycle inventory models Part 2: case studies. Int J Life Cycle Assess 12(7):497–513
Morais SA, Delerue-Matos C (2009) A perspective on LCA applica-tion in site remediaapplica-tion services: critical review of challenges. J Hazard Mater 175(1–3):12–22
Morris M, Yuracko K, Govers RA (2000) Life cycle analysis for treatment and disposal of PCB waste at Ashtabula and Fernald.
http://www.ornl.gov/~webworks/cpr/v823/rpt/108437.pdf
Accessed 31 August 2011
Page CA, Diamond ML, Campbell M, McKenna S (1999) Life cycle framework for assessment of site remediation options: case study. Environ Toxicol Chem 18(4):801–810
Payet J (2008) Integrating Multiple Scale Impact Assessment on eco-systems for contaminated site management (MuSA Project). De-liverable 2.1: Similarities and differences between EcoRA and LCA. SNOWMAN project SN01/18. www.snowman-era.net/
downloads/MUSA_deliverable21.pdfAccessed 5 December 2010
Rahuman M, Pistone L, Trifirò L, Miertus S (2000) Destruction tech-nologies for polychlorinated byphenils (PCB).http://www.clu-in.
org/s.focus/c/pub/i/834/Accessed 31 August 2011
Sangely M, Sablayrolles C, Vialle C, Strehaiano P, Thannberger L, Montrejaud-Vignoles M (2009) Polychlorinated biphenyls frac-tioning in aqueous bioremediation assay with Phanerochaete
chrysosporium. Int J Environ Anal Chem 89(8):849–856
Sangely M (2010) Biodegradation of polychorinated biphenyls. Dis-sertation, INP-University of Toulouse, Toulouse
Séché Environnement (2010) Savoir-faire spécifiqueshttp://www.
groupe-seche.com/FR/Savoir-faires-specifiques_47.html Accessed
2 December 2010
Shen C, Tanga X, Cheemaa SA, Zhanga C, Khana MI et al (2009) Enhanced phytoremediation potential of polychlorinated biphenyl contaminated soil from waste recycling area in the presence of randomly methylated cyclodextrins. J Hazard Mater 172(2–3): 671–1676
Spielmann M., Bauer C, Tuchschmid M (2007) Life cycle inventories of transport services. Final report Ecoinvent v2.0 No. 14. Swiss Centre for Life Cycle Inventories, Dübendorf
Suer P, Nilsson-Påledal S, Norrman J (2004) LCA for site remediation: a literature review. Soil Sediment Contam 13(4):415–425 Suez Environnement (2006) Grands savoirs environnementaux:
dépol-lution des sites—terres polluées.http://www.suez-environnement.
fr/gse/depollution/fr/pdf/dossier_information.pdf Accessed 30
August 2011
Toffoletto L, Deschênes L, Samson R (2007) LCA of ex-situ bioreme-diation of diesel-contaminated soil. Int J Life Cycle Assess 10 (6):406–416
Volkwein S, Hurtig HW, Klopffer W (1999) Life cycle assessment of contaminated sites remediation. Int J Life Cycle Assess 4(5):263– 274
Zhou W, Anitescu G, Tavlarides LL (2004) Supercritical fluid extrac-tion–oxidation technology to remediate PCB-contaminated soils/ sediments: an economic analysis. Environ Prog 23(3):222–231