Running head: PSYCHOLOGICAL NEED SATISFACTION
Linking psychological need satisfaction and physical activity to dimensions of health-related quality of life during adolescence: A test of direct, reciprocal, and mediating effects 1 2 3 4 5 6 7
Abstract
Despite research attention towards understanding relationships between psychological need satisfaction (PNS), moderate-to-vigorous intensity physical activity (MVPA), and health-related quality of life (HRQoL), methodological limitations make it difficult to establish reciprocal and mediating effects. Reciprocal relationships between PNS and MVPA were
examined over four years and their effects on adolescents’ change in dimensions of HRQoL were examined. Self-reported data were collected from 932 adolescents (Mage=10.9 years) every four months beginning in grades 5/6. At the between- and within-person level, earlier PNS predicted later MVPA whereas earlier MVPA did not predict later PNS. Increases in MVPA were
associated with greater change in physical (βlinear=.61, βquadratic=.77, ps=.03) and social functioning (βlinear=.68, βquadratic=.84, ps=.03) but no other dimensions of HRQoL (p>.05). Decreases in PNS were not associated with any of the dimensions of HRQoL. Fostering adolescents’ PNS could be a starting point to increase MVPA which in turn may enhance select dimensions of HRQoL.
Key words; Physical Activity; Psychological Need Satisfaction; Quality of Life; Reciprocal; Longitudinal; Adolescents 8 9 10 11 12 13 14 15 16 17 18 19 20 21 22 23
Introduction
The majority of adolescents are not meeting physical activity guidelines (9%
ParticipACTION, 2015), and low physical activity has been associated with lower psychological indicators such as health-related quality of life (HRQoL; Gopinath, Hardy, Baur, Burlutsky, & Mitchell, 2012; Lacy et al., 2011). As such, researchers have turned to theoretical models to elucidate methods to enhance HRQoL. Self-determination theory (SDT; Deci & Ryan, 2000) is an organismic dialectic theory of human motivation and functioning that can be used to
understand adolescents’ behaviours and psychological outcomes. At the heart of SDT lies the fundamental and essential psychological needs for competence (i.e., a feeling that one can successfully complete personally challenging tasks), autonomy (i.e., a feeling of ownership over behaviour), and relatedness (i.e., a feeling of belonging and connection with important others). When fulfilled, these three psychological needs provide the necessary nurturance for optimal growth and development (Deci & Ryan).
The Nature of the Relationship between PNS and MVPA
The foundation of SDT lies on the premise of reciprocal relationships between PNS and social contexts (Deci & Ryan, 2000). Physical activity typically occurs in social contexts that can facilitate or hinder PNS (Ryan, Williams, Patrick, & Deci, 2009). Accordingly, when the social context of physical activity nurtures PNS, people will gravitate toward behavioural engagement which in turn gives rise to energy and further facilitates PNS (Deci & Ryan, 2002, 2011; Ryan et al., 2009). Despite the hypothesized reciprocal relationships between PNS and MVPA,
researchers have typically examined unidirectional associations. For instance, researchers have tested physical education-related PNS as an antecedent of MVPA (McDavid, Cox, &
McDonough, 2014; Standage, Gillison, Ntoumanis, & Treasure, 2012; Taylor, Ntoumanis, 24 25 26 27 28 29 30 31 32 33 34 35 36 37 38 39 40 41 42 43 44 45 46
Standage, & Spray, 2010), whereas others have tested PNS as an outcome of MVPA (Gunnell, Mack, Wilson, & Adachi, 2011; Mack et al., 2012). To our knowledge, researchers have yet to examine reciprocal relationships between PNS and MVPA in physical activity contexts.
In sport and education contexts, researchers have tested the reciprocal relationships between PNS and behavioural engagement (T. Curran, Hill, Ntoumanis, Hall, & Jowett, 2016; Jang, Kim, & Reeve, 2012; Reeve & Lee, 2014). Whereas these researchers have provided preliminary evidence of reciprocal effects between PNS and sport and educational engagement, the pattern of effects does not appear to be consistent across studies. T. Curran et al. (2016) found reciprocal relationships between PNS and sport engagement, though only from mid-season to season-end and not from season start to mid-season. Similar results were found by Jang and colleagues (2012) in educational contexts. In contrast, Reeve and Lee (2014) found no evidence that time 1 PNS predicted school engagement at time 2, although time 2 engagement predicted time 3 PNS. Finally, in a recent study, Gunnell and colleagues (Gunnell, Bélanger, & Brunet, 2016) found evidence from two models that change in PNS can be both and outcome and antecedent to change in MVPA, although their analyses did not directly test reciprocal relationships. These divergent findings highlight the need for more research.
A limitation of past research is that with a few exceptions (McDavid et al., 2014; Taylor et al., 2010), investigators have typically employed between-person analyses to examine the relationships between PNS and MVPA. To this end, T Curran (2016) called for an examination of within-person effect when examining reciprocal SDT-based relationships. The between-person level of analysis allows us to examine if overall, individuals with higher PNS and/or MVPA have higher MVPA and/or PNS, respectively, compared to individuals lower on those factors. That is, between-person effects focus on overall rates of change over time and how the 47 48 49 50 51 52 53 54 55 56 57 58 59 60 61 62 63 64 65 66 67 68 69
overall rates of change covary (P. J. Curran, Howard, Bainter, Lane, & McGinley, 2014). Conversely, the within-person level of analysis allows us to examine whether someone who had higher than their own average on MVPA and/or PNS at one time point had higher than their own average PNS and/or MVPA at subsequent time points. In this way, within-person effects focus on time specific increases (or decreases) relative to that person’s underlying levels of a construct (P. J. Curran et al., 2014). Deci and Ryan’s (2011) theoretical hypotheses are specific to both variations across individuals (i.e., between-persons) and within one individual (i.e., within-person). When researchers fail to examine both between- and within-person effects it can create a disconnect between a theoretical model and a statistical model which in turn, undermines the meaning of empirically-based results (P. J. Curran et al., 2014). For example, using a between-person analytic framework comes at the cost of ignoring within-between-person variations in PNS and/or MVPA and attributing such variations to error. Ryan (1995) has argued that these within-person variations are not necessarily error given that a person will vary in their typical levels of PNS and/or MVPA in different situations, contexts, and time points. As such, a careful inspection of the consequences of such within-person variations is needed to understand how situation-specific differences in PNS and/or MVPA differentially affect outcomes. Finally, it is possible that between- and within-person effects could be in opposite direction (P. J. Curran & Bauer, 2011). It is therefore critical that researchers test both levels of analysis to ensure that their statistical models of reciprocal relationships are commensurate with theoretical tenets.
Detecting between- and within-person reciprocal relationships between PNS and MVPA is important not only from a theoretical perspective, but from a practical perspective as well. At both levels, if PNS predicts change in MVPA over time, then there is reason to target PNS to promote MVPA. However, if MVPA also predicts change in PNS over time, then restructuring 70 71 72 73 74 75 76 77 78 79 80 81 82 83 84 85 86 87 88 89 90 91 92
MVPA programs to provide opportunities for PNS may be a useful starting-point for effective behaviour maintenance interventions. Further, given that researchers have found that both PNS and MVPA are antecedents to HRQoL (Gillison, Standage, & Skevington, 2008; Lacy et al., 2011; Standage & Gillison, 2007; Standage et al., 2012), if there is evidence that PNS and MVPA reinforce each other over time and both are associated with HRQoL, it would suggest that both PNS and MVPA could be targeted to optimally enhance HRQoL in adolescents. Health-Related Quality of Life
In adolescents, HRQoL is conceptualized as individuals’ perceptions of their own functioning on multiple dimensions encompassing physical, emotional, social, and school domains (Varni, Seid, & Rode, 1999). Assessing HRQoL is important because it can be used to differentiate healthy adolescents from those that are at risk or living with chronic conditions (Varni et al., 1999). Based on the link between HRQoL and health indicators such as obesity (Schwimmer, Burwinkle, & Varni, 2003) and mental health disorders (Sawyer et al., 2002), as well as the findings that HRQoL decreases during adolescence (see Bisegger et al., 2005 for review), researchers have investigated factors that contribute to better HRQoL in an effort to inform intervention strategies. In fact, MVPA is associated with better overall HRQoL (Iannotti et al., 2009; Lacy et al., 2011; Standage et al., 2012), and particularly with the physical and social functioning dimensions of HRQoL in adolescents (Gopinath et al., 2012). Drawing on SDT and the hypothesis that PNS promotes healthy functioning and well-being (Deci & Ryan, 2000), researchers have also found that experiencing PNS in physical activity contexts can promote overall HRQoL in adolescents (Standage & Gillison, 2007; Standage et al., 2012). Despite these initial findings, researchers have often only examined either PNS or MVPA as antecedents of HRQoL (Gopinath et al., 2012; Iannotti et al., 2009; Lacy et al., 2011; Standage & 93 94 95 96 97 98 99 100 101 102 103 104 105 106 107 108 109 110 111 112 113 114 115
Gillison, 2007). Consequently, the unique direct and indirect effects of PNS and MVPA on dimensions of HRQoL remain largely unknown. Understanding these dynamic relationships would serve to inform intervention research and reiterate the necessity to focus on both PNS and MVPA in interventions to promote HRQoL in adolescents.
Study Purposes and Hypotheses
The overall purpose of this investigation was to examine the between- and within-person relationships between PNS and MVPA over four years and how these relationships mutually reinforce each other to affect change in dimensions of HRQoL. The current study extends and expands upon a previous paper (Gunnell et al., 2016), in which we used the Monitoring
Activities to Comprehend their Habits Cohort Study (MATCH; Bélanger et al., 2013) to examine if (1) PNS can be accurately measured over three years and (2) if changes in PNS predicted changes in MVPA over three years at the between-person level of analysis. Although a
reciprocal model was not tested in our previous research, we examined an alternative model in which we found that changes in MVPA also predicted changes in PNS over three years. It is worth noting that the Gunnell et al., (2016) study has components that will not be specifically examined and discussed in the current study. First, our previous work examined longitudinal invariance of PNS scores and discussed the implications of such analysis for researchers
conducting longitudinal investigations. Second, our previous work found that overall changes in PNS could serve as both and antecedent and outcome of overall changes in MVPA (i.e., change predicting change) at the between-person level of analysis. Finally, the previous work used analytic procedures (i.e., multiple indicator factor-of-curves modeling) to elucidate the while simultaneously removing measurement error. As such, readers are referred to Gunnell et al. (2016) for information about longitudinal invariance of PNS scores, how PNS and MVPA ‘move 116 117 118 119 120 121 122 123 124 125 126 127 128 129 130 131 132 133 134 135 136 137 138
together in time’ (i.e., slopes predict slopes; not examined herein), and to provide an error-free estimation of these relationships. Since the publication of our previous study, MATCH data collection has been ongoing and included a measure of HRQoL. Therefore, building off our previous study and to further explore the reciprocal relationships between PNS and MVPA and how they mutually reinforce HRQoL, the current study will (1) use an additional 16 months (i.e., four additional time points) of data not reported in Gunnell et al., (2016), (2) use sophisticated models to simultaneously disentangle between- and within-person effects to directly test
reciprocal relationships between PNS and MVPA, and(3) examine how these relationships relate to change in dimensions of HRQoL.
Based on SDT (Deci & Ryan, 2000, 2011; Ryan et al., 2009) and previous literature (Gillison et al., 2008; McDavid et al., 2014; Standage & Gillison, 2007; Taylor et al., 2010) specific purposes and hypotheses were tested. The first purpose was to test the hypothesis of reciprocal relationships between PNS and MVPA during adolescence at the between- and within-person level of analysis separately. We hypothesized (H) that:
H1a. When participants reported higher than their own average PNS at one time point, they would report higher than their own average of MVPA at the next time point (i.e., within-person level effect).
H1b. When participants reported higher than their own average MVPA at one time point, they would report higher than their own average of PNS at the next time point (i.e., within-person level effect).
H2a. In general, participants reporting higher PNS in grade 5 or 6 would have more rapid increases in MVPA over four years (i.e., between-person level effect).
H2b. In general, participants reporting higher MVPA in grade 5 or 6 would have more rapid 139 140 141 142 143 144 145 146 147 148 149 150 151 152 153 154 155 156 157 158 159 160 161
increases in PNS over four years (i.e., between-person level effect).
The second purpose was to examine the between-person effects of MVPA and PNS on change in four dimensions of HRQoL. Specifically, we examined if: (a) if initial MVPA, time 12 and 13 MVPA1, and overall change in MVPA over four years directly predicted change in dimensions of HRQoL, and (b) if initial PNS, time 12 and 13 PNS 1, and overall change in PNS over four years predicted change in dimensions of HRQoL. Of note, within-person effects for HRQoL were not estimated given that difference scores were used. We hypothesized that:
H3. Increases in physical, emotional, social, and school dimensions of HRQoL would be predicted by higher initial MVPA, higher time 12 and 13 MVPA, and greater overall increases in MVPA over four years (i.e., between-person level effect).
H4. Increases in physical, emotional, social, and school dimensions of HRQoL would be predicted by higher initial PNS, higher time 12 and 13 PNS, and greater overall increases in PNS over four years (i.e., between-person level effect).
The third purpose was to test indirect effects of (a) PNS to change in dimensions of HRQoL via MVPA , and (b) MVPA to change in dimensions of HRQoL via PNS . We hypothesized that:
H5a. The effects of PNS on change in dimensions of HRQoL would be mediated by MVPA H5b. The effects of MVPA on change in dimensions of HRQoL would be mediated by PNS (i.e., between-person effect).
Examining these research questions in adolescents is justified because (a) adolescence is characterized by ongoing growth and development, providing a good opportunity to test Deci and Ryan’s assertions regarding how PNS can influence and be influenced by behaviours such as MVPA (Deci & Ryan, 2000; Ryan et al., 2009), (b) adolescence is a time when MVPA behaviours (Dumith, Gigante, Domingues, & Kohl, 2011) and HRQoL (Bisegger et 162 163 164 165 166 167 168 169 170 171 172 173 174 175 176 177 178 179 180 181 182 183 184
al., 2005) begin to decrease, and (c) other investigators who have examined reciprocal relationships with PNS have done so with adolescents (T. Curran et al., 2016) or young adults (Reeve & Lee, 2014) which allows for comparisons across studies.
Method Participants and Procedures
Participants were adolescents who were participating in the MATCH study (see
(Bélanger et al., 2013; Gunnell et al., 2016).2 Institutional ethical approval was obtained by the Comité d’Éthique de la Recherche du Centre Hospitalier de l’Université de Sherbrooke prior to the start of data collection. Information packages outlining MATCH study procedures and consent forms were sent to parents and children to be completed and returned to the school. Both participants and their parents provided active informed consent. The MATCH cohort study began in the Fall of 2011 when adolescents were in grades 5 or 6. Data were collected from English- and French-speaking adolescents originally from 17 schools in New Brunswick, Canada. All English questionnaires underwent thorough translation procedures (see Bélanger et al., 2013). Paper-and-pencil self-report questionnaires are completed tri-annually (Fall, Winter, and Spring) until participants graduate from grade 12. At the time of analyses, HRQoL data was only available at two time points; once when participants were in grade 8 or 9 and another time when students were in grade 9 or 10 (i.e., Fall of 2014 [time 10] and Fall of 2015 [time 13]).
Participants were 932 adolescents (nmale = 415 boys and 516 girls, one person reported both male and female at different cycles), who at study inception and as of November 1, 2011, ranged in age from 9.1 to 13.7 years (Mage = 10.9, SD = 0.6; nmissing = 1). At time 1, 51% of students and their parents invited to participate in the MATCH study consented and enrolled in the study. Based on participants’ reported postal codes and Canadian census data from 2006, the 185 186 187 188 189 190 191 192 193 194 195 196 197 198 199 200 201 202 203 204 205 206 207
mean income of parents was $37,602 (SD = 10,107; nmissing = 416). MATCH is a unique cohort study in that participants were allowed to join the study after time 1 (n = 39 joined in year 2, n = 92 joined in year 4). Only 216 students (23% of the total sample) left the study permanently (n = 118, n = 27, and n = 71 across years 2, 3, 4, respectively). Participants left the study permanently due to drop out or no longer being registered at one of the MATCH participating schools.
Beyond these reasons, it is not possible to determine the reasons for missing data at various time points for those who remained in MATCH as reasons were not tracked.
Measures
MVPA. As recommended by experts (Biddle, Gorely, Pearson, & Bull, 2011), a 2-item self-report measure of physical activity was used to assess MVPA (Prochaska, Sallis, & Long, 2001). Participants read the following instructions: “Physical activity is an activity that increases your heart rate and makes you get out of breath some of the time. Physical activity can be done in sports, playing with friends, or walking to school. Some examples of physical activity are running, brisk walking, rollerblading, biking, dancing, skateboarding, swimming, soccer, basketball, football, and surfing.” Then, they were asked to respond to two questions on a scale ranging from 0 (0 days) to 7 (7 days): “Over the course of the week (past 7 days), how many days were you physically active for a total of at least 60 minutes per day?”, and “Over the course of a typical or usual week, how many days are you physically active for a total of at least 60 minutes per day?” The items were consistent with MVPA guidelines to accumulate 60 minutes of MVPA daily (Tremblay et al., 2011). Scores on these two items have demonstrated validity and reliability compared to accelerometer scores (Hardie Murphy, Rowe, Belton, & Woods, 2015; Prochaska et al., 2001; Ridgers, Timperio, Crawford, & Salmon, 2012). An overall MVPA score was created by averaging both items (Sabiston & Crocker, 2008).
208 209 210 211 212 213 214 215 216 217 218 219 220 221 222 223 224 225 226 227 228 229 230
PNS. Perceived autonomy was assessed with the 7-item autonomy subscale from the Basic Psychological Needs in Life Scale (BPNLS; Gagné, 2003; example item "when I participate in physical activity, I feel like I can pretty much be myself"), and perceived
competence was assessed with 6-items from the Intrinsic Motivation Inventory (IMI; McAuley, Duncan, & Tammen, 1989; example item "I think I am pretty good at physical activity"). These two subscales were adapted to physical activity contexts. To this end, participants read the following instructional stem before all PNS subscales: “The following statements represent different feelings people have when they engage in physical activity. Using the scale provided, please answer the following questions by considering how you typically feel when participating in physical activity”. Items were answered on a scale ranging from 1 (not at all true) to 7 (very true). Based on previous research using time one to time nine of the MATCH data (see Gunnell et al., 2016) negatively-worded items from the BPNLS (n = 3) and the IMI (n = 1) were removed from further analysis. Perceived relatedness was measured using the 6-item Relatedness to Others in Physical Activity Scale (ROPAS; Wilson & Bengoechea, 2010; example item "I feel like I am part of a group who share my goals"). Items were answered on a scale ranging from 1 (false) to 6 (true). ROPAS scores were converted to the same scale as the IMI and BPNLS (i.e., 1-7) using the formula: (1.2 * original item score) - 0.2 = rescaled item score. Scores on the IMI, BPNLS and ROPAS within the MATCH dataset and in other samples have been shown to be valid and reliable (Gunnell et al., 2016; Sebire, Jago, Fox, Edwards, & Thompson, 2013; Standage et al., 2012; Taylor et al., 2010).
HRQoL. The 15-item Pediatric Quality of Life Inventory (PedsQL 4.0) generic core scales (Chen et al., 2014; Varni et al., 1999) was used to assess HRQoL. This instrument was developed for adolescents to assess four dimensions of functioning, including physical (5 items), 231 232 233 234 235 236 237 238 239 240 241 242 243 244 245 246 247 248 249 250 251 252 253
emotional (4 items), social (3 items), and school functioning (3 items). Participants were asked to rate each item on a scale of 0 (never) to 4 (almost always) to indicate how much of a problem each item was for them (e.g., “It is hard for me to walk more than one block”, “I have trouble getting along with other kids”). Consistent with recommendations (Varni et al., 1999), all items were reverse scored such that higher scores represented higher physical, emotional, social, and school functioning. Scores from the PedsQL have demonstrated score validity and reliability with adolescents (Chen et al., 2014; Varni et al., 1999).
Data Analysis
Preliminary Analyses. First, given that English and French versions of the instruments were used, we examined confirmatory factor analysis (CFA) based invariance and found that there was evidence of partial invariance between instrument versions at time 1 (i.e., all factor loadings were invariant, all but two intercepts were invariant, and all errors were invariant across English- and French-speaking participants). Second, given the large number of items used to assess the variables included in our final proposed model (described below) and based on the findings that the bulk of items were invariant across English and French versions of the instrument, we undertook preliminary analyses to create composite scores. This approach was necessary because using a fully latent variable model could result in insufficient power and imprecise parameter estimates (Brown, 2006). Our approach used to create these scores and then using them as manifest variables within the main analyses is consistent with past research in which researchers have used similar analytic methods and variables (e.g., Morin, Maïano, Marsh, Janosz, & Nagengast, 2011; Reeve & Lee, 2014; Sebire et al., 2013). We computed a composite PNS score by averaging the mean scores obtained for competence, autonomy, and relatedness. We deemed the use of the PNS manifest variable suitable as the Cronbach’s alphas of each PNS 254 255 256 257 258 259 260 261 262 263 264 265 266 267 268 269 270 271 272 273 274 275 276
manifest variable at each time point ranged from .80 to .88. Further, we examined a latent variable model of PNS at each time point represented by the respective manifest subscales of competence, autonomy, and relatedness and we found that there was evidence of longitudinal invariance (i.e., factor loadings, intercepts, and residuals were equal; Cheung & Rensvold, 2002), indicating that the responses to the PNS questionnaire could be used to assess change over time.
Main analyses. The main analyses were conducted in Mplus 7.3 with Robust Full Information Maximum Likelihood Estimation to account for possible non-normality in responses and to handle missing data, which ranged from 21.2% to 51.1% across all items of the PedsQL and manifest variables of competence, autonomy, relatedness, and MVPA at any given time point. Prior to examining the main research questions, latent curve models (LCM) were ran independently for PNS and MVPA to determine the shape of the trajectory (i.e., slopes) of change over time. The presence of significant linear slopes would indicate that PNS and/or MVPA increased or decreased over time in a constant linear rate (Bollen & Curran, 2006). The presence of significant linear and quadratic slopes would indicate that PNS and/or MVPA changed more rapidly (or slowly) at different points across time (Bollen & Curran, 2006).
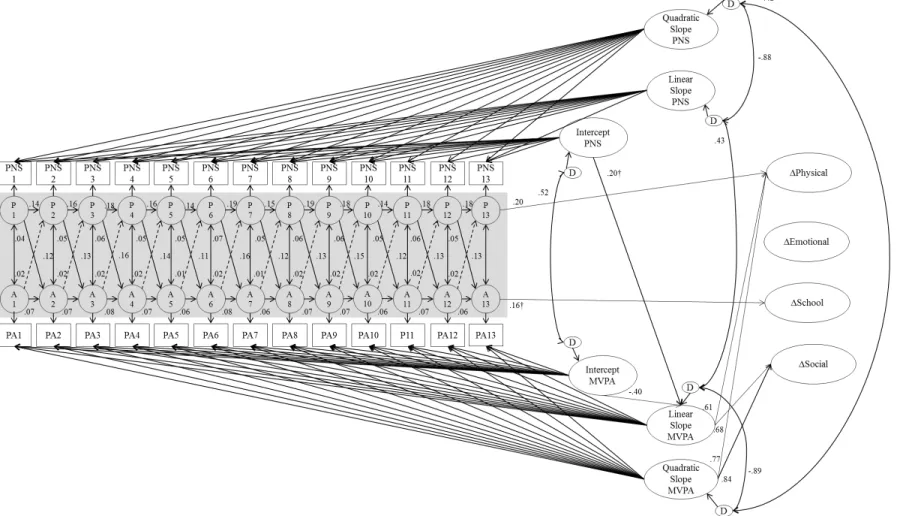
To examine the between- and within-person associations of change in PNS and MVPA, we used LCM with structured residuals analyses (LCM-SR; Curran, Howard, Bainter, Lane, & McGinley, 2014). In Figure 1, the non-shaded area shows the between-person portion of the model and reflects the average PNS and MVPA at baseline (i.e., intercepts) and the average trajectory of change in PNS and MVPA over time (i.e., slopes). The shaded area shows the within-person portion of the model and represents if one variable (e.g., MVPA at time 1) predicts the second variable at the subsequent time point (e.g., PNS at time 2) controlling for previous levels of that variable (e.g., PNS at time 1). At the between-person level, we also examined if 277 278 279 280 281 282 283 284 285 286 287 288 289 290 291 292 293 294 295 296 297 298 299
changes in physical, emotional, social, and school functioning were predicted by (1) higher initial MVPA/PNS (i.e., intercepts), (2) higher time adjacent (time 12 and time 13)1 levels of MVPA/PNS, and (3) trajectories of change over four years (i.e., slopes) in MVPA/PNS. At the between-person level, to test whether MVPA predicted change in each dimension of HRQoL via PNS and vice versa (i.e., indirect effects), we re-estimated the final model requesting 5,000 bootstrapped resamples and interpreted the 95% bias corrected confidence intervals (BcCI; Preacher & Hayes, 2008). Information about each step of analysis is presented with the results.
A non-significant MLRχ2 was interpreted as good data-model fit. Given the debate about the common practice of eschewing a significant chi-square test based on its sensitivity to sample size (see McAuley et al., 1989; McIntosh, 2012), attempts were made to locate the source of misspecification if the MLRχ2 was significant. If the sources of misspecification could not be made based on theory or model constraints, alternative sources of model fit were considered. We examined and interpreted the Comparative Fit Index (CFI; values close to or > .90 indicate acceptable fit) and Root Mean Square Error of Approximation (RMSEA; values close to or < .08 indicate acceptable fit; Brown, 2006; Hu & Bentler, 1999). We inspected parameter estimates for out of range values (e.g., standardized loadings over 1.0) and interpreted the proportion of explained variance (i.e., R2 values). We compared nested models through the MLRΔχ2 test (Colwell, 2015). Non-significant MLRΔχ2 (p > .05) was interpreted as a non-significant
improvement or degradation of a model fit, along with interpreting the absolute CFI and RMSEA values. Finally, statistical significance was set at p < .05; however, consistent with trends in social psychology (see Pritschet, Powell, & Horne, 2016 for review) and owing to the complexity of the models herein, we present results wherein the p- value fell below .07.
Results 300 301 302 303 304 305 306 307 308 309 310 311 312 313 314 315 316 317 318 319 320 321 322
Data were analyzed in four steps following P. Curran and colleagues (2014) suggestions. Step One: Univariate model for MVPA. A LCM of MVPA was estimated by
specifying a random latent intercept (λ = 1) and despite a significant MLRχ2,we found that a random linear slope (λ = 0, .1, .2, .3, .4, .5, .6, .7, .8, .9, 1, 1.1, 1.2) plus random quadratic slope (λ = 0, .01, .04, .09, .16, .25, .36, .49, .64, .81, 1.0, 1.21, 1.44) fit the data best (Model 1MVPA, Table 1, Figure 2). Attempts to manage the source of misspecification were made (e.g., adding correlated errors between indicators over time), yet the MLRχ2 remained significant. Because other fit indices and parameter values supported the tenability of the model, it was retained. Based on parameters from this model, participants had a mean MVPA score of 4.38 at time 1, and individual scores varied around this mean (variance = 2.04). Over four years, MVPA increased significantly (linear slope = 1.08, p < .05) up to about time 8, corresponding with the winter of grade 8 or 9 at which point this level of increase slowed down and began to decrease (quadratic slope = -0.78, p < .05; see Figure 2). Individual scores varied in the rate of change (linear slope variance = 9.76, quadratic slope variance = 5.31, p < .05). We then added
autoregressive paths with equality constraints among time adjacent residuals to this model (paths ‘a’ for MVPA indicators only, Figure 1). The fit of this model was good based on CFI and RMSEA indices and parameter estimates (Model 2 MVPA, Table 1) and significantly better than Model 1MVPA (MLRΔχ2(1) = 13.11, p < .05). The autoregressive parameters (b = 0.08)3 were significant (p = .001), indicating that prior MVPA significantly predicted subsequent MVPA.
Step Two: Univariate model for PNS. Step one was repeated for PNS. The LCM with a random linear and quadratic slope factor provided the best fit to the data (Model 1PNS, Table 1, Figure 2). The MLRχ2 was significant in this model and the source of misspecification could not be located or rectifiedthrough post-hoc modifications. Nonetheless, goodness-of-fit statistics and 323 324 325 326 327 328 329 330 331 332 333 334 335 336 337 338 339 340 341 342 343 344 345
parameter estimates were acceptable. At time 1, participants had a mean PNS score of 5.12, and individual scores varied around this mean (variance = 0.85, p < .05). Over the four years, PNS decreased significantly (linear slope = -0.54, p < .05) up to around time six, corresponding with the spring of grade 7 or 8 at which point the rate of decrease tapered off afterwards (quadratic slope = .25, p = .02; see Figure 2). Individual scores varied in the rate of change (linear slope variance = 5.97, quadratic slope variance = 3.15, p’s < .05). We then added autoregressive paths with equality constraints among time adjacent residuals to this model (see paths ‘a’ for PNS indicators only, Figure 1). The fit of this model was good (Model 2PNS, Table 1) and significantly better than Model 1PNS (MLRΔχ2(1) = 53.58, p < .01). The autoregressive parameters (b = 0.17)3 were significant (p < .01), indicating that prior PNS significantly predicted subsequent PNS.
Step 3: Bivariate model of MVPA and PNS. We combined Model 2MVPA and Model 2PNS into one bivariate model. The intercepts and slopes of PNS and MVPA were allowed to covary, and covarying time-specific residuals with equality constraints across times 2 to 13 between PNS and MVPA (paths labelled ‘b’, Figure 1) were specified. We did not place equality constraints on time 1 because time 1 residuals were not conditioned on prior measures. This model fit the data well based on CFI and RMSEA indices and parameters estimates (Model 3, Table 1). Using Model 3 as the baseline model, we tested three additional models sequentially to determine the direction of the relationships between PNS and MVPA at the within-person level of analysis (H1).
In Model 4, cross-lagged regression paths (paths labelled ‘c’, Figure 1) were added to Model 3 to determine if within-person variation in PNS predicted subsequent within-person variation in MVPA. Model 4 provided a good fit to the data based on CFI and RMSEA indices and parameters estimates (Table 1), and was not significantly better or worse than Model 3 346 347 348 349 350 351 352 353 354 355 356 357 358 359 360 361 362 363 364 365 366 367 368
(MLRΔχ2
(12) = 15.93, p = .19). Model 4 was re-estimated adding equality constraints over time and the constraints did not significantly degrade the fit of the model (MLRΔχ2
(11) = 8.49, p = .67), suggesting that the size of the effect of PNS on MVPA was similar over time. In Model 5, cross-lagged regression paths (paths labelled ‘d’, Figure 1) were added to Model 3 to examine if within-person variation in MVPA predicted within-person variation in PNS. Model 5 was a good fit to the data based on CFI and RMSEA indices and parameters estimates (Table 1), and was not significantly different from Model 3 (MLRΔχ2
(12) = 4.92, p = .96). Model 5 was re-estimated adding equality constraints to the regression paths and the constraints did not significantly degrade the fit of the model (MLRΔχ2
(11) = 4.96, p = .93), indicating that the size of the effect of MVPA on PNS was similar over time. Therefore, equality constraints were retained.
Model 6, a reciprocal model wherein both cross-lagged regression paths were added simultaneously (akin to combining Models 4 and 5 with equality constraints over time), provided a good fit to the data based on CFI and RMSEA indices and parameters estimates (Table 1), and was significantly better compared to Model 3 (MLRΔχ2
(2) = 8.34, p = .02).
Step Four: PNS and MVPA as Predictors of Change in Dimensions of HRQoL. Before proceeding, we confirmed the tenability of a correlated four-factor model representing the PedsQL responses using CFA at time 10 (MLRχ2
(84) = 114.30, p = .02, CFI = .99, RMSEA = .03, 90%CI [.01, .04]) and at time 13 (MLRχ2
(84) = 166.89, p < .01, CFI = .97, RMSEA = .04, 90%CI [.03, .05]), separately. Although the source of misspecification at time 10 could be rectified by allowing an emotional functioning item (“I feel angry”) to cross-load onto the school functioning latent factor (MLRχ2
(83) = 103.66, p = .06), the same item cross-loading was not present at time 13, and modification indices for the model tested using time 13 data suggested numerous small cross-loadings and error covariances that were not theoretically supported. As such, despite the 369 370 371 372 373 374 375 376 377 378 379 380 381 382 383 384 385 386 387 388 389 390 391
significant MLRχ2 test atboth time points, cross-loadings and error covariances were not added because the goodness-of-fit statistics and parameters estimates were acceptable and because adding these parameters could capitalize on chance produced by idiosyncrasies within the sample. Therefore, the model was interpreted as originally hypothesized with no modifications. After establishing longitudinal invariance of this model for the factor loadings, item intercepts, and residuals (available from the first author upon request), a latent difference score was created for each HRQoL dimension (Selig & Preacher, 2009). Results of the latent change score model provided a good fit to the data: MLRχ2
(385) = 638.21, p < .01, CFI = .96, RMSEA = .03, 90%CI [.03, .04], although the MLRχ2 was significant.
We then added the latent difference scores for each dimension of HRQoL to Model 6. In this model, we specified covariances between time 10 dimensions of HRQoL and time 10 PNS and MVPA residuals to account for within-time point variation. Aside from the significant MLRχ2, this mode (i.e., Model 7) provided a good fit to the data (Model 7, see Table 2). Regression paths were added to the model to test if (1) the residuals of MVPA/PNS from times 12 and 13, and (2) the intercepts and slopes of MVPA/PNS were associated with physical, emotional, social, and school functioning (H3 and H4; paths ‘e’, Figure 1). This model, with all intercepts and slopes allowed to covary (not shown in Figure 1), was a good fit to the data based on CFI and RMSEA indices, and parameters estimates (Model 8, Table 1).
Interpretation of the Results Alongside Hypotheses Based on the Final Model. Hypotheses were partially supported. H1a was supported because at the within-person level (i.e., estimates based on structured residuals), MVPA was higher than usual when PNS was higher than usual at the previous time point (βs = .04-.07, ps < .007) controlling for previous MVPA. However, H1b was not supported because changes in participants’ PNS were not influenced by their prior 392 393 394 395 396 397 398 399 400 401 402 403 404 405 406 407 408 409 410 411 412 413 414
change in MVPA. H2a was supported because at the between-person level (i.e., estimates based on intercepts predicting slopes), adolescents with initially high PNS had more rapid linear increases in MVPA (β = .20, p = .064). However, H2b was not supported because at the between-person level, initial levels of MVPA were not significantly related to changes in PNS (linear or quadratic). H3 was partially supported because (a) MVPA at time 13 predicted
increases in school functioning (β = .16, p = .069), and (b) more rapid linear increases in MVPA and more tapering off of the increase in MVPA were directly associated with increases in physical functioning (βlinear = .61, βquadratic = .77, p’s = .03) and social functioning (βlinear = .68, βquadratic = .84, p’s = .03). However, inconsistent with H3, time 12 MVPA and initial MVPA were not associated with changes in dimensions of HRQoL. We found limited support for H4:
although higher PNS at time 13 predicted increases in physical functioning (β = .20, p = .048), PNS at time 12, initial PNS, and changes in PNS (linear and quadratic slopes) were not
significantly related to change in any dimension of HRQoL. The final model accounted for 46%, 35%, 35%, and 33% of the variance in change in physical, emotional, social, and school
functioning, respectively. Finally, we re-estimated Model 8 with bootstrapping. Inconsistent with H5a and H5b, the effects of initial PNS on change in dimensions of HRQoL were not mediated by MVPA and the effects of initial MVPA on change in dimensions of HRQoL were not mediated by PNS, respectively.
Discussion
In this study, we examined how PNS in physical activity contexts and MVPA related to each other over four years in adolescents, and how they mutually influenced change in
dimensions of HRQoL. At the between- and within-person level, PNS predicted subsequent MVPA, whereas MVPA did not predict subsequent PNS. At the between-person level, initially 415 416 417 418 419 420 421 422 423 424 425 426 427 428 429 430 431 432 433 434 435 436 437
higher PNS was marginally associated with faster increases in MVPA which in turn, was associated with greater change in physical and social functioning; however, there was no evidence of indirect effects from earlier PNS or earlier MVPA to change in dimensions of HRQoL. In light of these findings, maintaining or enhancing PNS during early adolescence may help to promote greater increases in MVPA during adolescence which in turn may be related to greater change in physical and social functioning.
The Nature of the Relationship between MVPA and PNS
In general, the results did not support our hypotheses pertaining to the reciprocal relationships between PNS and MVPA. At both the between- and within-person levels of analysis, PNS was associated with subsequent MVPA (see below for descriptions of meaning of both types of effects). This finding supports Deci and Ryan’s (2011; Ryan et al., 2009) SDT-based contentions and previous research (McDavid et al., 2014; Standage et al., 2012; Taylor et al., 2010) that PNS provides the energy and impetus for continued engagement in MVPA. In contrast to theory (Ryan et al., 2009) and our hypotheses, MVPA was not associated with subsequent PNS at the between- or within-person level of analysis. Overall, our results have important theoretical implications given that reciprocal relationships between PNS and MVPA did not emerge at either the between- or within-person level of analysis.
Significant within-person effect of PNS on MVPA. At times when participants had higher than their own average of PNS they engaged in more MVPA than they usually did four months later, irrespective of overall change in PNS and overall change in MVPA. These results support Ryan’s (1995) contention that despite his/her global levels of PNS, an individual is likely to fluctuate from his/her own average and these time-specific fluctuations could represent
meaningful antecedents to outcomes. Therefore, based on the within-person findings, it may be 438 439 440 441 442 443 444 445 446 447 448 449 450 451 452 453 454 455 456 457 458 459 460
worthwhile to find strategies to ensure each adolescent maintains or enhances their own PNS levels in physical activity contexts to prevent subsequent decreases in MVPA.
Significant between-person effect of PNS on MVPA. Overall, adolescents with higher initial PNS were more likely (albeit, p = .069) to have faster increases in MVPA over four years compared to those who had lower initial PNS. Therefore, interventions can also be delivered to larger groups of adolescents to enhance global levels of PNS as overall increases in PNS would likely promote overall increases in MVPA over time.
Non-significant between- or within-person effects of MVPA on PNS. We found no evidence for reciprocal relationships between PNS and MVPA. The lack of reciprocal
relationship is inconsistent with previous research examining sport engagement (T. Curran et al., 2016) and education engagement (Jang et al., 2012), wherein the researchers noted effects in later time points of their longitudinal investigations. Results are also inconsistent with our previous research using MATCH data wherein we found support for two separate models indicating that changes in PNS could be both an antecedent and outcome of changes in MVPA (Gunnell et al., 2016). The inconsistencies between previous MATCH (Gunnell et al., 2016) results and the current results could stem from the fact that our previous study relied on the examination of between-person effects and two separate models involving slopes predicting slopes that did not directly test reciprocal relationships. As such a unique contribution of the current study was that with additional data and sophisticated analytic techniques to
simultaneously disentangle between-and within- person effects within on model we provided a better test of SDT and the reciprocity hypothesis.
There are several reasons why PNS and MVPA may not have shown a reciprocal relationship. For instance, we found that at the within-person level of analysis, PNS was 461 462 463 464 465 466 467 468 469 470 471 472 473 474 475 476 477 478 479 480 481 482 483
relatively stable across time points (i.e., every four months), hence there may have been less variation in PNS to be predicted by MVPA. Researchers may wish to examine the timing of measures to determine if MVPA influences PNS more distally (or proximally) by including assessments over longer (or shorter) durations. Further, researchers may wish to manipulate MVPA to determine if it precipitates changes PNS. Another plausible explanation for this non-significant finding is that we did not asses the types of MVPA or the social context in which MVPA was engaged, and therefore, it is not possible to know if adolescents were engaging in MVPA in contexts that were conductive to PNS (e.g., autonomy supportive contexts; Deci & Ryan, 2000; Standage et al., 2012). Researchers should examine if different types of MVPA (team sports, individual MVPA) and different MVPA contexts (e.g., autonomy supportive interpersonal styles from parents or teachers influences) moderate the association between prior MVPA and later PNS to determine the conditions in which an association may be present. MVPA and PNS Predicting Subsequent Change in Dimensions of HRQoL
Based on theory (Deci & Ryan, 2000), researchers have suggested that greater PNS and MVPA will have direct and positive effects on overall HRQoL (Gillison et al., 2008; Iannotti et al., 2009; Lacy et al., 2011). Unique to the current study and not examine in our previous work (Gunnell et al., 2016), our results indicated that only change in physical and social functioning dimensions of HRQoL for adolescents were predicted by MVPA. This finding may stem from the likelihood that in order to have good physical functioning, one likely engages in some degree of MVPA (Gopinath et al., 2012). Further, MVPA often takes place in group settings (Smith, 2003) amongst friends, classmates, and neighbours which can enhance social connections and functioning. Nevertheless, our findings regarding predictors of change in each dimension of HRQoL were largely inconsistent with our hypotheses, theory (Deci & Ryan, 2000), and 484 485 486 487 488 489 490 491 492 493 494 495 496 497 498 499 500 501 502 503 504 505 506
empirical research (Lacy et al., 2011; Standage et al., 2012) given that initial PNS and overall change in PNS were not associated with any dimension of HRQoL and MVPA was not
associated with emotional or school functioning. Similarly, there was no evidence of significant indirect effects between PNS, MVPA, and change in dimensions of HRQoL or between MVPA, PNS, and change in dimensions of HRQoL.
It is possible that there was only weak support for the relationships between PNS with dimensions of change in HRQoL given that PNS was measured using positively worded items whereas HRQoL was measured using negatively worded items (McDonough & Crocker, 2007). For example, low PNS may not actively impede functioning on HRQoL dimensions whereas if psychological need frustration (i.e., the active frustrating of competence, autonomy, and relatedness; Deci & Ryan, 2000) were assessed, it is possible that the active frustration of psychological needs would yield lower scores on dimensions of HRQoL. Indeed, McDonough and Crocker (2007) noted that PNS was weakly related to negative affect, which is similar to items used to assess emotional functioning in the PedsQL (e.g., item = “I feel angry”). Social functioning items focused on issues related to social problems (e.g., “other teens tease me”) which may align more closely to an active frustration of needs rather than low need satisfaction. In the future, researchers may wish to examine PNS and psychological need frustration to determine if psychological need frustration is more strongly related to HRQoL as assessed through negatively worded items in the PedsQL whereas satisfaction may be more strongly related to positively worded items of HRQoL or indicators of well-being. Although this
explanation is plausible for the generally null findings between PNS and dimensions of HRQoL, it is important to keep in mind that changes in MVPA were associated with two dimensions of HRQoL indicating that the valence of the HRQoL wording does not appear to affect the 507 508 509 510 511 512 513 514 515 516 517 518 519 520 521 522 523 524 525 526 527 528 529
relationships between MVPA and dimensions of HRQoL. Thus, additional research is needed to examine the lack of significant associations between PNS and dimensions of HRQoL. For example, the inconsistency between our hypotheses around PNS and MVPA and dimensions of HRQoL could stem from the fact that a global measure of HRQoL was examined whereas PNS and MVPA were both context specific to physical activity contexts. According to Vallerand (1997), links between PNS and outcomes will be stronger when they are measured on the same level of domain specificity. In the future, it might be beneficial to examine perceptions of HRQoL during physical activity rather than globally.
Study Implications
At the within-person level, researchers, practitioners, and knowledge users should ensure that each adolescent maintains or increases their own PNS above their own average level. At the between-person level, it would be beneficial to promote overall PNS early in adolescence since it may be a useful starting point to initiate self-driven and intrinsically motivated overall increases in MVPA during the course of adolescence. At both levels (between- and within), PNS support could come in the form of parents and teachers being more autonomy supportive through enhancing interpersonal communications, providing structure, and supporting adolescents’ autonomy (Deci & Ryan, 2002; Standage et al., 2012). Further, parents and teahcers could encourage adolescents to engage in MVPA they choose to foster autonomy, that they find helps them feel a connection with important others to foster relatedness, and that they feel is personally challenging to them to foster competence (Ryan, Patrick, Deci, & Williams, 2008). In turn, if adolescents were increasing their MVPA it may lead to better physical and social functioning. Limitation of the Study and Future Recommendations
530 531 532 533 534 535 536 537 538 539 540 541 542 543 544 545 546 547 548 549 550 551
Limitations of this study are worth noting. First, the data were collected via self-report questionnaires which are vulnerable to response bias. Of note, although previous researchers have shown that physical activity decreases during adolescence (Dumith et al., 2011), the current study (and our previous MATCH work) shows that MVPA is increasing over time. The
discrepancy between previous literature and the MATCH data could stem from the fact that the measure of MVPA used in MATCH does not capture light intensities or shorter and longer durations of physical activity. Nonetheless, a unique finding in the current work compared to our previous work (Gunnell et al., 2016) work was that the current results with more time points (i.e., 4 time points spanning an addition 16 months) indicated that the increase in MVPA was tapering off over time – a finding that we were unable to test given convergence issues associated with estimating a quadratic effect in Gunnell et al., (2016). As the adolescents in the MATCH study progress through different developmental stages, it will be interesting to see if MVPA begins to decrease below initial levels. Second, the convenience sample of volunteer youth from New Brunswick limits the generalizability of the findings. Further, the requirement for active consent could have reduced the representativeness of our sample because active consent can cause underrepresentation from some segments of the population (Courser, Shamblen, Lavrakas, Collins, & Ditterline, 2009; Ellwood, Asher, Stewart, & ISAAC Phase III Study Group, 2010). Given that only 51% of students from schools recruited in the first year of the study participated, it is possible that the use of passive consent would have led to a higher proportion of students enrolled in the study. Finally, although we cannot speculate on the number of parents who did not let their child participate based on consent forms that were not returned, 12% of returned consent forms indicated that the child refused to participate. Third, caution is warranted when interpreting linear and quadratic slopes independently because they are presumed to occur 552 553 554 555 556 557 558 559 560 561 562 563 564 565 566 567 568 569 570 571 572 573 574
together. Fourth, although models had favorable goodness-of-fit statistics, parameters estimates, and theoretical justification, the MLRχ2 indicated that there were sources of misspecification (McIntosh, 2012; Ropovik, 2015). As analytic methods progress, computational demands decrease, and the LCM-SR model becomes more accessible, researchers could begin to employ alternative methods such as Bayesian statistics with informative priors to allow for non-trivial small cross-loadings to determine if these non-target loadings are sources of misfit. Fifth, HRQoL was only assessed at two time points, and therefore the shape of growth in HRQoL could not be assessed. Finally, although one of the benefits to examining within-person effects is that it washes out the effects of variation across persons (e.g., sex, ethnicity), researchers may wish to extend the model herein and examine the influence of other constructs in the
nomological network of SDT such as motivation and autonomy support. Conclusion
In this study, we extended previous examinations of SDT by simultaneously examining a between- and within-person reciprocal model of how PNS and MVPA influence each other and dimensions of HRQoL over four years. The results support Ryan’s (1995) arguments that PNS should be examined at both a global between-persons level (i.e., overall differences between people) and at the situation-specific level (i.e., deviations around an individual’s mean). At both the between- and within-person level, PNS predicted MVPA, whereas MVPA did not predict PNS. Also, more rapid increases in MVPA were associated with change in physical and social functioning dimensions of HRQoL. Overall, it appears that fostering (a) all young adolescents’ PNS early on and (b) their PNS at any time point may be beneficial for increasing overall and subsequent, respectively, MVPA. In turn increases in MVPA over four years may beneficial for enhancing physical and social functioning.
575 576 577 578 579 580 581 582 583 584 585 586 587 588 589 590 591 592 593 594 595 596 597
Footnotes
1. Based on an anonymous reviewer’s comment, paths from PNS and MVPA at time 12 and 13 were tested to allow for the examination of time-adjacent effects on dimensions of HRQoL. 2. A subset (N = 842) of these participants were used in a previously published study that used
only time 1 to time 9 of the MATCH data. The previously published study did not (a) directly examine reciprocal relationships between PNS and MVPA, (b) examine HRQoL, or (c) examine within-person effects between PNS and MVPA (Gunnell et al., 2016).
3. These betas are likely small given that they represent residuals that are left over after partialling out the between-person levels.
598 599 600 601 602 603 604 605 606
References
Bélanger, M., Caissie, I., Beauchamp, J., O’Loughlin, J., Sabiston, C., & Mancuso, M. (2013). Monitoring activities of teenagers to comprehend their habits: study protocol for a mixed-methods cohort study.
BMC Public Health, 13(1), 649. http://doi.org/10.1186/1471-2458-13-649
Biddle, S. J., Gorely, T., Pearson, N., & Bull, F. C. (2011). An assessment of self-reported physical activity instruments in young people for population surveillance: Project ALPHA. International Journal of
Behavioral Nutrition and Physical Activity, 8(1), 1. http://doi.org/10.1186/1479-5868-8-1
Bisegger, C., Cloetta, B., Bisegger, U. von, Abel, T., Ravens-Sieberer, U., & Group, the E. K. (2005). Health-related quality of life: gender differences in childhood and adolescence. Sozial- Und Präventivmedizin,
50(5), 281–291. http://doi.org/10.1007/s00038-005-4094-2
Bollen, K., & Curran, P. J. (2006). Latent Curve Models: A Structural Equation Perspective. Hoboken, NJ: Wiley-Interscience. Retrieved from
http://ca.wiley.com/WileyCDA/WileyTitle/productCd-047145592X.html
Brown, T. A. (2006). Confirmatory factor analysis for applied research. New York, NY, US: Guilford Press.
Chen, G., Ratcliffe, J., Olds, T., Magarey, A., Jones, M., & Leslie, E. (2014). BMI, Health Behaviors, and Quality of Life in Children and Adolescents: A School-Based Study. Pediatrics, 133(4), e868–e874. http://doi.org/10.1542/peds.2013-0622
Cheung, G. W., & Rensvold, R. B. (2002). Evaluating Goodness-of-Fit Indexes for Testing Measurement Invariance. Structural Equation Modeling: A Multidisciplinary Journal, 9(2), 233–255.
http://doi.org/10.1207/S15328007SEM0902_5 607 608 609 610 611 612 613 614 615 616 617 618 619 620 621 622 623 624 625 626
Colwell, S. (2015). Chi-Square Difference Test. Retrieved September 24, 2015, from http://www.uoguelph.ca/~scolwell/difftest.html
Courser, M. W., Shamblen, S. R., Lavrakas, P. J., Collins, D., & Ditterline, P. (2009). The Impact of Active Consent Procedures on Nonresponse and Nonresponse Error in Youth Survey Data: Evidence from a New Experiment. Evaluation Review, 33(4), 370–395. http://doi.org/10.1177/0193841X09337228
Curran, P. J., & Bauer, D. J. (2011). The Disaggregation of Within-Person and Between-Person Effects in Longitudinal Models of Change. Annual Review of Psychology, 62, 583–619.
http://doi.org/10.1146/annurev.psych.093008.100356
Curran, P. J., Howard, A. L., Bainter, S. A., Lane, S. T., & McGinley, J. S. (2014). The separation of between-person and within-between-person components of individual change over time: A latent curve model with structured residuals. Journal of Consulting and Clinical Psychology, 82(5), 879–894.
http://doi.org/10.1037/a0035297
Curran, T., Hill, A. P., Ntoumanis, N., Hall, H., & Jowett, G. E. (2016). A three-wave longitudinal test of self-determination theory’s mediation model of engagement and 1 disaffection in youth sport. Journal of
Sport & Exercise Psychology, 38, 15–29. http://doi.org/http://dx.doi.org/10.1123/jsep.2015-0016
Deci, E. L., & Ryan, R. M. (2000). The “What” and “Why” of Goal Pursuits: Human Needs and the Self-Determination of Behavior. Psychological Inquiry, 11(4), 227–268.
http://doi.org/10.1207/S15327965PLI1104_01
Deci, E. L., & Ryan, R. M. (2002). Handbook of self-determination research. Rochester, NY: University of Rochester Press. 627 628 629 630 631 632 633 634 635 636 637 638 639 640 641 642 643 644 645 646
Deci, E. L., & Ryan, R. M. (2011). Levels of Analysis, Regnant Causes of Behavior and Well-Being: The Role of Psychological Needs. Psychological Inquiry, 22(1), 17–22.
http://doi.org/10.1080/1047840X.2011.545978
Dumith, S. C., Gigante, D. P., Domingues, M. R., & Kohl, H. W. (2011). Physical activity change during adolescence: a systematic review and a pooled analysis. International Journal of Epidemiology, 40(3), 685–698. http://doi.org/10.1093/ije/dyq272
Ellwood, P., Asher, M. I., Stewart, A. W., & ISAAC Phase III Study Group. (2010). The impact of the method of consent on response rates in the ISAAC time trends study. The International Journal of Tuberculosis
and Lung Disease: The Official Journal of the International Union Against Tuberculosis and Lung Disease, 14(8), 1059–1065.
Gagné, M. (2003). The Role of Autonomy Support and Autonomy Orientation in Prosocial Behavior Engagement. Motivation and Emotion, 27(3), 199–223. http://doi.org/10.1023/A:1025007614869
Gillison, F., Standage, M., & Skevington, S. (2008). Changes in quality of life and psychological need satisfaction following the transition to secondary school. British Journal of Educational Psychology, 78(1), 149–162. http://doi.org/10.1348/000709907X209863
Gopinath, B., Hardy, L. L., Baur, L. A., Burlutsky, G., & Mitchell, P. (2012). Physical Activity and Sedentary Behaviors and Health-Related Quality of Life in Adolescents. Pediatrics, 130(1), e167–e174.
http://doi.org/10.1542/peds.2011-3637
Gunnell, K. E., Bélanger, M., & Brunet, J. (2016). A Tale of Two Models: Changes in psychological Need Satisfaction and Physical Activity Over 3 Years. Health Psychology, 35, 167–177.
http://doi.org/http://dx.doi.org/10.1037/hea0000259 647 648 649 650 651 652 653 654 655 656 657 658 659 660 661 662 663 664 665 666 667
Gunnell, K. E., Mack, D. E., Wilson, P. M., & Adachi, A. J. (2011). Psychological Needs as Mediators? The Relationship Between Leisure-Time Physical Activity and Well Being in People Diagnosed With
Osteoporosis. Research Quarterly for Exercise and Sport, 82(4), 794–798. http://doi.org/10.1080/02701367.2011.10599817
Hardie Murphy, M., Rowe, D. A., Belton, S., & Woods, C. B. (2015). Validity of a two-item physical activity questionnaire for assessing attainment of physical activity guidelines in youth. BMC Public Health, 15, 1080. http://doi.org/10.1186/s12889-015-2418-6
Hu, L., & Bentler, P. M. (1999). Cutoff criteria for fit indexes in covariance structure analysis: Conventional criteria versus new alternatives. Structural Equation Modeling: A Multidisciplinary Journal, 6(1), 1–55. http://doi.org/10.1080/10705519909540118
Iannotti, R. J., Janssen, I., Haug, E., Kololo, H., Annaheim, B., & Borraccino, A. (2009). Interrelationships of adolescent physical activity, screen-based sedentary behaviour, and social and psychological health.
International Journal of Public Health, 54(Suppl 2), 191–198. http://doi.org/10.1007/s00038-009-5410-z
Jang, H., Kim, E. J., & Reeve, J. (2012). Longitudinal test of self-determination theory’s motivation mediation model in a naturally occurring classroom context. Journal of Educational Psychology, 104(4), 1175–1188. http://doi.org/10.1037/a0028089
Lacy, K. E., Allender, S. E., Kremer, P. J., Silva-Sanigorski, A. M. de, Millar, L. M., Moodie, M. L., …
Swinburn, B. A. (2011). Screen time and physical activity behaviours are associated with health-related quality of life in Australian adolescents. Quality of Life Research, 21(6), 1085–1099.
http://doi.org/10.1007/s11136-011-0014-5 668 669 670 671 672 673 674 675 676 677 678 679 680 681 682 683 684 685 686 687
Mack, D. E., Wilson, P. M., Gunnell, K. E., Gilchrist, J. D., Kowalski, K. C., & Crocker, P. R. E. (2012). Health-Enhancing Physical Activity: Associations with Markers of Well-Being. Applied Psychology. Health and
Well-Being, 4(2), 127–150. http://doi.org/10.1111/j.1758-0854.2012.01065.x
McAuley, E., Duncan, T., & Tammen, V. V. (1989). Psychometric Properties of the Intrinsic Motivation Inventory in a Competitive Sport Setting: A Confirmatory Factor Analysis. Research Quarterly for Exercise
and Sport, 60(1), 48–58. http://doi.org/10.1080/02701367.1989.10607413
McDavid, L., Cox, A. E., & McDonough, M. H. (2014). Need fulfillment and motivation in physical
education predict trajectories of change in leisure-time physical activity in early adolescence. Psychology
of Sport and Exercise, 15(5), 471–480. http://doi.org/10.1016/j.psychsport.2014.04.006
McDonough, M. H., & Crocker, P. R. E. (2007). Testing self-determined motivation as a mediator of the relationship between psychological needs and affective and behavioral outcomes. Journal of Sport &
Exercise Psychology, 29(5), 645–663.
McIntosh, C. N. (2012). Improving the evaluation of model fit in confirmatory factor analysis: A commentary on Gundy, C.M., Fayers, P.M., Groenvold, M., Petersen, M. Aa., Scott, N.W., Sprangers, M.A.J., Velikov, G., Aaronson, N.K. (2011). Comparing higher-order models for the EORTC QLQ-C30. Quality of life research, doi:10.1007/s11136-011-0082-6. Quality of Life Research: An International
Journal of Quality of Life Aspects of Treatment, Care and Rehabilitation, 21(9), 1619-1621-1624.
http://doi.org/10.1007/s11136-011-0084-4
Morin, A. J. S., Maïano, C., Marsh, H. W., Janosz, M., & Nagengast, B. (2011). The Longitudinal Interplay of Adolescents’ Self-Esteem and Body Image: A Conditional Autoregressive Latent Trajectory Analysis.
Multivariate Behavioral Research, 46(2), 157–201. http://doi.org/10.1080/00273171.2010.546731
688 689 690 691 692 693 694 695 696 697 698 699 700 701 702 703 704 705 706 707 708
ParticipACTION. (2015). The Biggest Risk is Keeping Kids Indoors. The 2015 ParticipACTION Report Card
on Physical Activity for Children and Youth. Toronto: ParticipACTION. Retrieved from
http://www.participaction.com/report-card-2015/report-card/
Preacher, K. J., & Hayes, A. F. (2008). Asymptotic and resampling strategies for assessing and comparing indirect effects in multiple mediator models. Behavior Research Methods, 40(3), 879–891.
http://doi.org/10.3758/BRM.40.3.879
Pritschet, L., Powell, D., & Horne, Z. (2016). Marginally Significant Effects as Evidence for Hypotheses Changing Attitudes Over Four Decades. Psychological Science, 956797616645672.
http://doi.org/10.1177/0956797616645672
Prochaska, J., Sallis, J., & Long, B. (2001). A physical activity screening measure for use with adolescents in primary care. Archives of Pediatrics & Adolescent Medicine, 155(5), 554–559.
Reeve, J., & Lee, W. (2014). Students’ classroom engagement produces longitudinal changes in classroom motivation. Journal of Educational Psychology, 106(2), 527–540. http://doi.org/10.1037/a0034934
Ridgers, N. D., Timperio, A., Crawford, D., & Salmon, J. (2012). Validity of a brief self-report instrument for assessing compliance with physical activity guidelines amongst adolescents. Journal of Science and
Medicine in Sport, 15(2), 136–141. http://doi.org/10.1016/j.jsams.2011.09.003
Ropovik, I. (2015). A cautionary note on testing latent variable models. Frontiers in Psychology, 6, 1715. http://doi.org/10.3389/fpsyg.2015.01715
Ryan, R. M. (1995). Psychological needs and the facilitation of integrative processes. Journal of
Personality, 63(3), 397–427. 709 710 711 712 713 714 715 716 717 718 719 720 721 722 723 724 725 726 727 728
Ryan, R. M., Patrick, H., Deci, E. L., & Williams, G. C. (2008). Facilitating health behaviour change and its maintenance: Interventions based on Self-Determination Theory. The European Health Psychologist, 10, 1–4.
Ryan, R. M., Williams, G. C., Patrick, H., & Deci, E. L. (2009). Self-determination theory and physical activity: The dynamics of motivation in development and wellness. Hellenic Journal of Psychology, 6(2), 107–124.
Sabiston, C. M., & Crocker, P. R. E. (2008). Exploring Self-Perceptions and Social Influences as Correlates of Adolescent Leisure-Time Physical Activity. Journal of Sport & Exercise Psychology, 30(1), 3–22.
Sawyer, M. G., Whaites, L., Rey, J. M., Hazell, P. L., Graetz, B. W., & Baghurst, P. (2002). Health-related quality of life of children and adolescents with mental disorders. Journal of the American Academy of
Child and Adolescent Psychiatry, 41(5), 530–537. http://doi.org/10.1097/00004583-200205000-00010
Schwimmer, J., Burwinkle, T., & Varni, J. (2003). Health-related quality of life of severely obese children and adolescents. JAMA, 289(14), 1813–1819. http://doi.org/10.1001/jama.289.14.1813
Sebire, S. J., Jago, R., Fox, K. R., Edwards, M. J., & Thompson, J. L. (2013). Testing a self-determination theory model of children’s physical activity motivation: a cross-sectional study. International Journal of
Behavioral Nutrition and Physical Activity, 10(1), 111. http://doi.org/10.1186/1479-5868-10-111
Selig, J. P., & Preacher, K. J. (2009). Mediation Models for Longitudinal Data in Developmental Research.
Research in Human Development, 6(2–3), 144–164. http://doi.org/10.1080/15427600902911247
Smith, A. L. (2003). Peer relationships in physical activity contexts: a road less traveled in youth sport and exercise psychology research. Psychology of Sport and Exercise, 4(1), 25–39.
http://doi.org/10.1016/S1469-0292(02)00015-8 729 730 731 732 733 734 735 736 737 738 739 740 741 742 743 744 745 746 747 748 749
Standage, M., & Gillison, F. (2007). Students’ motivational responses toward school physical education and their relationship to general self-esteem and health-related quality of life. Psychology of Sport and
Exercise, 8(5), 704–721. http://doi.org/10.1016/j.psychsport.2006.12.004
Standage, M., Gillison, F. B., Ntoumanis, N., & Treasure, D. C. (2012). Predicting students’ physical activity and health-related well-being: a prospective cross-domain investigation of motivation across school physical education and exercise settings. Journal of Sport & Exercise Psychology, 34(1), 37–60.
Taylor, I. M., Ntoumanis, N., Standage, M., & Spray, C. M. (2010). Motivational predictors of physical education students’ effort, exercise intentions, and leisure-time physical activity: a multilevel linear growth analysis. Journal of Sport & Exercise Psychology, 32(1), 99–120.
Tremblay, M. S., Warburton, D. E. R., Janssen, I., Paterson, D. H., Latimer, A. E., Rhodes, R. E., … Duggan, M. (2011). New Canadian Physical Activity Guidelines. Applied Physiology, Nutrition, and Metabolism,
36(1), 36–46. http://doi.org/10.1139/H11-009
Vallerand, R. J. (1997). Toward A Hierarchical Model of Intrinsic and Extrinsic Motivation. In M. P. Zanna (Ed.), Advances in Experimental Social Psychology (Vol. 29, pp. 271–360). Academic Press. Retrieved from http://www.sciencedirect.com/science/article/pii/S0065260108600192
Varni, J. W., Seid, M., & Rode, C. A. (1999). The PedsQLTM: Measurement Model for the Pediatric Quality
of Life Inventory. Medical Care, 37(2), 126–139.
Wilson, P. M., & Bengoechea, E. G. (2010). The Relatedness to Others in Physical Activity Scale: Evidence for Structural and Criterion Validity. Journal of Applied Biobehavioral Research, 15(2), 61–87.
http://doi.org/10.1111/j.1751-9861.2010.00052.x 750 751 752 753 754 755 756 757 758 759 760 761 762 763 764 765 766 767 768 769 770
Table 1
Fit Statistics from Models Tested
Model MLRχ2
(df) Δ MLRχ2(df) CFI RMSEA RMSEA [90% CI]
Model 1MVPA: LCM of MVPA 192.66(82)* -- .96 .04 [.03, .05]
Model 2MVPA: MVPA with autoregressive paths 178.19(81)* 13.11(1)*a .97 .04 [.03, .04]
Model 1PNS: LCM of PNS 185.85(82)* -- .97 .04 [.03, .04]
Model 2PNS: PNS with autoregressive paths 122.29(81)* 53.58(1)*b .99 .02 [.01, .03] Model 3: Bivariate LCM-SR no cross-lagged paths 454.16(320)* -- .98 .02 [.02, .03] Model 4: Bivariate LCM-SR, PNS predicts MVPA 438.29(308)* 15.93 (12)c .98 .02 [.02, .03] Model 4a: with equality constraints 446.32(319)* 8.49(11)d .98 .02 [.02, .03] Model 5: Bivariate LCM-SR, MVPA predicts PNS 449.85(308)* 4.91 (12)c .98 .02 [.02, .03] Model 5a: with equality constraints 454.41(319)* 4.96(11)e .98 .02 [.02, .03] Model 6: Bivariate LCM-SR, reciprocal model 445.60(318)* 8.34 (2)* c .98 .02 [.02, .03] Model 7: LCM-SR plus HRQOL as outcome 2246.16(1483)* -- .95 .02 [.02, .03]
Model 8: Final Model 2152.47(1435) * -- .96 .02 [.02, .03]
Note * p < .05,. a compared to model 1
MVPA.b compared to model 1PNS. c compared to model 3. d compared to model 4. e compared to model 5. LCM = latent curve model, LCM-SR = latent curve model with structured residuals, MVPA = moderate-to-vigorous-intensity physical activity, PNS = psychological need satisfaction.
771 772 773 774 775 776
Figure 1. Hypothesized Model
Note. MVPA = moderate-to-vigorous-intensity physical activity, PNS = psychological need satisfaction. P = PNS residual, A = MVPA residual. For clarity, each latent difference variable and respective indicators for physical, emotional, school, and social functioning are not shown. Also not shown are covariances between errors of latent variables.
778 779 780 781 782 783