The purpose of this technical document is to analyze the evolution of the
competitiveness of agricultural trade in the Americas and to make policy recommendations aimed at boosting the region’s competitive positioning in world agrifood trade. The document begins by briefly describing agrifood trade in the Americas and its evolution over the past decade. Next, the competitiveness of agrifood trade and its evolution are analyzed using indicators for export concentration, revealed comparative advantage, economic complexity, and complementarity in bilateral trade. Lastly, a series of policy recommendations aimed at increasing the competitiveness of agrifood trade as well as improving In an interconnected world with increasing
specialization in production that capitalizes on the comparative advantages of
each economy, trade is one of the main avenues to socioeconomic development in countries.2 Countries in the Americas
currently face the challenge of improving, over the next few years, the participation of their most competitive sectors (including the agrifood and agroindustrial sectors) and the budding bioindustrial sector in international trade. This challenge is far from trivial, considering that, since 2000, Latin America and the Caribbean (LAC) has maintained its 6% share of world goods exports, which contrasts with the strong growth that Asia experienced during the same period.3
trade in the Americas
1. Prepared by Roberto Gabriel Delgado, member of the Network of Permanent Consultants of IICA’s International Trade and Regional Integration Hemispheric Program.
2. IICA (Inter-American Institute for Cooperation on Agriculture, Costa Rica). 2018. 2018-2022 Medium-term Plan. San Jose, Costa Rica.
3. ECLAC (Economic Commission for Latin America and the Caribbean, Chile). 2016. Latin America and the Caribbean in the World Economy, 2016. Santiago, Chile. (LC/G.2697-P).
the region’s participation in the global economy are provided.
Evolution of agrifood
trade in the Americas
(2008-2017)
The Americas has historically been a net exporter of food and agricultural commodities, due to its wealth of agricultural natural resources and the productivity gains it has achieved over time. In 2017, the region’s agrifood exports amounted to USD 475,216 million, representing 27.3% of the world’s total agrifood exports. Countries in Latin America and the Caribbean accounted for 50% of agrifood exports from the Americas, while the United States and
Canada accounted for the remaining 50%. In other words, exports from Latin America and the Caribbean represented 13.7% of world agrifood exports in 2017.4
On the other hand, that same year, agrifood imports in the Americas totaled USD 299,411 million, representing 17.1% of the world’s total agrifood imports. LAC countries accounted for 30% of imports, while the United States and Canada accounted for 70%. In absolute terms, this means that, in 2017, the region generated a surplus of approximately USD 176 billion in the agrifood trade balance, of which 148 billion were generated by Latin American and Caribbean countries.
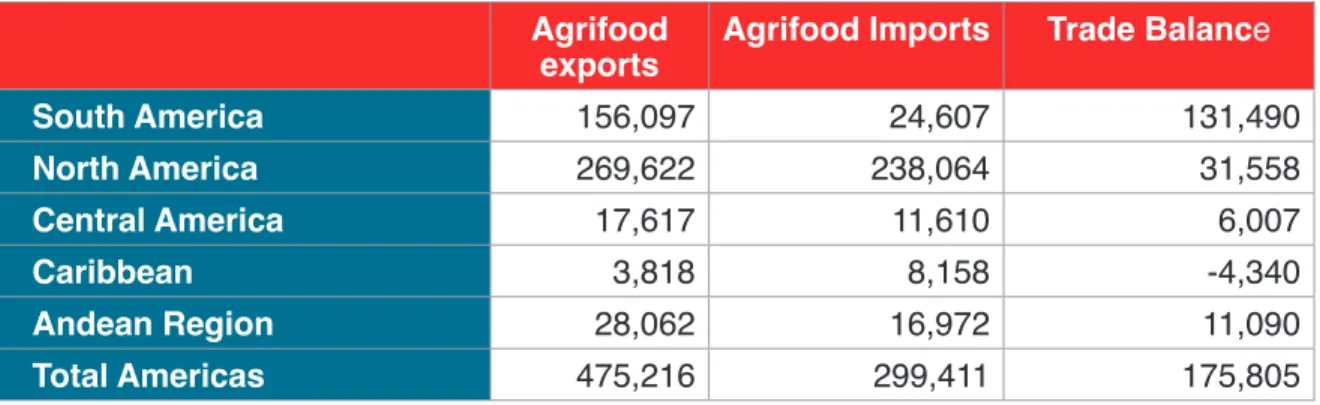
The following table illustrates the disparate results of the agrifood trade balance in the different regions of the Americas:
4. Compared to world agrifood exports, the percentage of agrifood exports from Latin America and the Caribbean has increased only slightly over the past decade (the percentage rose to 13% in 2008 according to WTO data, and has remained slightly above the reference value throughout the entire decade).
Table 1. Agrifood trade in the Americas in 2017 (in millions of USD).
Agrifood
exports Agrifood Imports Trade Balance South America 156,097 24,607 131,490 North America 269,622 238,064 31,558 Central America 17,617 11,610 6,007 Caribbean 3,818 8,158 -4,340 Andean Region 28,062 16,972 11,090 Total Americas 475,216 299,411 175,805
South America accounts for more than 70% of the agrifood trade surplus of the Americas. In the Americas, the countries with an agrifood trade deficit are the Dominican Republic, El Salvador, Jamaica, Barbados, Antigua and Barbuda, Saint Lucia, Saint Kitts and Nevis,
Saint Vincent and the Grenadines, and Suriname. Agrifood trade trends for the 2008-2017 period show that, following a period of stagnation from 2012 to 2016, the region experienced a slight recovery in agrifood exports in 2017, as a result of the end of a cycle of high prices that began at the turn of the century (refer to Graph 1 in the Annex).
The agrifood sector is of considerable importance to the export structure of most countries in the region. In 11 countries of the Americas, including Argentina, Brazil, Uruguay and Paraguay, exports from the agrifood sector represent more than 40% of total exports (refer to Graph 2 in the Annex).
Trade indicators
Export concentration
Developing countries with more diversified export baskets tend to exhibit greater stability with respect to export earnings and are less vulnerable to sudden changes in the international prices of specific products or to specific situations in the countries that receive their exports. Similarly, diversified export baskets
expand a country’s export base, which, in turn, fosters productivity, competitiveness and economic growth.5
The Herfindahl-Hirschman Index (HHI) was utilized to measure each country’s level of export concentration. The HHI can be used to measure the concentration of a country’s export basket in terms of products, as well as the concentration of a specific product in terms of the export destination countries. If, for instance, a country concentrates all of its exports on a single product, the HHI value will equal 1. If, on the other hand, the country’s exports are completely diversified, in such a way that each product’s share of total exports is very low, the HHI value will be closer to zero. A similar reasoning can be applied to the HHI value corresponding to export destination countries.
According to data for the year 2017 (UN Comtrade database), Canada is the country that exhibits the greatest amount of diversification in terms of the composition of its export basket, with a HHI of 0.024, followed by the United States (0.027), Chile (0.029) and Mexico (0.032). At the other end of the spectrum, Suriname is the country that exhibits the highest concentration, with a HHI of 0.224, followed by
Paraguay (0.195) and Honduras (0.191). With respect to the diversification of agrifood exports in terms of countries of destination, Argentina is the most diversified country, with a HHI of 0.037, followed by the United States (0.077) and Ecuador (0.078). Conversely,
5. Hesse, H. 2008. Export Diversification and Economic Growth. Washington, D. C., United States of America. (Working Paper 21); Hausmann, R; Klinger, B. 2006. Structural transformation and patterns of comparative advantage in the product space, Cambridge, Massachusetts, United States of America, Center for International Development at Harvard University (CID Working Paper No. 128).
Mexico, Jamaica, and Belize are the least diversified (refer to graphs 3 and 4 in the Annex).
In terms of the evolution of the HHI, the countries that have significantly improved the level of diversification of their export basket over the past ten years are Jamaica (which reduced its HHI by 0.097 units), Peru (-0.049) and El Salvador (-0.04); on the contrary, those that have further concentrated their exports over the same period are Brazil (whose HHI increased by 5.5 units), Bolivia (+0.054), Ecuador (+0.049) and Colombia (+0.046). With respect to the diversification of agrifood exports in terms of countries of destination, the countries whose concentration levels have dropped to the greatest extent over the past ten years are Jamaica (whose HHI decreased by 0.13 units), Belize (-0.085) and El Salvador (-0.063), while the Dominican Republic (increase of 0.086 units in the HHI), Bolivia (+0.076), Uruguay (+0.063) and Brazil (+0.055) have further concentrated their agrifood exports (refer to Graph 5 in the Annex).
Revealed comparative
advantage
The revealed comparative advantage (RCA) index is used to infer the
comparative advantages of countries in
international trade, using real trade flows. Although the RCA calculation is relatively complex, its interpretation is quite simple. If a product’s RCA is greater than zero, it can be inferred that the country has a comparative advantage in that product. Furthermore, the greater a product’s RCA, the more favorable its competitive position in the international market.6
Almost all countries in the Americas exhibit comparative advantages in agrifood
production; in this regard, three countries of the Southern Cone region (Argentina, Uruguay and Paraguay) have the highest comparative advantage. Furthermore, during the 2008-2017 period, the countries that boosted their comparative advantage in agrifood production were, in descending order, Ecuador, Mexico, the Dominican Republic, Argentina, Belize, Guatemala and Bolivia (refer to Graph 6 in the Annex).
Economic complexity index
The economic complexity index (ECI) proposed by Hausmann and Hidalgo (2009)7 is not strictly a trade index, but it
allows for analyzing additional aspects beyond the diversification of exports. ECI measures the knowledge intensity of an economy, taking into account the knowledge intensity of the products it exports. The complexity arises from the combination of two dimensions: diversification and ubiquity, the latter
6. This index is calculated using the methodology proposed by Vollrath (1991) in the article “A theoretical evaluation of alternative trade intensity measures of revealed comparative advantage,” Review of World Economics (Weltwirtschaftliches Archiv) 127(2):265-280.
7. Hidalgo, C; Hausman, R. 2009. The building blocks of economic complexity. Proceedings of the National Academy of Sciences of the United States 106 (26): 10570-10575.
of which is defined as the number of countries that export a specific product with a revealed comparative advantage. The purpose is to convey the ability of countries to export goods that require the coordination of high levels of knowledge, a key characteristic of this new era of technology development.
According to the ECI ranking for the year 2017, North American countries are among the top 25 countries with the highest economic complexity; the United States, Mexico and Canada rank seventh, twenty-first and twenty-third, respectively. Except for Brazil and Costa Rica, all other countries in the Americas rank beyond the fiftieth position in the economic complexity ranking.
Complementarity in bilateral
trade
The trade complementarity index (TCI) indicates the extent to which a country’s export profile matches or complements the import profile a trade partner. A high index value indicates that both countries have great potential to profit from
bilateral trade; on the other hand, the evolution of the index over time allows for assessing whether the compatibility of trade profiles has increased or decreased over time.
According to data for the year 2017, Paraguay, the United States, Belize, Uruguay and Brazil (in that order) are the countries that exhibit the greatest potential to increase bilateral trade with Latin
America. With respect to the evolution of the TCI over the past decade, Brazil and Argentina are particularly noteworthy in
that they exhibit a marked downward trend in the potential for bilateral trade with Latin America; the United States stands out for its rising trend, and Uruguay, on the other hand, for its high volatility (refer to Graph 7 in the Annex).
Final considerations and
policy recommendations
The new knowledge revolution that is taking place in global agriculture, as a result of the evolution and convergence of physics, biology and the digital world, as well as China’s growing presence in agrifood markets, pose the need to consider intelligent ways of becoming incorporated into international trade and global value chains. It is necessary to develop policies and medium and long-term strategies aimed at boosting the agrifood sector’s participation in international markets by means of a sustained growth in exports, which would help to alleviate the external restriction facing several countries in the region. Historical experience shows that Latin America’s participation in international trade has remained relatively stable over the past 20 years and that the region’s specialization in production has been less knowledge and technology-intensive than that of other more dynamic regions at the global level.In view of the foregoing, the region requires medium and long-term policies that take the following into account:
a. Growing demands from the
health, quality, safety and traceability, as well as the need to promote new business models for agroindustrial production in countries throughout the region.
b. The high level of potential that exists to foster agrifood trade between Latin American countries, by expanding regional agreements and other regional cooperation mechanisms.
c. The need for a large investment in the region in order to boost the production of agrifood goods and services that are knowledge and technology-intensive,
that foster the development of related activities and industries, and that drive the spillovers generated by the new technological revolution in the agriculture sector.
d. The budding development of the bioeconomy and the bioindustry in the Americas, which can serve as a means for transforming the structure of the region’s production matrix.
e. The obvious heterogeneity that exists within and among countries, in terms of their ability to compete in international markets.
Annex: Graphs
Graph 1. Agrifood trade in the Americas from 2008-2017
(in millions of current USD).
Source: Prepared by the author, based on data from UN Comtrade.
Graph 2. Importance of agrifood exports in the region in 2017 (%).
Source: Prepared by the author, based on data from UN Comtrade.
Graph 4. HHI Agrifood products
Graph 3. HHI Country of destination.
Graph 5. Changes in HHI levels during the 2017-2008 period.
Source: Prepared by the author, based on data from UN Comtrade.
Note: The countries in the top right-hand quadrant (Bolivia, Brazil, etc.) are those whose exports became more
concentrated, both in terms of the composition of the export basket, as well as the countries of destination. The opposite is the case for countries in the lower left-hand quadrant, whose exports became more diversified (in terms of both criteria); Jamaica and El Salvador stand out in this regard.
Graph 6. RCA Index in 2017.
Graph 7. Evolution of the TCI for selected countries.
Source: Prepared by the author, based on data from UN Comtrade.
Source: Prepared by the author, based on data from UN Comtrade. Note: Moving average over the past three years.