1
UNIVERSITÉ DE SHERBROOKE
Faculté de génie
Département de génie civil
Axial-flexural Performance of HSC Columns Reinforced
with GFRP and BFRP Bars and Ties
Étude du comportement de colonnes en béton à haute résistance
armé d’armature longitudinale et latérale en matériaux
composites de PRFV et PRFB soumises à des charges axiales et de
flexion
Thèse de doctorat
Spécialité : génie civil
Ashraf Salah-Eldin Mohamed
Sherbrooke (Québec) Canada
June 2019
xv
3
MEMBRES DU JURY
Prof. Brahim BENMOKRANE Directeur
Prof. Omar CHAALLAL Évaluateur
Prof. P. VIJAY Évaluateur
Prof. Charles-Philippe LAMARCHE Rapporteur
i
ABSTRACT
Fiber-reinforced-polymer (FRP) bars are considered as alternative to steel bars to avoid corrosion problems and ensure that structures lave long service lives. Using high-strength concrete (HSC) with glass-fiber-reinforced polymer (GFRP) and basalt-fiber-reinforced polymer (BFRP) as internal reinforcement can allow designers to reduce member size and increase the structure’s life span. Given HSC’s brittle nature, its use-especially in columns-should be investigated to prevent undesirable brittle failure. This research takes charge of providing experimental database as well as comparing the results with normal strength concrete (NSC) columns with similar dimensions tested in the literature. The main objective of this research is to investigate the structural performance of HSC columns reinforced with FRP under eccentric loading. Full-scale columns were tested under monotonic loading with different levels of eccentricity. Test variables included eccentricity to depth ratio; reinforcement type (GFRP and Basalt FRP vs. steel); concrete strength (HSC vs NSC) and longitudinal reinforcement ratio. All specimens measured 400 × 400 mm square cross section and 2000 mm height.
The experimental results are reported in terms of axial load-deflection behavior, mode of failure, maximum tensile and compressive strains developed in rebars and moment-curvature. The test results showed that HSC can be effectively integrated with both GFRP and BFRP reinforcement with HSC and the specimens reached their peak strength with no damage to GFRP or BFRP rebar on either side of the tested specimens. Using HSC allowed the columns to reach higher peak load and develop higher tensile strain in the rebars compared to columns made with NSC. Columns reinforced with GFRP or BFRP behaved in a similar manner at all the tested levels of eccentricity. The failure of FRPRC columns were classified into three different zones depending on the curvature achieved at the peak load. Moreover, an analytical model has been developed by using a layer-by-layer approach to predict the axial-flexural interaction diagram and the moment-curvature relationship for square FRP-RC columns using different concrete strengths. The model predictions were in a good agreement with the experimental results.
Keywords: concrete, FRP bars; square; HSC; columns; axial-flexural strength; Moment-curvature; Basalt.
xv
iii
RÉSUMÉ
Les barres d’armature en polymère renforcé de fibres (PRF) sont considérées comme une alternative aux barres d’armature en acier face aux problèmes de corrosion, afin de garantir aux structures une longue durée de vie utile. L’utilisation de béton à haute résistance (BHR) avec des barres d’armature en polymère renforcé de fibres de verre (PRFV) et en polymère renforcé de fibres de basalte (PRFB) comme armatures internes peut permettre aux concepteurs de réduire la taille des éléments et d’augmenter la durée de vie des structures. Étant donné la fragilité du BHR, son utilisation en particulier dans les poteaux doit être étudiée afin d’éviter une rupture fragile indésirable. Ce projet de recherche a pour objectif de fournir une base de données expérimentales et de comparer les résultats expérimentaux aux résultats de poteaux en béton de résistance normale (BRN), de dimensions similaires rapportés dans la littérature. L’objectif principal de ce projet de recherche est d’étudier les performances structurales de poteaux en BHR armé d’armatures en PRF et soumis à un chargement excentrique. Des poteaux pleine grandeur ont été testés sous chargement monotone avec différentes excentricités. Les paramètres d’essais comprenaient le rapport excentricité/côté, le type d’armature (PRFV, PRFB, acier), la résistance en compression du béton (BHR, BRN) et le taux d’armature longitudinal. Tous les spécimens avaient une section transversale carrée de 400 x 400 mm une hauteur de 2000 mm.
Les résultats expérimentaux sont présentés selon le comportement charge axiale – flèche, les modes de rupture, les déformations maximales en traction et en compression développées dans les barres d’armature et la réponse moment-courbure. Les résultats des essais ont montré que le BHR peut être utilisé efficacement avec les armatures en PRFV et en PRFB et que les spécimens ont atteint leur résistance maximale sans endommagement des armatures en PRFV ou en PRFB des deux côtés des spécimens testés. L’utilisation du BHR a permis aux poteaux d’atteindre une charge maximale plus élevée et de développer une déformation en traction plus élevée dans les barres d’armature par rapport aux poteaux fabriqués avec du BRN. Les poteaux avec armatures en PRFV et en PRFB ont eu des comportements similaires pour les mêmes niveaux d’excentricités. La rupture des poteaux en béton armé de PRF a été classée en trois zones différentes en fonction de la courbure correspondante à la charge maximale. De plus, un modèle analytique a été développé en utilisant une approche couche par couche pour prédire le diagramme d’interaction et la réponse
iv
PRF. Les prévisions du modèle concordent bien avec les résultats expérimentaux.
Mots clés : béton, barres d’armature de PRF ; section carrée ; BHR ; poteaux ; résistance à la flexion axiale ; moment-courbure ; basalte.
i
ACKNOWLEDGEMENTS
All praise and gratitude be to ALLAH the Most Gracious, the Most Merciful. With utmost gratitude, I wish to express my deep gratitude to everyone who made this research possible. The author is indebted to prof. Brahim BENMOKRANE for his supervision, guidance and constructive criticism throughout all stages of the research program. His encouragement and willingness to help in every possible way is greatly appreciated.
I am also very grateful to Dr. Hamdy Mohamed for the encouragement to pursue this topic, his valuable assistance with planning, experimental work, testing and analysis, and for the countless hours of discussions on the subject and guiding me through this process and his continuous support for me and his patience.
Moreover, I would like to express the special thanks and gratitude to the Natural Science and Engineering Research Council of Canada (NSERC), the NSERC Industrial Research Chair in FRP Reinforcement for Concrete Infrastructure, the Tier-1 Canada Research Chair in Composite Materials for Civil Structures, and the Fonds de la recherche du Quebec–Nature et Technologie – (FRQ-NT) for funding this research. Also, I would like to thank TUF-BAR Canada for providing the GFRP reinforcement and the technical staff of the Structural and Materials Lab in the Department of Civil Engineering at the University of Sherbrooke.
ii
TABLE OF CONTENTS
ABSTRACT ... I RÉSUMÉ ... III ACKNOWLEDGEMENTS ... I TABLE OF CONTENTS ... II LIST OF TABLES ... VII LIST OF FIGURES ... VIIICHAPTER 1 INTRODUCTION ... 1
1.1. GENERAL BACKGROUND ... 1
1.2. OBJECTIVES AND SCOPE ... 2
1.3. METHODOLOGY... 3
1.4. THESIS ORGANIZATION ... 4
CHAPTER 2 LITERATURE REVIEW ... 5
2.1. GENERAL... 5
2.2. BACKGROUND ... 5
2.2.1. History of FRPs ... 5
2.2.2. Behaviour of FRP bars: ... 6
2.2.3. The physical and mechanical properties ... 7
2.3. BEHAVIOR OF HSC ... 9
2.3.1. Stress strain behavior in compression ... 10
2.3.2. Elastic modulus ... 12
2.3.3. Poisson’s ratio ... 12
2.4. GFRP REINFORCED COLUMNS ... 13
CHAPTER 3 EXPERIMENTAL WORK ... 24
3.1. INTRODUCTION ... 24
3.1.1. General ... 24
3.2. OBJECTIVES ... 25
iii
3.1.1 Proposed test parameters ... 25
3.1.2 Material properties... 26 3.4. SPECIMEN DESIGN ... 29 3.5. SPECIMENS PRODUCTION ... 29 3.5.1. Cage Assembling... 29 3.5.2. Instrumentation ... 31 3.5.3. Formwork construction ... 32 3.5.4. Concrete casting ... 32 3.5.5. Test setup ... 33
CHAPTER 4 FULL-SCALE HIGH STRENGTH CONCRETE COLUMNS REINFORCED WITH GFRP BARS AND TIES SUBJECTED TO ECCENTRIC LOADS 35 4.1. INTRODUCTION: ... 36 4.2. OBJECTIVES:... 39 4.3. MATERIALS ... 39 4.3.1. GFRP reinforcement ... 39 4.3.2. Steel reinforcement ... 40 4.3.3. Concrete properties ... 40
4.4. STRESS-STRAIN RELATIONSHIP FOR HSC: ... 42
4.5. CONSTRUCTION METHOD: ... 42
4.6. SPECIMEN DESIGN: ... 43
4.7. TEST SETUP AND INSTRUMENTATION ... 44
4.8. TEST RESULTS AND OBSERVATIONS:... 45
4.8.1. Cracking pattern: ... 45
4.8.2. Axial and lateral deformation: ... 50
4.8.3. Concrete strain: ... 52
4.8.4. Longitudinal GFRP-bar strain profiles: ... 53
4.9. DISCUSSION ... 56
4.9.1. Influence of test parameters ... 56
4.9.2. Efficiency of using high strength concrete: ... 56
4.9.3. Eccentricity to depth ratio ... 57
4.9.4. Reinforcement type: ... 58
4.10. EXPERIMENTAL P-M INTERACTION DIAGRAMS: ... 59
4.11. THEORETICAL PREDICTION: ... 60
4.11.1. Development of theoretical interaction diagrams: ... 63
iv
4.13.1. Effect of increasing the longitudinal reinforcement ratio: ... 65
4.13.2. Effect of the concrete strength: ... 65
4.13.3. Effect of ignoring the contribution of bars in compression: ... 66
4.14. CONCLUSIONS: ... 68
CHAPTER 5 AXIAL–FLEXURAL PERFORMANCE OF HSC BRIDGE COMPRESSION MEMBERS REINFORCED WITH BFRP BARS AND TIES: EXPERIMENTAL AND THEORETICAL INVESTIGATION ... 71
5.1. ABSTRACT ... 71
5.2. INTRODUCTION ... 72
5.3. ADVANCESINRESEARCHONBFRP-REINFORCEDCONCRETEMEMBERS ... 74
5.4. AIMSANDOBJECTIVESOFTHESTUDY ... 75
5.5. EXPERIMENTALWORK ... 76
5.5.1. Material Properties ... 76
5.5.2. Concrete ... 78
5.5.3. Test Specimens ... 79
5.5.4. Instrumentation and Test Setup ... 80
5.6. TESTRESULTSANDOBSERVATIONS ... 82
5.6.1. Low Eccentricity (e = 80 mm) ... 83
5.6.2. High Eccentricity (e = 240mm). ... 87
5.7. DISCUSSION... 91
5.7.1. Effect of Test Parameters ... 91
5.7.2. Initial Eccentricity and Induced Moment ... 92
5.7.3. Efficiency of Using HSC ... 93
5.7.4. Reinforcement Type ... 94
5.8. THEORETICALANALYSIS ... 96
5.8.1. Experimental and Theoretical Development of the P–M Interaction Diagrams ... 96
5.8.2. Theoretical Prediction of P-M Interaction Diagrams ... 97
5.8.3. Comparing the Experimental and Theoretical Results ... 100
5.8.4. Parametric Investigation ... 101
5.9. MOMENT–CURVATUREBEHAVIOR ... 104
5.10. DUCTILITY ... 105
5.11. EFFECTIVE FLEXURAL STIFFNESS (EISEC) ... 106
5.12. COMPARATIVE STUDY ON DIFFERENT ESTIMATIONS OF SECTION FLEXURAL STIFFNESS ... 107
5.13. HYBRID COLUMNS ... 109
v
CHAPTER 6 EFFECT OF GFRP-REINFORCEMENT RATIO ON THE STRENGTH
AND EFFECTIVE STIFFNESS OF HIGH-STRENGTH CONCRETE COLUMNS:
EXPERIMENTAL AND ANALYTICAL STUDY ... 113
6.1. ABSTRACT ... 113
6.2. INTRODUCTION ... 114
6.3. RESEARCHSIGNIFICANCE ... 116
6.4. EXPERIMENTALINVESTIGATION ... 117
6.4.1. Materials ... 117
6.4.2. Specimen Design and Fabrication ... 118
6.4.3. Instrumentation ... 120
6.5. OBSERVEDBEHAVIORANDTESTSRESULTS ... 122
6.5.1. Cracking and Failure Modes ... 122
6.5.2. Concrete and GFRP-Bar Strain Behavior ... 125
6.6. DISCUSSION... 128
6.6.1. Effect of Reinforcement Ratio ... 128
6.6.2. Effect of Compression Reinforcement ... 130
6.6.3. Effect of Using HSC ... 130
6.7. MOMENT–CURVATURERELATIONSHIP ... 132
6.8. DUCTILITY ... 134
6.9. ANALYTICAL APPROACH ... 135
6.9.1. Modeling of the Materials ... 135
6.10. DEVELOPMENTOFTHEM–Ψ RELATIONSHIP ... 136
6.10.1. Procedure to Determine Moment and Curvature ... 137
6.11. COMPARISONBETWEENTHEANALYTICALMODELANDTHEEXPERIMENTALRESULTS 139 6.11.1. Effect of Reinforcement Ratio and Concrete Strength on the Column Effective Stiffness ... 139
6.11.2. Comparative Study on Ie/Ig... 140
6.12. CONCLUSION ... 143
CHAPTER 7 SUMMARY, CONCLUSIONS AND RECOMMENDATIONS ... 145
7.1. SUMMARY ... 145
7.2. CONCLUSIONS ... 145
7.2.1. Strength, General Behavior and Failure Mode ... 146
7.2.2. Flexural Stiffness ... 148
7.2.3. Analytical Modelling ... 148
7.2.4. Parametric Investigations ... 149
7.3. RECOMMENDATIONS FOR FUTURE WORK ... 149
vi
7.4.1. Résistance, comportement général et modes de rupture ... 150
7.4.2. Rigidité en flexion ... 153
7.4.3. Modélisation analytique... 154
7.4.4. Études paramétriques ... 154
7.5. RECOMMANDATIONS POUR LES TRAVAUX FUTURS ... 154
vii
LIST OF TABLES
Table 2-1: Advantages and Disadvantages of FRP (ACI 440.1R-15) ... 6
Table 2-2: The average physical properties for the reinforcing bars* ... 7
Table 2-3: The average tensile properties for the reinforcing bars (ACI 440.1R-15) ... 8
Table 2-4: Poisson’s ratio of HSC reported by different studies ... 13
Table 3-1 Mechanical properties of FRP bars* ... 27
Table 3-2: Mechanical properties of Steel bars* ... 28
Table 3-3: Test Matrix ... 30
Table 4-1 – Mechanical properties of GFRP and Steel reinforcement ... 40
Table 4-2– Concrete mix properties ... 41
Table 4-3 – Test matrix ... 43
Table 4-4– Test matrix and summary of results ... 46
Table 5-1 – Mechanical properties of the BFRP and steel reinforcement ... 78
Table 5-2 – Concrete mix properties ... 78
Table 5-3 – Specimen details. ... 80
Table 5-4 – Test matrix and summary of test results ... 83
Table 6-1– Mechanical properties of the GFRP reinforcement ... 117
Table 6-2– Test matrix ... 121
viii
LIST OF FIGURES
Figure 1-1 – Flow chart of the research program ... 3
Figure 2-1– Comparison of stress-strain relationships for GFRP in tension or Compression, reinforcing steel, and plain concrete.(Tikka et al. 2013) ... 9
Figure 2-2– Stress strain curve for different concrete strength. (Wight and MacGregor (2009), reproduced from Whittaker (2012) ... 10
Figure 2-3– Specimen detail, [XUE et al., 2014] ... 19
Figure 3-1–GFRP and BFRP cages ... 27
Figure 3-2– Steel cages ... 28
Figure 3-3 – Instrumentation ... 31
Figure 3-4 – Form work used ... 32
Figure 3-5 – Concrete casting ... 33
Figure 3-6 – Test setup: a) elevation of test setup, b) 3d drawing of test setup, c) lower end cap and applied eccentricity and d) data acquisition system. ... 34
Figure 4-1 (a) Reinforcement details for column GFRP and steel reinforced columns. (b) overview of GFRP bars and ties. ... 41
Figure 4-2 – Test setup elevation and side view. ... 45
Figure 4-3 – Failure mode for group GFRP and steel reinforced columns series on tension side. 49 Figure 4-4 – Failure mode for group GFRP and steel reinforced columns series on compression side. ... 49
Figure 4-5 – Side view for the failure mode for group GFRP and steel reinforced columns series. ... 50
Figure 4-6 – Load versus axial displacement for GFRP and steel reinforced columns. ... 51
Figure 4-7 – Load versus lateral mid-height displacement. ... 52
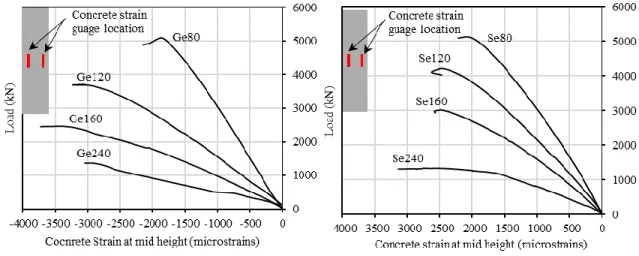
Figure 4-8 – Load versus concrete strain on the compression side. ... 53
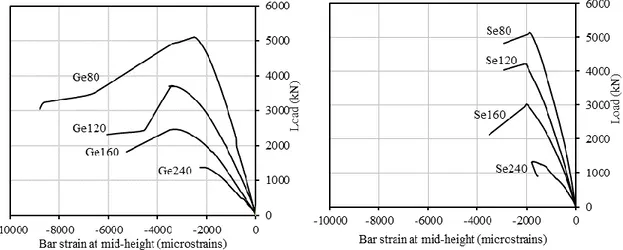
Figure 4-9 – Load versus outermost compressive bar strain at mid-height for GFRP and steel bars. ... 54
ix
Figure 4-10 – Load versus outermost tensile bar strain at mid-height for GFRP and steel columns.
... 54
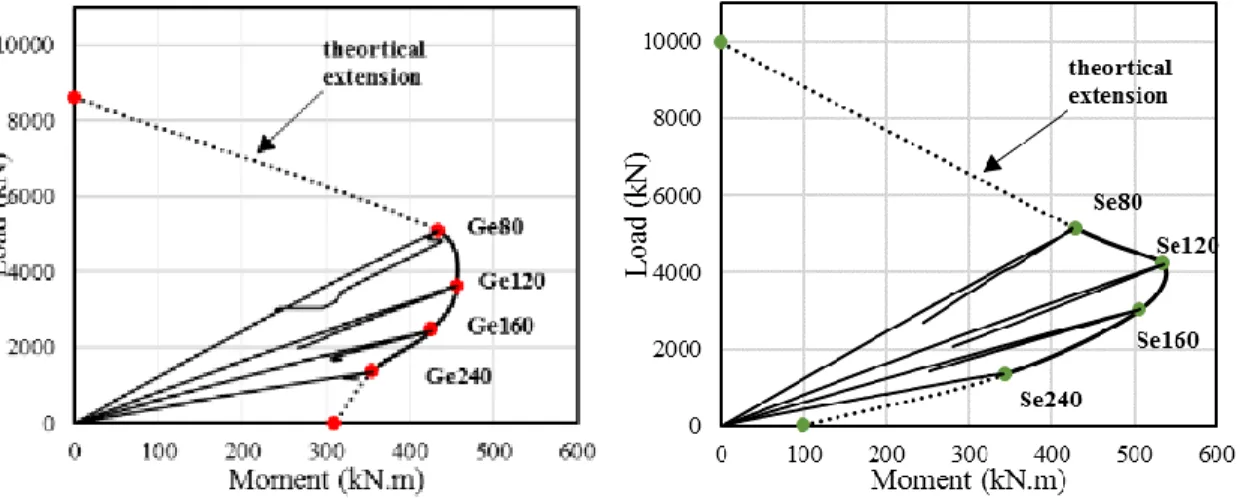
Figure 4-11 – Experimental results for GFRP and steel reinforced columns series. ... 60
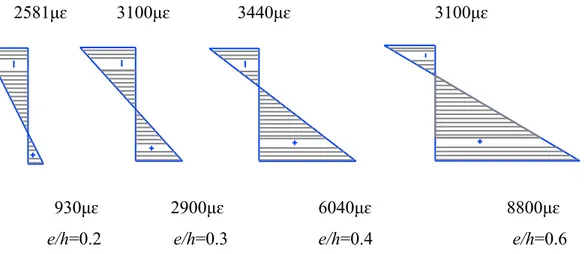
Figure 4-12 – Strain profile at peak load for G series under different eccentricities. ... 61
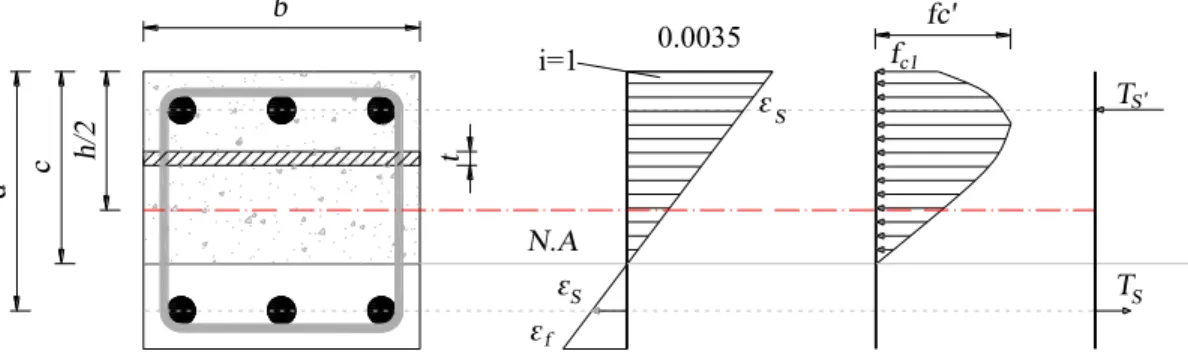
Figure 4-13 – Stress and strain assumption for strip method analysis. ... 63
Figure 4-14 – Axial-Moment interaction diagram for experimental vs predicted results. ... 64
Figure 4-15 – Theoretical interaction diagram for square section (400×400) (a) considering te contribution of GFRP bars in compression (b) ignoring the contribution of GFRP bars in compression. ... 67
Figure 5-1 – Compression test for BFRP bars (a) test setup, (b) typical crushing failure, (c) stress–strain relationship for all the BFRP bars tested under compression, (d) average stress– strain used for tension and compression. ... 77
Figure 5-2 – (a) Configuration of BFRP- and steel-reinforced columns and reinforcement details and (b) overview of BFRP bars and ties. ... 82
Figure 5-3 – Overview of the test setup. ... 82
Figure 5-4 – Overview of cracking pattern for three sides of the tested columns. ... 85
Figure 5-5 – Load versus concrete strain on the compression side. ... 86
Figure 5-6 – Load versus axial displacement for the BFRP- and steel- reinforced columns. ... 86
Figure 5-7 – Load versus lateral displacement at mid-height. ... 87
Figure 5-8 – Load versus outermost bar strain at mid-height. ... 88
Figure 5-9 – Load versus outermost bar strain at quarter-height. ... 89
Figure 5-10 – Ties strains for columns tested with e = 80 mm. ... 90
Figure 5-11 – Ties strains for columns tested with e = 120 mm. ... 90
Figure 5-12 – Ties strains for columns tested with e = 160 mm. ... 91
Figure 5-13 – Ties strains for columns tested with e = 240 mm. ... 91
Figure 5-14 – Experimental results for (a) BFRP- and (b) steel-reinforced concrete columns. .... 95
Figure 5-15 – Strain profile for the BFRP-reinforced columns at peak load for the tested eccentricities. ... 97
Figure 5-16 – Stress and strain assumption for strip-by-strip method of analysis. ... 98
x
the contribution of the BFRP bars in compression and (b) considering the contribution of the
BFRP bars in compression. ... 102
Figure 5-19 – Moment curvature for all BFRP-reinforced concrete columns at four different eccentricities. ... 105
Figure 5-20 – Influence of P/P0 and e/h on the section stiffness (EIsec/EIg) for the tested BFRP-reinforced concrete columns. ... 106
Figure 5-21 – Comparing relative flexural stiffness of BFRP-reinforced concrete members using theoretical equations and experimental data (a) at the ultimate- and (b) service-load levels. ... 109
Figure 6-1 – Overview of the (a) GFRP cages and (b) GFRP bars, ties, and crossties used. ... 118
Figure 6-2– Dimension and details of four groups (G1, G2, G3, and G4T) ... 119
Figure 6-3 – Test setup. ... 122
Figure 6-4 – Failure mode for all the tested specimens for compression side, side view, and tension side, respectively. ... 124
Figure 6-5 – Axial load–axial displacement at mid-height. ... 126
Figure 6-6 – Axial load–lateral displacement at mid-height. ... 126
Figure 6-7 – Axial load–reinforcement strain @ mid-height for series (a) G1, (b) G2, and (c) G3, and G4T. ... 126
Figure 6-8 – Strain profile for all the tested columns at peak load. ... 128
Figure 6-9 – Strength of the tested columns for series G1, G2, and G3 (a) Axial–flexural strength of columns; (b) axial load versus eccentricity-to-depth ratio. ... 129
Figure 6-10 – Comparison of the experimental and analytical M-ψ for series G1 and G2. ... 133
Figure 6-11 – Influence of changing the applied eccentricity and P/Po on EI/EIg for series G1 and G2. ... 134
Figure 6-12 – Stress and strain profiles of FRP-RC square cross section... 137
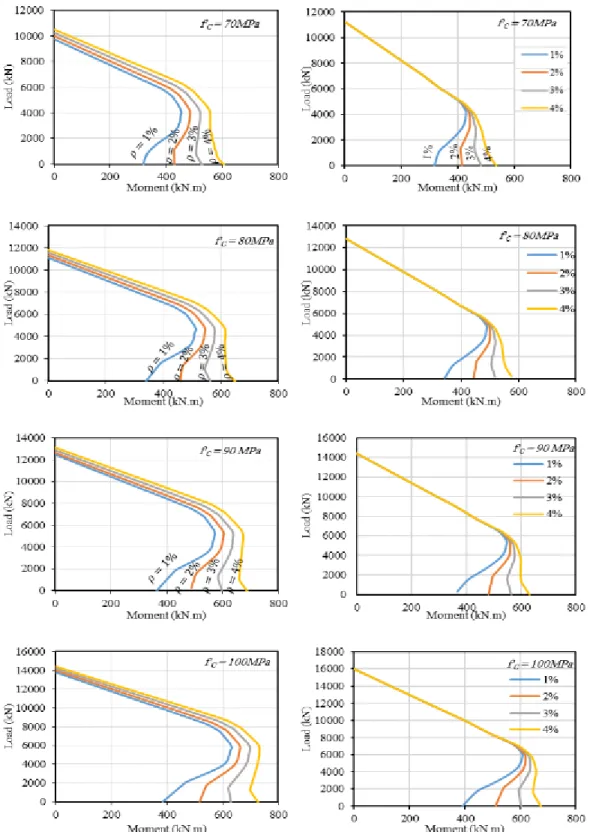
Figure 6-13 – Analytical study showing the effect of changing (a) reinforcement ratio ρ, and (b) concrete strength (fc') on the relative flexural stiffness of FRPRC members as a function of eccentricity-to-depth ratio. ... 140
Figure 6-14 – Influence of changing the applied eccentricity and P/Po on EI/EIg for series G1 and G2. ... 143
1
CHAPTER 1
INTRODUCTION
1.1. General background
Concrete strength used in practice has been increasing gradually over the years. Recently, high strength concrete (HSC) were used in many application including precast elements, and different structural members such as beams and columns. HSC offers economy and superior performance when used in columns, piers and piles. Increased strength results in smaller member sizes while acquiring higher young’s modulus. Additional benefits can also be realized through improved performance relative to durability and corrosion resistance.
Aggressive climate and environmental changes stimulate the manufacturing and industrial improvement of existing technology. Fiber-reinforced polymer (FRP) reinforcement have been introduced as a replacement to steel reinforcement to avoid corrosion. Past years have seen valuable research work and widespread applications of different concrete elements to increase the trust and further improve the FRP reinforcement. Integrating FRP reinforcement with HSC would result in more cost effective and durable structural elements. However, using FRP bars as reinforcement for HSC, especially in columns, is still a relevant issue to be addressed and not covered by design codes such as ACI 440.1R-15 and CSA S806. Moreover, the contribution of compressive FRP reinforcement in columns is questioned and under study. Only limited studies investigated the behavior of HSC columns reinforced with FRP under eccentric and concentric columns in which their findings demonstrated the feasibility of using FRP reinforcement in columns.
This research intended to originally examine the performance of FRP reinforcement with HSC columns/piles under eccentric compression to set the limits and the boundaries of using FRP bars under high compression forces developed by using HSC.
2
This study investigates the behavior of high strength concrete columns reinforced with fiber reinforced polymer bars as a primary reinforcement under eccentric loading and to better determine its viability as a potential construction alternative. High strength concrete will be used to gain a better understanding of the performance of GFRP and BFRP reinforced full-scale concrete columns. The performance of FRP rebar and ties were compared to steel reinforcement. The behaviour of these columns were quantified by plotting interactions diagrams for axial-moment and axial deflection response analysis. The research also discussed the issue of considering the contribution of FRP rebar in the light of the data provided by the ACI 440.1R (2015), in which recommendations were drawn. The behavior of HSC columns was evaluated by comparing their behavior with similar columns with the same dimensions made with NSC. Moreover, the failure mechanism of these columns were also be identified and quantified. The behavior was also assessed by comparing the moment curvature behavior and flexural stiffness during loading. Ultimately, design recommendations will be developed to the use of FRP bars with high strength concrete.
The general objective of this study is:
Addressing the feasibility and applicability of FRP bars in eccentric columns and evaluating their behavior by comparing with steel reinforced column and columns made with NSC.
The following points summarized the specific objectives:
1. Investigating the behavior and failure mode mechanisms of GFRP-RC and BFRP-RC columns subjected to combined flexural moment and compression load.
2. Developing interaction diagrams for GFRP and BFRP-RCC members experimentally. 3. Correlating strength predictions with the experimental results yielded by adopting layer by
layer method.
4. Determining the effective stiffness of the tested specimens and compared with the available expressions.
3
1.3. Methodology
To achieve the above-described objectives, a research plan including experimental program and theoretical studies was conducted. The experimental program included testing of full-scale circular members reinforced with glass and carbon FRP as well as steel reinforcement. The results were discussed in terms of general behavior, effect of test parameters, and interaction diagrams. On the other side, theoretical studies were prepared to analytically develop the interaction diagrams of the tested specimens along with parametrical investigation. The stress block parameters of HSC members were also investigated. Moment - curvature relationships were developed using through an analytical model to predict and propose expressions for the effective stiffness. The following flow chart, Fig 1.1, summarized the methodology prepared for this work.
Figure 1-1 – Flow chart of the research program
Experimental Program Theoretical Studies
HSC square short columns
GFRP BFRP Steel HSC vs NSC e/h Reinf. ratio General Behavior P-Δ Failure P-ɛbar
Effect of Test Parameters Interaction Diagrams
Parametric study
Developing Layer by layer model
4
The thesis first begins commonly with a short review in Chapter 2 of presenting pertinent studies to this work in a chronological order.
Chapter 3 (1st article) presents the results of an experimental investigation on the eccentric behavior of square GFRP-RC HSC column. The axial force–moment interaction diagrams were predicted using layer by layer method and internal force equilibrium and following the recommendations of the available design standards/guidelines and recent research work on GFRP-RC columns.
Chapter 4 (2nd article) presents test results of an experimental program to investigate the structural performance of square HSC-RC columns reinforced with basalt-FRP (BFRP) bars and ties. Based on the test results, a detailed sectional analysis and plane section analysis were then conducted. Furthermore, a comprehensive parametric investigation was performed to generate numerous nominal axial force-bending moment interaction diagrams and investigate the effective stiffness response of the tested columns.
Chapter 5 (3rd article) presented a state-of-art review on the compressive-strength contribution of GFRP reinforcement. The lowest and highest bounds of the mechanical properties of GFRP reinforcement reported in the ACI 440.1R (2015) were included in analytical study employing different concrete strengths and reinforcement ratios to develop sets of axial force–bending moment interaction diagrams and indicative guide charts. In addition, the minimum GFRP longitudinal reinforcement ratio to prevent tension failure (GFRP-bar rupture) was investigated. Chapter 6 presents summary, conclusions, and the recommendations for future study.
5
CHAPTER 2
LITERATURE REVIEW
2.1. General
This chapter provides a brief summary of the main characteristics and properties of the Fiber reinforced polymer (FRP) materials used as internal reinforcement. This is followed by a demonstration of the main studies that investigated the axial and axial-flexural behavior of concrete columns reinforced with FRP bars. The code provision that related to flexural behavior and serviceability of FRP reinforced concrete members are also presented.
2.2. BACKGROUND
2.2.1. History of FRPs
FRP composites are results of the idea of making better composite materials by combining different materials (Nanni, 1999), that can be traced back to the utilizing of straw in bricks as reinforcement. In early 1950’s composite materials were used in automotive and aerospace industry as a light weight material with acceptable stiffness and strength. In 1960’s these materials were considered for use as reinforcement of concrete in high way bridges as a replacement to conventional steel reinforcements which experience extensive corrosion as a result of applying deicing salt or being exposed to marine environment (almost 10% of the high way bridges in US are structurally deficient or functionally no longer in use, ASCE report card 2005). The FRP reinforcing bar was introduced on the market in the late 1970’s as a viable alternative to steel as reinforcement for concrete due to the incompatibility of thermal expansion characteristics between polymer concrete and steel.
6
2.2.2. Behaviour of FRP bars:
The mechanical properties of FRP bas are quite different from those of steel bars and depend mainly on both matrix (resin) and fibers type as well as volume fraction. The fibers include aramid, polyvinyl, carbon and improved glass fibers. Table 2.1 lists some of the advantages and difference between FRP reinforcement compared to conventional steel reinforcement, as reported by ACI 4401R-15.
Table 2-1: Advantages and Disadvantages of FRP (ACI 440.1R-15)
Advantages of FRP reinforcement Differences between steel and FRP High longitudinal tensile strength (varies
with sign and direction of loading relative to fibers)
FRP is linear elastic to failure whereas steel yields
Corrosion resistance (not dependent on a coating)
Low transverse strength (varies with sign and direction of loading relative to fibers) Non magnetic Low modulus of elasticity (varies with type of reinforcing fiber), that’s why design for
serviceability often controls High fatigue endurance (varies with type of
reinforcing fiber)
Susceptibility of damage to polymeric resins and fibers under ultraviolet radiation exposure
Lightweight (about 1/5 to 1/4 the density of steel)
Low durability of glass fibers in a moist environment
Low thermal and electric conductivity (for glass and aramid fibers)
Low durability of some glass and aramid fibers in an alkaline environment
High coefficient of thermal expansion perpendicular to the fibers, relative to concrete
Endurance time in fire is less than the steel depending on matrix type and concrete cover thickness
7
2.2.3. The physical and mechanical properties
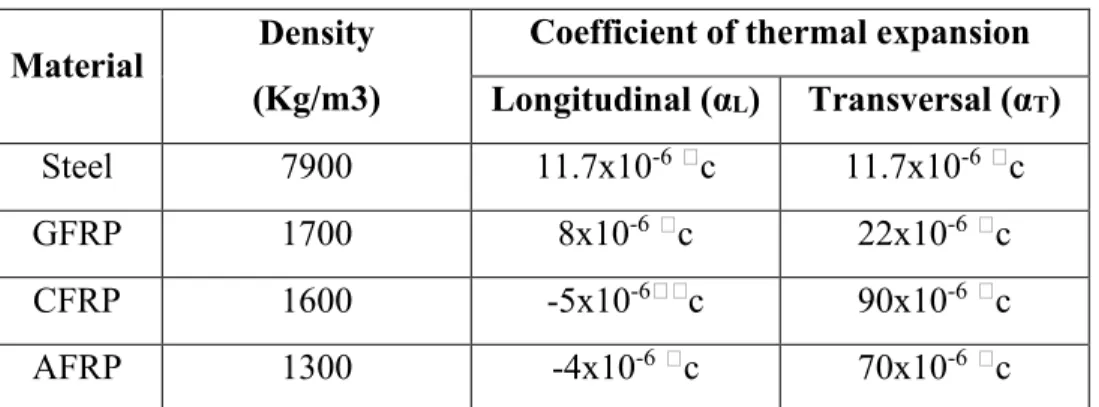
The density and coefficient of thermal expansion have a significant effect on the material use. The density of the material directly affects the cost and ease of transportation and also the workability. FRP bars have density ranging from one fifth to one forth than that of steel; this makes the FRP easier in handling and weight much less than steel bars (ACI committee 440, 2001).
The longitudinal coefficient of thermal expansion is dominated by fiber properties while the transverse coefficient is dominated by resin. Typical values for the coefficient of thermal expansion in longitudinal and the transverse directions are reported in Table 2.2. The higher value for the transversal coefficients of thermal expansions combined with the Poisson’s effect in the case of compressed reinforcement can be responsible for circumferential tensile strength that causes the formation of cracks in the radial direction that may weakens the concrete-FRP bond.
Table 2-2: The average physical properties for the reinforcing bars* Material Density
(Kg/m3)
Coefficient of thermal expansion Longitudinal (αL) Transversal (αT)
Steel 7900 11.7x10⁻⁶ c 11.7x10⁻⁶ c
GFRP 1700 8x10⁻⁶ c 22x10-6 c
CFRP 1600 -5x10⁻⁶ c 90x10-6 c
AFRP 1300 -4x10⁻⁶ c 70x10-6 c
*The negative sign in the coefficient of thermal expansion means a contraction action. The tensile, compressive, shear and bond strengths have a great importance on the structural behavior. It should also be noted that the manufacturing quality control affects the mechanical characteristics of the bar [Wu 1990]. The tensile properties of FRP are what make them a good alternative to steel reinforcement. FRP bars don’t exhibit any plastic behavior (yielding) before rupture. Table 2.3 summarizes the average properties of the material.
8
FRPs bar have an anisotropic and brittle failure behavior which means that it has a linear stress-strain behavior under tension up to failure, however, they have lower modulus of elasticity compared to steel bars. Figure 2.1 shows stress-strain curves for different types of FRP bars.
It is not recommended to rely on FRP bars to resist compressive stresses (ACI-440-1R-06). Tests on FRP bars with a length-diameter ratio from 1:1 to 2:1 have shown that the compressive strength is lower than the tensile strength [Wu 1990]. Compressive strengths of 55, 78, and 20% of the tensile strength have been reported for GFRP, CFRP, and AFRP, respectively [Mallick 1988; Wu 1990]. Higher compressive strengths are expected for bars with higher tensile strength [ACI 1995]. According to reports, the compressive modulus of elasticity is approximately 80% for GFRP, 85% for CFRP, and 100% for AFRP of the tensile modulus of elasticity for the same product [Mallick 1988; Ehsani 1993]. Standard test methods are not yet established to characterize the compressive behavior of FRP bars but a testing method for FRP materials is given by [Benmokrane et al., 1998].
Table 2-3: The average tensile properties for the reinforcing bars (ACI 440.1R-15)
Properties Steel GFRP CFRP AFRP
Nominal yield stress, MPa 276 to 517 N/A N/A N/A
Tensile strength, MPa 483 to 1600 483 to 690 600 to 3960 1720 to 2540
Elastic modulus, GPa 200 35 to 51 120 to 580 41 to 125
Yield strain, percent 0.14 to 0.25 N/A N/A N/A
9
Figure 2-1– Comparison of stress-strain relationships for GFRP in tension or Compression, reinforcing steel, and plain concrete.(Tikka et al. 2013)
Most FRP bars composites are relatively weak in inter-laminar shear where layers of unreinforced resin lie between layers of fibers. The inter-laminar shear strength is governed by relatively weak polymer matrix as there is no reinforcement across layers. One of the ways to increase the shear strength is by providing braiding or winding fibers transverse to the main fibers, depending on the orientation of the fibers in an off-axis direction will increase the shear resistance.
2.3. Behavior of HSC
The use of high strength concrete (HSC) for bridges and high rise buildings have become very popular due to development in concrete technology and the availability of new mineral and chemical admixtures such as silica fume, fly ash and super plasticizers. HSC is often used to reduce the structural member size for compression members and therefore provide considerable savings. Furthermore, due to the superior durability if HSC, significant reduction of the maintenance requirements and an increase in the service life of the structure can be achieved.
The definition of HSC has varied over time. For instance, in the 1950’s concrete with a compressive strength of 5000psi (34 MPa) was considered high strength concrete. In the early 1970s, 9000 psi (62 MPa) concrete was being produced. More recently, compressive strength approaching 20,000 psi (138MPa) was available at only a few locations.
10
Mechanical properties of HSC can be divided into two groups as short term and long term mechanical properties. Short term mechanical properties include compressive strength, stress strain behavior, elastic modulus, poisson’s ratio, tensile strength and modulus of rupture. These properties are presented here from previous research work.
2.3.1. Stress strain behavior in compression
Stress-strain behavior of concrete for different range of compressive strength is shown in Figure 2.2. The slope of the ascending part of the tress-strain of HSC is steeper and linear than the NSC, strain at maximum strength is greater and the descending part is also steeper compared to NSC. Stress strain behavior of HSC depends in material properties such as water content and aggregate type, it also depends in experimental parameters that include strain rate, age at testing and interaction between testing machine and specimen. Carrasquillo et al. (1981) reported that there is less internal micro cracking in HSC than NSC for the same axial strain imposed. This also indicates that HSC experience less lateral strain, and consequently effectiveness of confinement on compressive strength of HSC is often limited compared to NSC.
Figure 2-2– Stress strain curve for different concrete strength. (Wight and MacGregor (2009), reproduced from Whittaker (2012)
11 Compressive strength
Decreasing w/c ratio increases the strength of concrete. However, this trend is only valid as long as the strength of hydrated cement is low compared to the strength of coarse aggregates. When these two strengths become comparable, decreasing the w/c doesn’t increase the strength of the concrete. In order to further increase the strength of HSC, strength and quality of HSC need to be increased. Typically, a water to cement ratio of 0.2-0.4 are used for HSC to hydrate all the cement particles in a concrete mixture. It was also experienced that adding mineral admixtures such as silica fume or fly ash increases the workability in HSC. Irvani (1996) noted that effect of silica fume on High strength development of HSC is most prominent during 7 to 28 days.
HSC has higher rate of strength gain at earlier stage compared to NSC as shown in (Carrasquillo et al.,1981). There is no significant increase in strength after 28 days, 10 to 15% increase in strength is gained at age of 56 days and 95 days compared to 28 days strength. Curing of HSC has a strong influence on the strength development because of its low w/c ratio. Testing age of HSC specimens depend in construction requirements; however, considering notable strength gain at later stages, testing age of 56 days or 90 days is often recommended (ACI, 2010).
It’s obvious that the HSC has lots of advantages over NSC. HSC usually include ingredients highly resistant to the chloride damage and other chemical attacks. Due to its low permeability, it’s highly durable, and consequently requires low maintenance cost. In addition to these advantages, HSC allows the designers to produce minimized structural sections to meet the serviceability limits. The largest application of HSC in buildings is columns of High rise structures. Different buildings and bridges have been constructed using HSC. For building examples, Taipei 101 in Taiwan 2004, Brillia tower in Tokyo 2004, 505 5th Avenue in New York 2004, and Bay Adelaide Center in Toronto 1991. While, for bridge examples, State route 920 over I-75 in Georgia 2002, Federation Bridge Prince Edward Island in Canada 1997, and Portneuf in Quebec 1992.
12
2.3.2. Elastic modulus
ACI-318 (ACI,2011) defines the secant modulus of elasticity as the ratio of stress and strain at 40% of the compressive strength. As strength of concrete increases, its modulus of elasticity increases as well. Hence the same parameters that affect the compressive strength of concrete also affect the elastic modulus. Consequently, most of the empirical formulations express modulus of elasticity as a function of compressive strength. The equation suggested in ACI 318 (Eqn. 2.1) overestimates elastic modulus of HSC and ACI 363 (ACI, 2010) suggests a different equation for HSC based on studies done by Carraquillo et al. (1981) that have been shown to produce conservative values for normal-density concrete (Shah and Ahmad, 1994):
𝐸𝑐 = 3320 √𝑓𝑐′+ 6900 (𝑀𝑃𝑎) (2.1)
2.3.3. Poisson’s ratio
The data available on Poisson’s ratio of HSC is very limited. Poisson’s ratio of HSC is constant in the linear zone but increases in the non-linear zone as a function of axial strain. In the linear zone range, poisson’s ratio is bit affected by compressive strength, curing method and age of concrete (Logan et al., 2009). Poisson’s ratio of HSC reported by different studies in the linear range at 40% of ultimate stress is summarized in Table 2.4.
Poisson’s ratio of HSC in the linear zone range carried around 0.2, which is around the same range of values obtained for NSC (0.15-0.25).
13
Table 2-4: Poisson’s ratio of HSC reported by different studies
study Strength range (MPa) Poisson’s ratio Standard deviation Perenchio and Klieger (1978), as
reported in Iravani (1996) N.A. 0.22 N.A.
Carrasquillo et al. (1981) 34-73 0.210 0.016
Ibrahim and MacGregor (1994) 73-99 0.18 N.A.
Iravani (1996) 64-125 0.17 0.023
Logan et al. (2009) 34-120 0.17 0.07
2.4. GFRP reinforced columns
(De Luca et al. 2010) conducted an experimental program to investigate whether the compressive behavior of longitudinal GFRP bars impacts the column performance, and to understand the contribution of GFRP ties to the confinement of the concrete core, and to prevent instability of the longitudinal reinforcement. Five specimens were tested under axial loading: one benchmark steel RC column and four GFRP RC columns.
Figure 2.3 shows the mode of failures for A-12 and B-12 with tie spacing of 12 inches. Failure typically initiated with vertical cracks, followed first by lateral deflection of the longitudinal bars contributing to the splitting of the concrete cover and then by crushing of the concrete core and buckling of the longitudinal bars.
Figure 2.4 compares the response of all specimens in terms of normalized axial stress and deformation. Each curve is the envelope of all the load-unload cycles imparted. The initial slope is identical for all the curves. The GFRP specimens exhibit a gradual decrease in stiffness as the load reaches approximately 60% of the peak capacity, whereas for the steel RC specimen (S-16), the stiffness starts decreasing as the load reaches approximately 80% of the peak capacity.
14
Figure 2.3– Close-up of buckled GFRP bars for specimen A-12 ( De Luca et al. 2010)
Figure 2.4– Normalized axial stress-axial deformation (De Luca et al. 2010)
Afifi (2013) Conducted experimental and analytical investigations on circular concrete columns reinforced with FRP bars and spirals under concentric axial loading. The program included 27 circular concrete columns having 300 mm diameters and 1500 mm height. The columns were reinforced using different materials (steel, GFRP, and CFRP). The experimental program included also studying different parameters such as longitudinal reinforcement ratio, ties volumetric ratios, confinement type (spirals vs hoops); and lap length of hoops. The testing results revealed that FRP bars were effective in resisting compression till reaching the peak load. The FRP bars contribution average 8% and 13% of
15
the column maximum capacity for GFRP and CFRP RC specimens, respectively. The authors reported that ignoring the contribution of FRP longitudinal bars in the CSA S806 (2012) design equation underestimated the maximum capacity of the tested specimens. They suggested a modification to the design equation to accurately predict the ultimate load capacities of FRP RC columns.
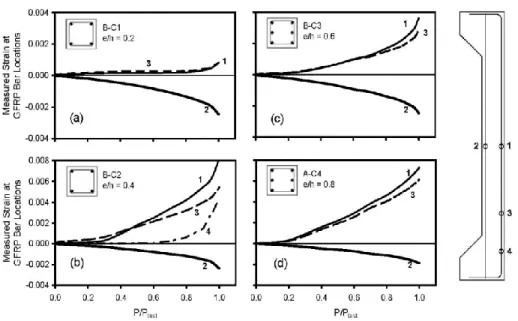
Tikka et al. 2013, conducted an experimental study to investigate the behavior of eccentrically loaded slender NSC columns that are longitudinally reinforced with GFRP and laterally tied using a carbon fiber spiral wrap. The columns were divided into two series: Series A and Series B were the reinforcement were provided by different manufacturer. For each series two columns (C1 and C2) were longitudinally reinforced with four 12.7 mm diameter GFRP bars and two columns (C3 and C4) were reinforced with six 12.7 mm GFRO bars. For all of the columns the maximum axial load (Ptest) coincided with the initial onset of crushing of the concrete along the compression face. In five of the column tests the initial onset of crushing of the concrete occurred within the middle third of column height and for columns A-C2, B-C1 and B-C4 the initial onset of concrete crushing occurred nearer the end haunches.
Figure 2.5 compares the strain to the axial load (P/Ptest) where P is the applied axial load and Ptest is the column axial capacity. The concrete stress was ranging from 0.0032 for low eccentricity columns to 0.0045 for higher eccentric columns, while for the tensile strain the tensile strain was nearly the same, except for columns with high eccentricity (e/h ≥0.4)
16
where the tensile strain become visibly apparent due to second order effects.
Figure 2.5– Measured strain at selected GFRP bars (Tikka et al. 2013)
Leite et al. 2013, tested 32 columns with unequal eccentricities at the ends to calibrate and check simplified approaches. The variables were: concrete strength, slenderness, reinforcement ratio. Based on the test results of these columns, five types of failure were defined; instability (by tension or compression), elastic instability, ultimate strength of the section wither tension or compression failures. At the ultimate load, a plastic hinge is produced in the critical section after reaching the maximum load and racks starts to appear. Also, it was observed that columns with HSC had a more brittle failure behaviour compared to NSC. Cover spalling occurs more early in HSC. The strains registered in the concrete for the ultimate load are larger than the strain provided by design codes which gives an underestimation of the ultimate bending force. Finally, the authors mentioned that the accuracy of using simplified methods has a low accuracy in case of HSC.
(Tobbi et al. 2014) had conducted an experiment using twenty concrete columns measuring 350 X 350 X 1400 mm and tested under concentric loading. The specimens were including one plain concrete columns, 8 columns entirely reinforced with GFRP bars and 11 columns reinforced with steel longitudinal bars and FRP tie and cross ties.
17
The effect of longitudinal reinforcement was investigated by comparing the columns with FRP and steel longitudinal reinforcement, see Figure 2.6. Two columns 1-120-1.0 and G-1-120-1.0S had the same reinforcement ratio (1%). the steel reinforced column had a higher peak stress than the GFRP column, and the GFRP column showed a nearly constant value of load carrying capacity after the peak stress. The difference in post peak behavior is explained as the load remains constant when the steel yield, while the load increased with axial strain with elastic GFRP bars.
Figure 2.6 – Effect of longitudinal reinforcement on compressive behavior of columns. (Tobbi, et al. 2014)
The ultimate axial compressive strain for columns reinforced longitudinally and transversally with FRP can reach a value of the same magnitude as the FRP ultimate tensile strain of the longitudinal bars under good confinement conditions.
The authors proposed an equation (Eqn. 2.2) to take into account the contribution of the GFRP bars in compression at peak.
𝑃𝑛 = 0.85𝑋 𝑓𝑐′𝑋(𝐴
𝑔− 𝐴𝑓𝑟𝑝) + 𝜀𝑐𝑜𝑋𝐸𝐹𝑅𝑃𝑋𝐴𝐹𝑅𝑃 (2.2) Where 𝐴𝑔 is cross sectional area of the column; 𝐴𝑓𝑟𝑝 is cross sectional area of FRPP longitudinal reinforcement; 𝑓𝑐′ is the concrete compressive strength; 𝜀
𝑐𝑜 is concrete strain at peak stress and is 𝐸𝐹𝑅𝑃 modulus of elasticity of FRP longitudinal reinforcement.
18
The same author conducted another experimental program to study the effect of FRP bars as longitudinal and lateral reinforcement on the concrete column response (Tobbi et al. 2012). Eight specimens were tested: one made of plain concrete, two steel RC columns and five GFRP RC columns. All of the RC columns had similar reinforcement ratios 1.9% of the gross sectional area.
The main conclusions stated by these authors were:
• Early spalling of the concrete resulted in a loss of axial capacity before the lateral reinforcement being utilized.
• Strength reduction factor of 0.85 can be used for GFRP reinforced columns. • FRP compressive strength at 35% of the FRP maximum tensile strength.
• GFRP bars used contributed 10% of the column capacity which is close to steel’s contribution 12%.
Extensive study was conducted at University of Sherbrooke to study the behavior of eccentric columns using fifty full scale specimens with circular cross section of 305 mm and 1500 mm height. Several articles were published discussing the effect of different parameters such as spiral spacing, reinforcement ratio, reinforcement type and using different concrete strength (Hadhood et al. 2016a and 2016b, 2017a, 2017b, and 2018). The test variables were the reinforcement ratios and the eccentricity to diameter ratio. The author stated that the GFRP reinforcement can be effectively integrated into high-strength concrete column, which proved to enhancing the stiffness of cracked concrete section. The tests results indicated that the GFRP reinforced HSC columns exhibited compression failure resulting from concrete crushing for specimen under low eccentric loading, while specimens tested under high eccentric loading had a flexural-tension failure imitated in the specimens. It’s worth mentioning that failure off the columns under high eccentric loading weren’t triggered by rupture or crushing of the GFRP bars. The maximum strain value for GFRP bars was -3100 microstrains (13% of the ultimate strain) for the tension side and 6800 microstrains 28% of the ultimate strain on the compression side. The author mentioned also that the ACI 440.1 R-15 or CSA/CAN S806-12 accurately predicted the axial and flexural
19
capacity of the GFRP reinforced HSC columns by ignoring the contribution of the GFRP bars in compression.
XUE et al., 2014 conducted an experimental program to investigate the mechanical behavior of GFRP RC columns under static eccentric loading. Seven square 300 mm width GFRP RC columns were tested. The test variables included three eccentricities 60, 150, and 300 mm. They also include three nominal slenderness ratios 8, 10, and 12. Finally they include three reinforcement ratios 0.45%, 0.67%, and 1.27%. The tests were conducted using a 10,000 KN testing machine in Tongji University. Both end supports of the columns were designed as hinged connections with predefined eccentricity. Figure 2.3 shows the specimen details. The following points were concluded:
For specimens with length of 3600mm (nominal slenderness ratio is 12), the ultimate load of CE-3 with an eccentricity of 60 mm was 1632kN, while that of CE-4 (with an eccentricity of 150 mm) and CE-5 (with an eccentricity of 300 mm) were 493kN and 300kN, which were decreased by 69.8% and 81.6% when compared with that of CE-3, respectively. The results showed that eccentricity had a significant effect on ultimate load of eccentrically loaded GFRP RC columns.
Figure 2-3– Specimen detail, [XUE et al., 2014]
(Hales et al. 2016) experimented nine circular columns reinforced, six of them were short and three were long columns. Three of these columns were reinforced using GFRP bars for transverse and longitudinal reinforcement. The failure mode for the short columns with low eccentricities was mainly a material type failure caused by compressive failure of the concrete, tensile rupture of GFRP spiral, compressive rupture of the longitudinal GFRP bars
20
and compressive buckling of the longitudinal steel bars. Moreover, the failure mode for the long slender columns was a stability type buckling failure around the mid height region of the columns. The authors confirmed that GFRP spiral can be used in columns but they should be provided with larger cross sectional area and smaller pitch to have the same confinement levels for those of steel stirrups. Also, GFRP longitudinal reinforcement can provide larger deflection capacity compared to steel bars due to their higher tensile strength; in addition, they provide self-centering effect.
Fan and Zhang 2016 tested BFRP RC columns reinforced with BFRP bars. The columns were made with NSC with concrete strength of 33 MPA. The columns dimensions were 900 mm height and square cross section of 120 mm width. The columns were tested under small eccentricity of value 20 mm and large eccentricity of value 80 mm. The results were similar to GFRP RC columns under small were failure was marked by crushing of concrete and under large eccentricity where the failure was marked by intense and large tensile cracks formed along the tension side of the columns.
Maranan et al. 2016, investigated the behavior of concentrically loaded GFRP circular columns reinforced with GFRP bars. Six short columns with L/r = 8 and two slender columns with L/r = 16 were tested. The GFRP bars contributed an average of 7.6& to the overall capacity of the tested columns. The compression contribution of GFRP bars varied from 6.6% to 10.5%. the short columns failed due to crushing of concrete or shear failure. Several studies have been published recently by a research group in University of Wollongong on the behavior of GFRP-RC columns under axial and/or eccentric loading (Hadi and Youssef 2016; Hadi et al. 2016; Hasan et al. 2016 and 2017; Karim et al. 2016, 2017a, 2017b). These studies include experimental and analytical investigations of various parameters. The experimental program used square cross section of 210 mm sides and 800 mm height and/or circular sections of diameter 205 mm and height 800 mm. The specimens tested under concentric loading; eccentric loading of 25 mm and 50 mm; and/or two-point loading flexure. The test variables were the type of reinforcement (steel vs. GFRP); external confinement or none; internal reinforcement or none; normal concrete or fiber-reinforced concrete. The analytical program included developing interaction diagrams; parametric
21
studies; estimation of ductility. Their concentric GFRP-RC specimens exhibited second peak points indicating proper confinement, provided by helices spaced each 30 mm or 60 mm. The closely spaced specimen exhibited, however, higher second peak than the other (Hadi et al. 2016). They reported that reducing the GFRP helices pitch from 60 to 30 mm led to an improvement in the performance of the GFRP-RC specimens in terms of load-carrying capacity, bending moment, and ductility. They also reported that the contribution of the longitudinal steel bars in the load carrying capacity of the concentric column specimens was about twice the contribution of the longitudinal GFRP bars, whereas the ductility of the GFRP-RC column specimens was slightly greater than the ductility of the reference steel-RC column specimens under different loading conditions. Karim et al. 2017 addressed the limits of FRP reinforcement in members with different cross sections and different bar arrangements. The study findings include proposing an equation for calculating the deformability factor (DF) using integration of the concrete layers through Popovics’s model (1973), in which the DF is a ratio of the product of moment and curvature at ultimate to the product of moment and curvature at serviceability limit state.
Sun et al. 2017 investigated the behavior of GFRP RC columns under an eccentric load values of 175 mm, 125mm and 75 mm using columns with 180 mm X 250 mm. The columns exhibited brittle failure after reaching the peak load. The GFRP bars do not experience damage even after the concrete is damaged. The results indicated that GFRP bars work better with concrete as the compression reinforcement when compared to tensile behavior. Therefore, GFRP bars exhibited significant advantages.
Elchalakni and Ma 2017 conducted an experimental program on 17 rectangular columns with dimension of 150 mm and 75 mm reinforced with both steel and GFRP rebars. The columns were tested to failure under various loading conditions, in order to determine the effect of load eccentricity on axial capacity. The columns were tested under different loading conditions starting from axial loading to pure flexural. The test parameters were the spacing of transverse reinforcement and type of reinforcement. It was found that. The average axial load carrying capacity of the GFRP RC columns under concentric load was 93.5% of their steel RC column counterparts. The GFRP RC columns also exhibited 3.2% average increase
22
in the load carrying capacity and the steel reinforced columns achieved 15.8% increase in the concrete section capacity compared to plain concrete section. It was also mentioned that GFRP RC columns and beams were found more ductile compared to their steel reinforced counterparts because they absorb more energy through their ability of well deforming in the post-peak collapse region.
Khorramian and Sadeghian 2017 presented and experimental and analytical studies on short concrete columns reinforced with GFRP rebars. The program consisted of fourteen 500 mm long specimens with a square cross section of 150 * 150 mm. Three eccentricity to width ratios of 0.1, 0.2 and 0.3 were considered. The experimental program showed no crushing of GFRO bars at peak load and the corresponding strain did not reach 50% of their crushing capacity obtained from material test. According to the experimental and analytical study presented in this article, it was suggested to consider GFRP bars in compression as linear elastic material until concrete reach its maximum compressive strain.
Guerin et al. 2018 conducted experimental studies for columns with square cross section of 400 x 400 mm and 2000 mm long. The test parameters included the applied eccentricity (0.1h, 0.2h, 0.4h and 0.8h) , reinforcement ratios and reinforcement type ( steel and GFRP). All the columns were made with NSC of 41.2 MPa. The results of this experimental investigation were published in two journal articles (Guerin et al. 2018a and Guerin et al. 2018b).
The GFRP reinforced columns showed similar behavior for steel reinforced columns. The GFRP columns failed due to concrete crushing for all the tested eccentricities. Also, it was shown that using maximum GFRP tie spacing as half the limit recommended in ACI 318-14 for steel reinforced columns was sufficient to prevent the longitudinal reinforcement from buckling and to confine the concrete core in post-peak stages (Guerin et al. 2018a).
(Guerin et al. 2018b) investigated the influence of using different reinforcement ratios (1.0, 1.4, and 2.5%) for GFRP reinforced columns. The results of this investigation showed that GFRP reinforcing bars can develop high strains in compression up to 12,000 μɛ. The tensile bars with stood tensile forces for all the tested eccentricities up to reaching peak failure as a result of concrete crushing. Also, the study suggested to classify the axial-flexural interaction
23
diagram for GFRP reinforced columns into three categories similar to steel reinforced columns: a) compression controlled which is recognized by concrete crushing ɛc ≥ ɛcmax; ɛft ≤ 2000 μɛ, b) compression tension transistion, characterized by the initation of cracks on the tension side with strain limitation ɛc ≥ ɛcmax; 2000 ≤ ɛft ≤ 5000
24
CHAPTER 3
EXPERIMENTAL WORK
3.1. Introduction
The details of the experimental program that included twenty full-scale columns are presented in this chapter. The design, construction and testing of the specimens at the Structural Engineering Laboratory at the University of Sherbrooke are discussed in details.
3.1.1. General
FRP material is a fairly newly discovered which means a lot of research needed to be conducted in this area to fully understand the behavior of this material when used with reinforced concrete. This means theoretical analysis and experimental work need to be conducted specially with high strength concrete. The research project aims to investigate the compressive behavior of high strength concrete columns reinforced with FRP under eccentric loading. The research in this report is divided into two main parts; experimental program and theoretical analysis. The experimental program includes the most effective parameters that are mainly affecting the behavior of columns under eccentric loading. The results of the tests were compared and conducted with the theoretical analysis aiming to provide new guidelines for the design and behavior of High strength concrete columns reinforced with FRP bars.
The test results were analyzed to derive equations for the development of axial load-moment interaction diagrams for square cross section. Besides, it was used check the validity of applying the current design equations used for columns made with NSC and compare it with the test results. All the work were used to provide guide lines to design high strength high strength concrete column reinforced with FRP.
25
3.2. Objectives
The main objective of the research program is to investigate and evaluate the performance of High strength concrete columns reinforced with FRP bars and stirrups under eccentric loading. Also, it aims to propose design guidelines that include new strength factors to account for the behavior of FRP reinforcement. The specific objectives of this study can be summarized as follows:
• Determine axial resistance of columns with high strength concrete under eccentric compression.
• Evaluate the data published by other researchers related to stress block parameters, ultimate compressive strain of HSC.
• Evaluate the effect of testing parameter, i.e., spacing of transverse reinforcement, and longitudinal reinforcement on strength and ductility of columns with high strength concrete.
• Develop and introduce modifications to the existing design equations of the GFRP-BFRP-RC columns under eccentric loading.
• To evaluate the contribution of BFRP and GFRP bars on the compression side.
3.3. Experimental program
A total of 20 square columns were designed in order to be tested under different eccentric loading. All columns have 400 mm width and an overall height of 2000 mm.
3.1.1 Proposed test parameters
In order to properly fulfill the previously mentioned objectives, parameters were chosen to be studied in this research program. These values inside each parameter has been chosen based on the literature review, codes design equation and personal experiences. The parameters are:
26 1. Eccentricity.
2. Type of reinforcement.
3. Glass Fiber longitudinal reinforcement ratio. 4. Comparing NSC with HSC.
3.1.2 Material properties
The research proposed examines the effect of various reinforcement types and stirrup spacing. This variety is chosen to draw a full conception for charging vital properties upon the behavior of concrete columns under eccentric loading.
3.1.2.I: Concrete
The specimens were all cast with ready-mixed concrete with a water-to-cement ratio of 0.32. The cement used was Type GUb-8SF, which was premixed with silica fume and water reducer, as shown in Table 2. The silica-fume percentage was 9.4% by mass. The slump was around 80 mm (before adding the superplasticizer). The concrete strength was determined in accordance with ASTM C39/C39M by testing 150 × 300 mm cylinders that were cured under conditions similar to that of the cast specimens. The concrete cylinders had an average strength of 71.2 MPa on the day of testing.
3.1.2.II: Fiber reinforced polymers (FRP)
Two types of fiber polymers bars are used in this research, Glass (GFRP) and basalt (BFRP). These types are the most familiar among the fiber family. Sand-coated GFRP bars and ties (TUF-BAR/PB Composites, 2016) were used to reinforce the column specimens in the longitudinal and transverse directions, respectively, as shown in Fig. 3-1. The GFRP bars had a sand-coated surface to enhance their bond with the surrounding concrete. No. 6 (19 mm in diameter) GFRP bars were used as longitudinal reinforcement for all the GFRPRC columns; No. 3 (10 mm in diameter) GFRP ties were used as transverse reinforcement. The tensile properties of the longitudinal GFRP were determined according to ASTM D7205/D7205M-06, as reported in Table 3-1.
27
Figure 3-1–GFRP and BFRP cages
Table 3-1 Mechanical properties of FRP bars* Bar
size
Diameter (mm)
Area
(mm2) modulus (GPa) Elastic tensile Tensile strength (MPa) strain (%) Tensile
GFRP reinforcement No.3 10 71 63.7 1370 2.2 No.6 20 285 62.7 1236 2.0 No.8 25 510 61.7 1001 1.9 BFRP reinforcement No.4 13 129 51.4 1414 2.70 No.6 20 284 120 1646 2.50
28
3.1.2.III: Steel Reinforcement
Grade 60 steel bars were used to reinforce the steel-reinforced control specimens. Deformed No. 6 (20M) and No. 3 (10M) steel bars were used as longitudinal and tie reinforcement, respectively. The mechanical properties of these steel bars were obtained by testing five representative specimens of each diameter according to ASTM A615/A615M-14 [23], as shown in Table 3-2. Figure 3-2 shows typical cages for steel reinforcement.
Table 3-2: Mechanical properties of Steel bars* Bar size Diameter (mm) Area (mm2) Elastic tensile modulus (GPa) Yield Tensile strength (MPa) Ultimate Tensile strength (MPa) Tensile strain (%) 10M 11.3 100 200 460 660 0.2 20M 19.5 300 200 460 660 0.2
* As provided by the manufacturer
29
3.4. Specimen Design
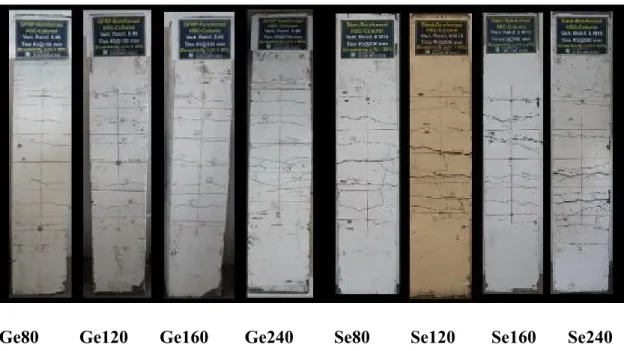
A total of 20 specimens are designed to study the effect of eccentric loading. All the test specimens had a 400 × 400 mm cross section and a height of 2000 mm, giving an aspect ratio of 0.2. These dimensions were selected to ensure the specimens were large enough to be considered full-scale columns, yet easy to handle without cracking. The specimens were designed to investigate the influence and behavior of using GFRP and BFRP reinforcement in HSC columns and to test them under different magnitudes of eccentricities. The eccentricities were 80, 120, 160, and 240 mm. These values were selected to ensure different and discrete points that could be plotted to cover a wide range of the interaction diagram representing the strength of the column under different eccentricities. The columns had a reinforcement ratio equal to 1% of the concrete cross section, which meets the minimum reinforcement ratio for flexural reinforcement specified in ACI 440.1R-15 [5] and ACI 318-14M [25]. The spacing for the FRP ties was 150 mm and 300 mm for the steel. The tie spacing for steel RC columns was chosen considering the allowable maximum tie spacing as provided in the ACI318-14.
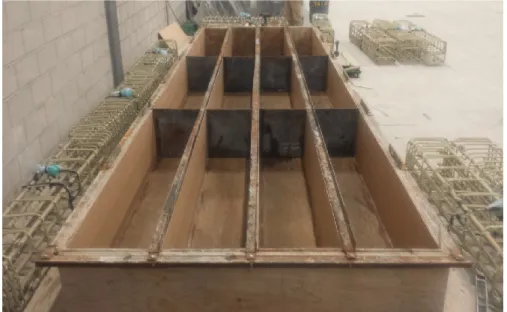
3.5. Specimens production
3.5.1. Cage Assembling
All the cages (steel, basalt and glass) were made at Sauvee laboratory. The bars were fixed horizontally between two wooden plates which has identical slots to fix the bars in place. This ensures all the columns with the same number of bars have the same spacing. The stirrups were then inserted from one end and then tightened in place using Tie-raps. Finally, plastic circular bar spacers were fixed on the bottom and the sides of the cages in order to maintain a 25mm clear cover. Figure 3.8 shows some assembled cages of different reinforcement materials. The end regions of the columns have more dense stirrups spaced at 8cm to resist the end moment due to the end capping.