The French Social Protection System:
Path Dependencies and Societal Coherence
Jean-Claude BARBIER
Centre d’études de l’emploi, Université Paris VII Denis Diderot ([email protected])
&
Bruno THÉRET
CNRS, IRIS, Université Paris Dauphine ([email protected])
Provisional version, May 2000
I
N T E R N A T I O N A LS
O C I A LS
E C U R I T YA
S S O C I A T I O N( I S S A )
RESEARCH PROGRAMMECONFERENCE HOSTS: FINNISH ISSA MEMBER ORGANIZATIONS
Conference on Social Security
Helsinki, 25-27 September 2000
Summary :
This paper examines the evolution of the french system of social protection since the mid seventies. It first describes overall trends in social expenditure during the last twenty years and then analyses how funding principles have been altered in the context of changing business cycles and the economic fundamentals (section 1). It then turns to a presentation of developments in terms of activity patterns, poverty, family and demographic patterns (section 2). The following sections are devoted to sectoral analysis with regard to privatisation (section 3), targeting (section 4) and activation tendencies (section 5). It concludes that globally the French system of social protection has undergone numerous innovative transformations since the eighties and the nineties which design a clear general trend. Rather than a radical shift in the traditional French Bismarckian model, what seems to emerge is a new Bismarckian/Beveridgean welfare mix. This particular mix appears as a logical extension of a pattern present from the early stages of the system in 1945. Change is path-dependent but that path dependency does not prevent innovation in the French hybrid system. Although Beveridgean principles have influenced these developments crucially, the outcome in terms of institutions and rules is certainly not uniformly Beveridgean. A tentative new alliance is building up between the traditional paritariste spirit and state dominated national solidarity.
Introduction
In welfare comparative research France has traditionally been grouped with Germany as one of the “industrial achievement performance” cluster (Titmuss, 1974). More recently it has been categorised as a “conservative” (or “corporatist-statist”) welfare regime (Esping-Andersen, 1990), i.e. as one of the “continental” models of social protection (Flora, 1986, Esping-Andersen, 1996). However we argue that these studies are methodologically and empirically flawed in the case of France, which is intermediary.
Using clusters inevitably implies listing “hybrid” countries under one of the ideal-types. Important features of the hybrid cases are thus underestimated or even ignored however determining they might be. “Hybrid” welfare states rather than strictly matching one of the three ideal-types (i.e., Germany, Sweden and the USA) combine characters of them1, and static clustering methodologies tend to be inadequate when change is considered. Dynamic trajectories indeed involve new combinations of these characters (Martin, 1998).
International comparisons used to exclude the France till the late nineties and empirical evidence was lacking. But recent research2 has been available to compare the French Social Protection System (FSPS) with other regimes. These studies point to some important features, notably its family policies, which contrast it with the German type. In this area, the French system rather resembles the “Nordic”, social-democratic Beveridgean regime (Bradshaw and alii, 1994; Schultheis, 1996; Théret, 1996; Merrien, 1997; Martin, 1998). Indeed it has adequately been described as a Bismarckian system with Beveridgean outcomes (Bonoli et Palier, 1995; Palier, 1998, 1999). Such a qualification is consistent with the interpretation by Pierre Laroque - one of its founding fathers - of a compromise between both conceptions of social protection.
The FSPS exhibits four Bismarckian features: (1) It is extensively based on social
insurance principles and funded through emp loyers’ and employees’ social contributions;
earnings related benefits are not focused at alleviating poverty for a non-working population. (2) It used to be functional to the male-breadwinner family, where coverage extends to the employee’s wife and children. (3) It is fragmented i.e. made of a multiplicity of “régimes”3. (4) It is relatively independent from the state and jointly administered by social partners (trade unions and employers’ associations) under the paritarisme4 model. However this Bismarckian orientation has been tailored to achieve the three so-called Beveridgean “U objectives” (i.e. universality, unity and uniformity) (Kerschen, 1996). These have underpinned the historical development of the system since its 1945 foundation.
Rather than through applying one single scheme to the entire population, universality has been pursued through the continuous creation of new schemes and benefits to cover uninsured risks (such as the unemployment insurance in 1958), or to cover new categories of the
1 For developments of this argument, see Théret, 1996 and 1997. 2 Thanks to MIRE 1995, 1996, 1998, 2000 and Pallier, 1999.
3 A régime (a particular sector/scheme within the overall insurance system with specific eligibility rules and benefits) covers employees in a particular trade or industry (for instance, railway employees) or a category of employees (for instance, managers, etc.).
4 Paritarisme here stands for an equal representation (parity) of employers’ associations and labour unions on the Funds’ boards (caisses). This principle has undergone many reforms since it was introduced in 1945.
population. Through this gradual process, a wage earner status gradually emerged as a pivotal reference5.
As for unity, it has been achieved under the symbolic “Sécurité sociale”6 flag instead of a centralised single state bureaucracy. The multiple schemes (régimes) were made financially coherent (via “compensation démographique” mechanisms between them7) into an overall system under central government’s tutelle (supervision). They adopted an “isomorphic” administration pattern (paritarisme) as well. On top of this, all particular régimes have kept participating in national solidarity (Barbier and Théret, 2000).
Finally, contrary to Beveridgean flat-rate contributions and benefits, uniformity was nevertheless present in the French system via the existence of “ceilings” applied for calculating contributions. The Bismarckian rationale was to some extent thus restricted to lower incomes, the Beveridgean logic being so-to-say reserved for the richest8.
Hybridisation between Bismarckian and Beveridgean rationales has been a key factor of
the changing FSPS for the last twenty years. This process is consistent with the possibility of
multiple paths of historical dependence. Whereas Bismarckian features (namely, social insurance,
“weak-stateness”, fragmentation) constantly prevailed throughout the system’s building stages, Beveridgean features were also at work. Testimony of this is for instance the gradually universalised access to healthcare and family benefits on the mere basis of residency. As internal and external challenges emerged, these Beveridgean features somehow acted as resources allowing for new potential compromises.
Analysing the French system’s coherence and its embeddedness in French society vindicates the assumption that “dominated” Beveridgean features might provide internal resources for transformation. However the French system’s coherence should not be overestimated (Hesse, 1999). Particularly when compared with the German ideal-type, the French welfare state appears very discordant because many other French institutions are at odds with the Bismarckian model. Paritarisme is deprived of a functional equivalent for the German industrial relations system (Tixier, 1998). French trade unions are divided and very weak; contrary to their German counterparts, they have no substantial say in companies’ decisions (except for consultation procedures). French labour law, as part of a “social public order” is rooted into universal political rights rather than into a wage earner status, as in the German model (Mückenberger and Supiot, 1999). Social rights thus appear more to compensate for a deficit than to complement labour’s economic and political rights. Because of the division within the trade union movement and the powers of state social bureaucracy, paritarisme between business and labour has often been more conventional than substantial (Catrice-Lorey, 1997)9.
5 This interpretation of universality presumes a full employment society where wage earners enjoy citizenship and a status based on permanent/stable job tenure with social rights attached.
6 When “social security” is used in the text, it refers to Sécurité sociale in the French sense, which is different from the US and UK meaning and closer to the German.
7 Structures of contributors and recipients vary considerably across the “régimes”: “Compensation démographique” refers to the special transfer mechanisms between régimes that compensate for these structural imbalances. These special transfers thus play a key role in the global coherence of the overall system.
8 From the eighties on, for financial reasons, ceilings for contributions have gradually disappeared (except in limited areas, for instance for pensions - régimes complémentaires).
9 An exception is the complementary pension schemes for managers and executives (cadres) (Reynaud, 1996). Another one may be found within the public firms (Duclos et Meriau, 1997) where it constitutes a sort of French neo-corporatism.
Secondly, the French educational system (seldom considered as part of the social protection system) is built on “liberal republican” - akin to Beveridgean, solidaristic and/or egalitarian principles (Renard, 1995; Kott, 1996; Bec, 1999). Its limited vocational training capacity shows a stark contrast with the German system (Maurice, Sellier, Sylvestre, 1982; Möbus and Verdier, 1987; Verdier, 2000).
Consequently, increasing influence of Beveridgean principles within the dominantly Bismarckian FSPS has resulted in growing internal tension. This is particularly clear with family policies. Historically, family allowances were administered directly by employers, which explains their subsequent inclusion within social insurance funds. However, as is well documented, the French State has traditionally been involved in natalistic family policies. Hence, from the first stages of the FSPS, Bismarckian principles for financing family benefits have been used in a natalistic and universalistic perspective (Messu, 1999). Eventually, the transformation of family patterns eroded the legitimacy of social insurance principles to finance flat rate universal allowances.
In the post-war context, Bismarckian forms of organisation were supported by reformist trade unions and employers’ associations whereas the “three Us” objectives, more in line with French republican tradition were supported by political parties (Bonoli and Palier, 1995). Because full employment allowed for the overall extension of the wage earner reference, compromises were possible. These proved both economically functional and socially efficient: social insurance and assistance principles were complementarily embedded into the basic scheme (régime général) (Renard, 1995; Bec, 1999).
However, the system subsequently became less efficient. It was first confronted with internal challenges (structural unemployment and “social exclusion”; the male breadwinner family’s crisis; ageing and inadequate containment of health costs). It also faced external challenges (globalisation). Compromises between actors within the hybrid Beveridgean/Bismarckian mould have thus been destabilised and new compromises are presently needed. Nevertheless, the French welfare state’s hybrid structure should not be equated with an entrenched incapacity for change. On the contrary, a hybrid structure might well constitute a comparative advantage in confronting the new challenges. Using its internal resources for innovation the FSPS could then eschew the polar choice between conservation (continuity) or revolution (radical change).
We will first describe overall trends in social expenditure during the last twenty years and then analyse how funding principles have been altered in the context of changing business cycles and the economic fundamentals. The budget deficit has constituted a key factor in this process (section 1). We will then turn to a presentation of developments in terms of activity patterns, poverty, family and demographic patterns (section 2). The following sections will be devoted to sectoral analysis with regard to privatisation (section 3), targeting (section 4) and activation tendencies (section 5).
Section 1 - An evolving political and economic context
1-1. Trends in social expenditures
Trends explaining the main challenges the French État social, along with other welfare states, has gradually been facing for the last twenty years, can be traced to the combined effects of (i) financial constraints, (ii) labour markets under pressure for flexibilisation, and (iii) demography and family patterns.
In any national system of social protection (NSSP) this combination of exogenous and endogenous changes is closely related to outcomes in terms of inequality, poverty and unemployment. But, because of increasing internationalisation of expertise and decision-making concerning social policy, it has become conventional wisdom that, even when they belong to different clusters (Lautier, 1995), welfare states face the “universal” challenges of globalisation. Esping-Andersen (1996, p. 6-7) for instance notes the “changes in family structure (the rise of single-parent households, for example), in occupational structure (indeed professionalization and differentiation) and in the life cycle (which is becoming less linear and standard)”. These remarks point to such challenges as fertility decline, unstable couples and families, single parenthood, child poverty, workless households, welfare traps, insufficient employment and activity rates for certain segments of the working age population. For our part, we contend that NSSPs diverge
sufficiently so as not to face the same challenges, although from a general perspective they
obviously face similar challenges. The difference between sameness and similarity points to different NSSPs rationales as key explaining factors.
In the following paragraphs, after exposing the global trends and the macro-economic and political contexts, we will address these “universal challenges” in the specific terms in which they are constructed within the FSPS. Using systematic comparisons with other countries in Europe10, we shall observe how France has comparatively fared.
In the second half of the 90s, total social expenditure11 amounted to around 37% of households’ gross disposable income and nearly 30% of GDP12 (Abramovici and Mathieu, 1999, p. 18-19), i.e. approximately the mean European ratio. At the beginning of the 60s, the figure was 15% and it peaked at roughly 19% at the end of the “Fordist” era. The period from the mid-70s on should be broken into three (figure 113).
The first period (1974 to 1983) saw a sharp increase of the social expenditure ratio to GDP in a context of stagflation. It combined high inflation - around 11% since 1974 (figure 6) - with a rapidly increasing unemployment rate - from 2.7% in 1974 to 9.1% in 1983 (figure 4). Those were correlated with a steadily declining GDP growth rate - from 4.2% in 1976 to 0.7 % in 1983 (figure 3). Sustained social expenditure growth during this period reflected both hysteresis
10 Given the nature of the collective comparative research within which the present study was conducted, it seemed convenient to contrast the French case to the British, but also to the German and Scandinavian.
11 Labour market programmes expenditure is usually not considered as part of the social protection budget. As will be seen in section 5, it has nevertheless become an important element of social policy in France for the last twenty years.
12 When including public transfers of goods and services, such as education and culture, a “socialisation ratio” of households’ income amounts to about 45%.
and further expansion of the Fordist-Keynesian welfare state. A significant increase in unemployment insurance benefits took place in 1974, as well as an increase of family benefits in 1981 and legal retirement age fell from 65 years to 60 in 1982. Increasing social needs, growing unemployment and high inflation were addressed according to the previously established FSPS rules, and social benefits kept growing at a high nominal rate – i.e. 16% (figure 2).
The nominal growth rate of social expenditure decreased during the second period (1984 to 1993) and stabilised at 6% (figure 2). Successive measures were implemented to contain and reduce expenditure. Whereas the overall structure of the system remained unchanged, Beveridgean innovations surfaced during the late 80s14. The social expenditure ratio to GDP in this period appears to fit with the growth cycle (first a decline and then a sharp climb until the 1993 recession, figure 1).
1994 initiates a third period where social spending has stabilised and even relatively declined. Structural reforms have now been on the agenda for some time (figures 1 and 2).
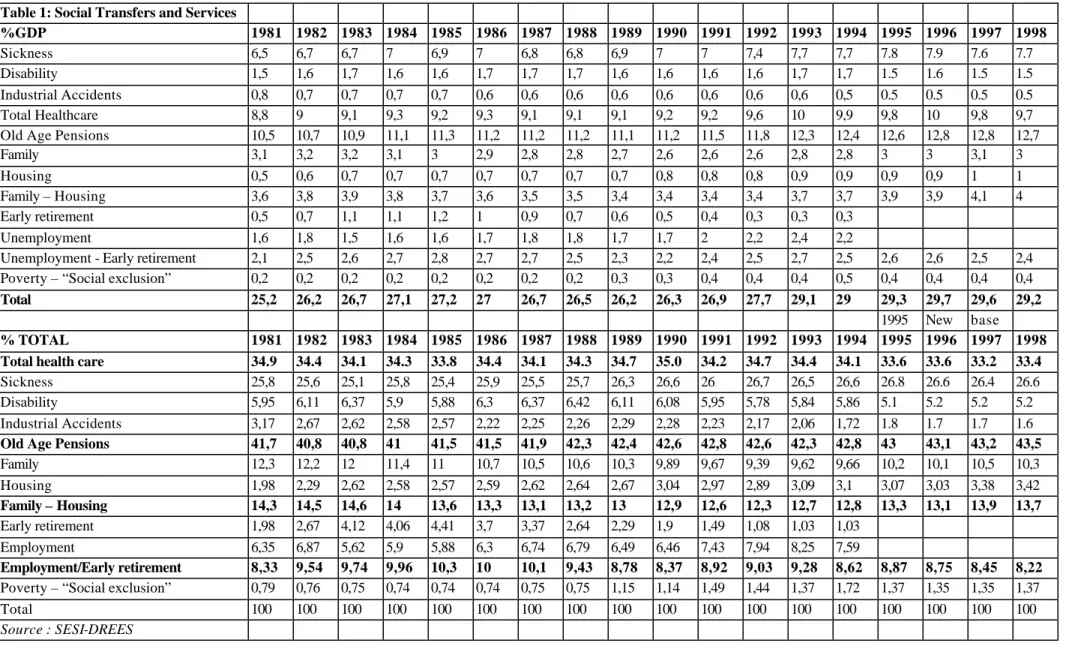
Pensions (12.7% of GDP and 43.5 % of social transfers and services in 1998) and healthcare15 (respectively 9.7 % and 33.2 %) account for the bulk of French social expenditure. The other areas are (i) family and housing benefits (4% of GDP and 13.7 % of transfers), (ii)
unemployment and early retirement (2.4 % and 8.2%) and (iii) poverty and “social exclusion”
(respectively 0.4 % and 1.4 %).
Table 1 shows how social expenditure evolved between 1981 and 1998. The pensions’ share grew by 2 GDP points between 1981 and 1998 and healthcare by 1 point whilst from 1983 on family/ housing benefits and unemployment compensation (including early retirement) have been effectively contained. The doubling of resources allocated to poverty and social exclusion should also be stressed, despite their relatively small share in the total.
During the last 20 years, this structural evolution has chiefly related to endogenous rather than exogenous factors: population ageing and a growing demand (and supply) for healthcare services, (most of which go to the elderly) are explaining factors. The three other “risk areas” experience evolutions linked to labour market imbalances. Whilst significant in terms of their contribution to the social protection crisis, their role appears more qualitative than quantitative.
14 The CCSS “Commission des comptes de la Sécurité sociale” (a supervisory body) was created in 1979. Cost containment thus entered the political agenda (Serré, 1999, p. 55). Subsequently reformed the Commission only embarked on an effective role from 1987 (Serré, 1999, p. 57). RMI was created in 1989 and CSG in 1991 (see further).
15 Including sickness and income compensation, disability and industrial accident benefits. If pensions and healthcare are the main sectors of social protection in all EU countries, in some - namely Finland, Ireland and the Netherlands - healthcare is on top of the list. Portugal, the United Kingdom and Sweden spend almost as much for healthcare as for pensions (Caussat et Hel-Thelier, 1998, p. 76).
Table 1: Social Transfers and Services %GDP 1981 1982 1983 1984 1985 1986 1987 1988 1989 1990 1991 1992 1993 1994 1995 1996 1997 1998 Sickness 6,5 6,7 6,7 7 6,9 7 6,8 6,8 6,9 7 7 7,4 7,7 7,7 7.8 7.9 7.6 7.7 Disability 1,5 1,6 1,7 1,6 1,6 1,7 1,7 1,7 1,6 1,6 1,6 1,6 1,7 1,7 1.5 1.6 1.5 1.5 Industrial Accidents 0,8 0,7 0,7 0,7 0,7 0,6 0,6 0,6 0,6 0,6 0,6 0,6 0,6 0,5 0.5 0.5 0.5 0.5 Total Healthcare 8,8 9 9,1 9,3 9,2 9,3 9,1 9,1 9,1 9,2 9,2 9,6 10 9,9 9,8 10 9,8 9,7 Old Age Pensions 10,5 10,7 10,9 11,1 11,3 11,2 11,2 11,2 11,1 11,2 11,5 11,8 12,3 12,4 12,6 12,8 12,8 12,7
Family 3,1 3,2 3,2 3,1 3 2,9 2,8 2,8 2,7 2,6 2,6 2,6 2,8 2,8 3 3 3,1 3
Housing 0,5 0,6 0,7 0,7 0,7 0,7 0,7 0,7 0,7 0,8 0,8 0,8 0,9 0,9 0,9 0,9 1 1 Family – Housing 3,6 3,8 3,9 3,8 3,7 3,6 3,5 3,5 3,4 3,4 3,4 3,4 3,7 3,7 3,9 3,9 4,1 4 Early retirement 0,5 0,7 1,1 1,1 1,2 1 0,9 0,7 0,6 0,5 0,4 0,3 0,3 0,3
Unemployment 1,6 1,8 1,5 1,6 1,6 1,7 1,8 1,8 1,7 1,7 2 2,2 2,4 2,2
Unemployment - Early retirement 2,1 2,5 2,6 2,7 2,8 2,7 2,7 2,5 2,3 2,2 2,4 2,5 2,7 2,5 2,6 2,6 2,5 2,4 Poverty – “Social exclusion” 0,2 0,2 0,2 0,2 0,2 0,2 0,2 0,2 0,3 0,3 0,4 0,4 0,4 0,5 0,4 0,4 0,4 0,4
Total 25,2 26,2 26,7 27,1 27,2 27 26,7 26,5 26,2 26,3 26,9 27,7 29,1 29 29,3 29,7 29,6 29,2
1995 New base
% TOTAL 1981 1982 1983 1984 1985 1986 1987 1988 1989 1990 1991 1992 1993 1994 1995 1996 1997 1998
Total health care 34.9 34.4 34.1 34.3 33.8 34.4 34.1 34.3 34.7 35.0 34.2 34.7 34.4 34.1 33.6 33.6 33.2 33.4
Sickness 25,8 25,6 25,1 25,8 25,4 25,9 25,5 25,7 26,3 26,6 26 26,7 26,5 26,6 26.8 26.6 26.4 26.6 Disability 5,95 6,11 6,37 5,9 5,88 6,3 6,37 6,42 6,11 6,08 5,95 5,78 5,84 5,86 5.1 5.2 5.2 5.2 Industrial Accidents 3,17 2,67 2,62 2,58 2,57 2,22 2,25 2,26 2,29 2,28 2,23 2,17 2,06 1,72 1.8 1.7 1.7 1.6
Old Age Pensions 41,7 40,8 40,8 41 41,5 41,5 41,9 42,3 42,4 42,6 42,8 42,6 42,3 42,8 43 43,1 43,2 43,5
Family 12,3 12,2 12 11,4 11 10,7 10,5 10,6 10,3 9,89 9,67 9,39 9,62 9,66 10,2 10,1 10,5 10,3 Housing 1,98 2,29 2,62 2,58 2,57 2,59 2,62 2,64 2,67 3,04 2,97 2,89 3,09 3,1 3,07 3,03 3,38 3,42 Family – Housing 14,3 14,5 14,6 14 13,6 13,3 13,1 13,2 13 12,9 12,6 12,3 12,7 12,8 13,3 13,1 13,9 13,7 Early retirement 1,98 2,67 4,12 4,06 4,41 3,7 3,37 2,64 2,29 1,9 1,49 1,08 1,03 1,03 Employment 6,35 6,87 5,62 5,9 5,88 6,3 6,74 6,79 6,49 6,46 7,43 7,94 8,25 7,59 Employment/Early retirement 8,33 9,54 9,74 9,96 10,3 10 10,1 9,43 8,78 8,37 8,92 9,03 9,28 8,62 8,87 8,75 8,45 8,22
Poverty – “Social exclusion” 0,79 0,76 0,75 0,74 0,74 0,74 0,75 0,75 1,15 1,14 1,49 1,44 1,37 1,72 1,37 1,35 1,35 1,37 Total 100 100 100 100 100 100 100 100 100 100 100 100 100 100 100 100 100 100
The main challenges thus appear to have internal roots. They are not directly linked to the impact of globalisation and as has been noted by some pension reform experts (Masson, 1999, p. 64; Dupont and Sterdyniak, 2000), financial considerations do not prevail. Choices are of a social and political nature, closely connected to national welfare regimes16. Economic interests and neo-liberal social forces nevertheless tend to use these challenges as opportunities for changing the system. It is no wonder that they press for solutions such as privatisation in the potentially most profitable sectors (i.e. retirement and healthcare). On the other hand, unemployment, family/housing, and poverty risks face challenges related to transformations in gender relationships and family structures. But these welfare areas are dialectically related to the labour market situation and depend on labour relations and wage policies17.
All in all, two distinct sectors in the FSPS thus tend to emerge. The first one (pensions and healthcare) is confronted with pressure from financial interests (insurance companies, banks, international financial organisations, state financial élites) and globalisation strategies. The second sector (unemployment, family and anti-poverty programmes) is confronted to trade liberalisation strategies of world companies and neo-mercantilist governmental élites. This clear difference will appear in sections 3 and 4.
1 – 2. The macro-economic and political contexts
As social expenditure and GDP growth rate are linked, it is remarkable that the three periods referred above also are business cycles18. Traditionally business cycles “stylise” economic facts. Reference to them had disappeared in Europe during the Fordist era (1945-1975). However they were back with the mid 70s crisis. Links between social expenditure and production are not only explained in terms of economic cycles but also in terms of changing economic policies. Figure 3 shows quite divergent profiles and their corresponding underlying economic policies.
The first cycle encompassed both a fast recovery with sustained growth around 3.5% (1976-1979) and a gradual contraction resulting into a new recession in 1983. Keynesian policies were maintained during this cycle. These policies, labelled stagflationist, proved unsuccessful. They did not fit with an economy whose internationalisation increased quickly (see figure 7 below). Hence the doubling of the unemployment rate from 4% in 1975 to 8.1% in 1983 (figure 4) accompanied by persisting high inflation (a mean rate of 10.6% for 1976-1983) (figure 5).
The French socialists’ abrupt conversion to monetarism in 1983 and the subsequent change in economic policy explain the second cycle’s new profile. “Désinflation compétitive” (competitive desinflation19) and a strong franc tightly connected to the Deutsche mark as well as a restrictive fiscal policy resulted in: (i) the economic recovery being impaired in stark contrast with the fast 1975-76 recovery (figure 3). The upward trend of unemployment was thus not
16 On the political character of choices concerning healthcare and the political role of economists in that field, see Serré (1999, p. 64-70) and Dammame and Jobert (2000).
17 Wider disparities exist across European countries in the shares of family and unemployment benefits in total social expenditure than for pensions and healthcare (Caussat and Hel-Thelier, 1998, p. 76).
18 Part of one business cycle for the third period.
19 “désinflation compétitive” refers to economic policies implemented in the period mixing restrictive fiscal policies, trade liberalisation, strict monetary policy and the desindexation of wages.
reduced (this rate however decreased from 10.4% in 1987 to 8.9% in 1990). Unemployment remained higher than in the contraction phase of the previous business cycle (figure 4); (ii) a steep continuous fall in GDP growth rates (from 4.3% to –1.3%) from 1989 to 1993. At that time France experienced its worst recession ever since World War II and its unemployment rate peaked at 11.7% (a 44% increase as against the 1983 recession). Simultaneously the inflation rate dropped from 9.7% in 1983 to 2.5% in 1993 (figure 6). In spite of the currency’s overvaluation and thanks to desinflation the French economy was able to sustain the high degree of international opening up set in the previous period (figure 7).
The third cycle is currently underway. Very low inflation (figure 5) has settled as well as a rather steady and relatively low GDP growth (around 2.5%). The very high unemployment level is linked to hysteresis effects (figure 4). The present recovery is also marked by the completion of the European single market, with economic policies abiding by the Maastricht criteria and the first steps of the euro. A mooted point remains whether Economic and Monetary Union (EMU) will be able to open up new perspectives for co-ordinated economic policies at Community level. These could be more employment friendly and the contribution of social protection to economic growth could be emancipated from strict financial constraints20.
Moreover the role of global finance and trade liberalisation have actually proved crucial factors in the dynamics of the three above mentioned business cycles, inasmuch as they exert pressure on NSSPs.
In the first period real interest rates climbed steeply albeit gradually from negative values in 1975 (minus 4.8% and minus 2.4 % respectively for short and long term rates) to 2.6% and 3.6% in 1983 (figure 5). Rates kept growing during the second cycle, the short-term rate culminating at 8.13% the year before the 1993 major recession. On the contrary interest rates have declined in the third cycle, returning to their 1983 levels in 1998. Public debt followed a similar pattern albeit with some lag. Contained till 1981 in a period of inflationist monetary financing, it grew moderately from 1982 to 1991, sharp increases of real interest rates being compensated for through strict fiscal policy. Subsequently, public debt experienced strong growth from 1992 on because of the 1993 recession’s impact on social expenditure and public deficits, given the high rates inherited from the previous period (figure 6). Thanks to the Maastricht Treaty, economic recovery and declining interest rates, stabilisation now seems to be on the agenda.
Converging observations can be made with respect to the internationalisation of the French economy (figure 7). Growth in the 1975-83 period was supported by a rapid and wide expansion of trade relatively to GDP. This was true either within the European community or with third countries21. This reorientation of the French productive system towards external markets was greatly eased by a continuously weak franc against the US dollar, the British pound and the German mark (figure 8). During the following cycle, imports’ and exports’ shares steadily remained at around 22% of GDP, which was consistent with a quasi-fixed exchange rate of the franc vis-à-vis the mark and its rise against the dollar and the pound. From 1994 to 1999 more favourable conditions prevailed and the exports’ ratio nearly grew by 5 points, peaking at
20 The come back of business cycles and of deflationist policies implied a lower mean growth rate from 1975 (around 2% instead of 5%), resulting in structurally harder general constraints on FSPS funding. French economic cycles have been similar to those affecting other European economies but disconnected from the US (figure 3 above). Despite other structural differences, this could explain why understanding and constructing social problems according to “universal challenges” have lagged.
21 Initiated in 1969 the movement carried on at high speed until 1982 for imports (from 13.1% of GDP in 1968 to 23.7%) and until 1984 for exports (from 13.3% of GDP in 1968 to 24.1%).
27.4% whereas the import ratio only gained 3 points to 23.8%. The franc’s exchange rates against the dollar and the pound have been favourably dropping again.
Trade integration within the European single market has played a prominent role in these developments (figure 7). For instance, when the export ratio was around 24% of GDP, the ratio of trade with third countries was only 7%. This means that the current period is quite new when compared to both previous cycles: within EMU France enjoys much more favourable conditions for managing active labour market and fiscal policies as well as engaging in less restrictive monetary policies at the European level.
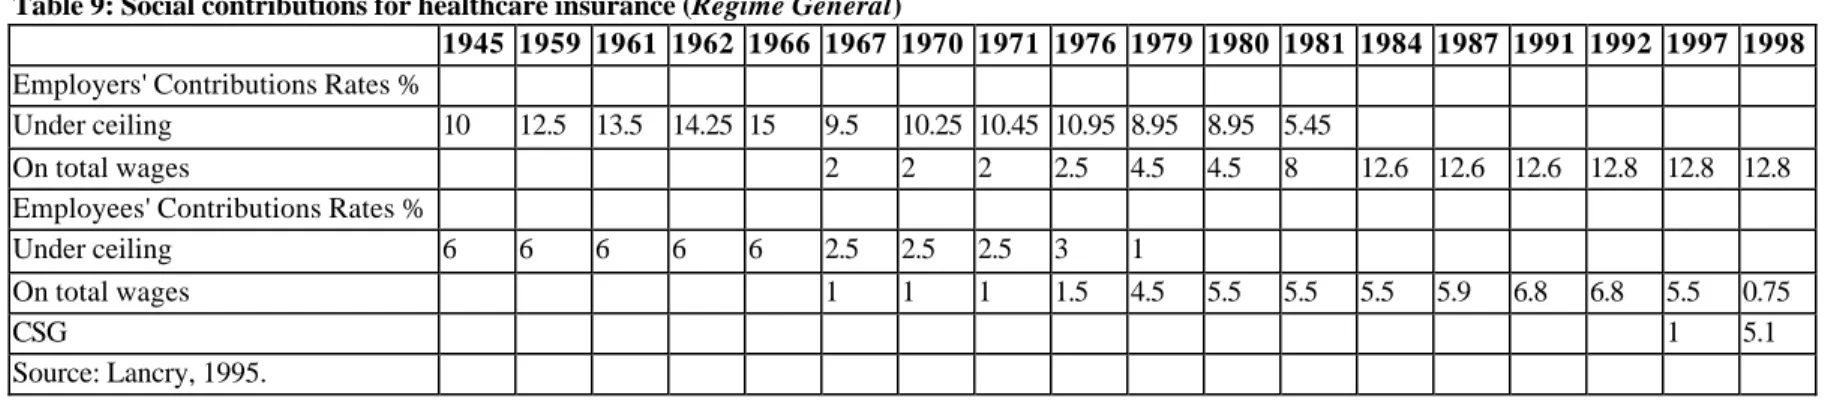
This situation is bound to significantly alter the reform’s context. Indeed European integration plays a crucial role because of the FSPS’s Bismarckian features (the social contributions’ role in financing). Globally within the EU where social contributions roughly finance two thirds of social expenditure (DREES, 1999, p.8; Caussat and Hel-Thelier, 1998, p. 76), the labour market situation directly affects social protection22. Conversely demands for new social rights, benefits and services directly affect business and/or employees. Thus growing unemployment does not affect social protection financing only on the spending side (by pushing up unemployment benefits), but also and mainly on the income side inasmuch as it reduces the social contributions’ base.
1 – 3. Innovation in financing principles
The ratio of social contributions to GDP may roughly be periodized accordingly (figure 9). During a first period it increased steadily (from 16.9% in 1974 to 22.3% in 1983). It subsequently stabilised (at roughly 22.7% till 1992) and then declined23. However these developments are connected with a major innovation with respect to funding principles. From 1991 on pay roll contributions were gradually and increasingly substituted by “Contribution
sociale généralisée” (CSG). CSG, being neither a tax nor a social contribution proper, combines
features of both and its taxing base extends to all incomes (wages, benefits and capital earnings).
This innovation is as important as the 1988 introduction of the Revenu Minimum
d’Insertion (RMI). It was devised to placate political controversy in the 80’s and 90’s relating to
what was considered as excessive reliance on social contributions. Critics argued in favour of enlarging social security’s tax base and embarking on a more Beveridgean type of funding. Social contributions allegedly endangered international competitiveness because they impacted indirect labour costs. But international comparison of unitary labour costs showed that the latter were not significantly higher in France. Social contributions, it was further argued, especially impacted low wages and unskilled labour in industries competing with low wages countries. Incentives to substitute capital for labour were assumed to be responsible for high unemployment and long term unemployment, as well as for poverty extension and an in-built social security deficit. Testimony of the underlying Beveridgean features at work in the FSPS, critics exposed the inadequacy of social insurance principles to fund national solidarity and risks as family and healthcare. National solidarity, it was contended, ought not to not be linked to pay roll contributions but to citizenship’s rights. Supply side economics resulted in the gradual extension
22 With social contributions amounting to 85 % of social benefits funding until 1990 (figure 9), France has had the highest ratio in the European Union and is consequently the most affected by these mechanisms.
of employers’ contributions breaks on wages (up to 1.8 SMIC, the minimum wage). Contributions breaks have also been massively resorted to for unskilled workers, apprentices, young workers with no qualifications, the long-term unemployed, etc.) (see section 5). Given that these breaks have been (partially) compensated by state subsidies to social security funds (Abramovici and Mathieu, 1999, p. 76), it is no wonder that the share of social contributions dropped.
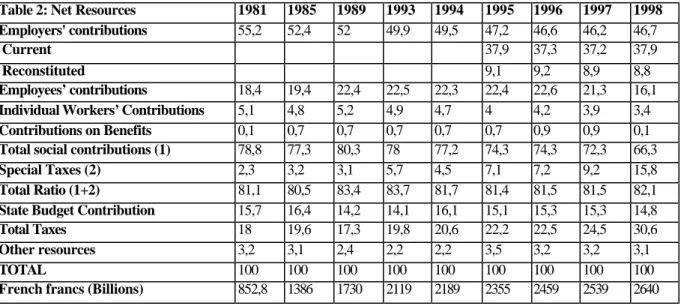
Table 2 displays the structure of contributions and other resources from 1981. Up to 1994, the share of social contributions roughly remained stable at a mean 78%. However this apparent stability hid a significant swap of employers’ with employees’ contributions. From 1994 on, the employers’ share was stabilised, but employees’ contributions were subsequently substituted for by the CSG24. Throughout the period under review, state budget (including other receipts) contributed at around 15%.
Table 2: Net Resources 1981 1985 1989 1993 1994 1995 1996 1997 1998
Employers' contributions 55,2 52,4 52 49,9 49,5 47,2 46,6 46,2 46,7
Current 37,9 37,3 37,2 37,9
Reconstituted 9,1 9,2 8,9 8,8
Employees’ contributions 18,4 19,4 22,4 22,5 22,3 22,4 22,6 21,3 16,1
Individual Workers’ Contributions 5,1 4,8 5,2 4,9 4,7 4 4,2 3,9 3,4
Contributions on Benefits 0,1 0,7 0,7 0,7 0,7 0,7 0,9 0,9 0,1
Total social contributions (1) 78,8 77,3 80,3 78 77,2 74,3 74,3 72,3 66,3
Special Taxes (2) 2,3 3,2 3,1 5,7 4,5 7,1 7,2 9,2 15,8
Total Ratio (1+2) 81,1 80,5 83,4 83,7 81,7 81,4 81,5 81,5 82,1
State Budget Contribution 15,7 16,4 14,2 14,1 16,1 15,1 15,3 15,3 14,8
Total Taxes 18 19,6 17,3 19,8 20,6 22,2 22,5 24,5 30,6
Other resources 3,2 3,1 2,4 2,2 2,2 3,5 3,2 3,2 3,1
TOTAL 100 100 100 100 100 100 100 100 100
French francs (Billions) 852,8 1386 1730 2119 2189 2355 2459 2539 2640
While substitution between employers’ and employees’ contributions still pertained to the Bismarckian rationale, the Beveridgean CSG emerges as the main effective innovation in the period under review. It was initially fixed in 1991 at 1.1% of all incomes and attributed to CNAF (Caisse Nationale des Allocations familiales) (Family benefits fund) for financing family benefits (it substituted for employers’ contributions reintegrated in gross wages). CSG rates subsequently regularly increased, first to 2.4% in 1993 (1.3 points going to a Fonds de Solidarité Vieillesse – FSV - for non-contributive pensions). In 1997 the CSG taxing base was enlarged and its rate fixed at 3.4%. Additional resources went to CNAM (Caisse Nationale d’Assurance Maladie), (the health care fund) compensating for a drop by 1.3 point on employees’ contributions. In 1998 the CSG rate more than doubled at 7.5% on wages and capital incomes, and at 6.4% on benefits. Additional resources again went to healthcare funds and balanced further drops in social contributions. Overall CSG now accounts for over 78% of all taxes affected to social security expenditure25.
24 Special taxes (on alcohol and tobacco, on insurance and pharmaceutical companies, etc.) were also transferred. 25 Respectively 56% of healthcare benefits (CNAM), 18% of solidaristic assistance (FSV), and 14% of family benefits (CNAF) (DREES, 1999, p. 8).
Analytically, CSG should be regarded as a typical hybrid resource combining both social insurance and tax. Inasmuch as it is generalised to all incomes, it undoubtedly bears the characteristics of a proportional tax, given that it is universal and was initially not deductible from taxable income26. However many of its characteristics make it distinct. CSG is strictly earmarked to finance benefits and it cannot be used for other destinations. Moreover CSG is collected along with social contributions by URSSAF. CSG thus emerges as an endogenous institutional innovation that alters the previous internal balance between Bismarckian and Beveridgean principles in favour of national instead of “professional” solidarity.
1 – 4. The social budget deficit
The “social security deficit” has constantly been a subject of controversy for the last 25 years in France. Indeed it provided a prevailing cognitive basis for political arguments and acted as a crucial justification for welfare reform27. When the deficit is important (figure 10), dominant actors tend to use it as an opportunity for reform in order to strengthen their position, as has been the case for instance in 1951-52, 1966-67, and more recently in 199528. Nevertheless, at a time when FSPS expansion was a matter of consensus, both the government and social partners opposed state budget contributions, which has provided an in-built arbitration mechanism of disputes. The government kept opposing state budget subventions for obvious financial reasons whilst the social partners would stick to the Bismarckian rationale of the system and their power positions. Arbitration generally followed a two-stage pattern: in the first, trade unions and business associations fought each other over employers’ and employees’ contributions. Whenever this first negotiation failed, the government would enforce new financing rules and trade one-off financing of the deficit with expenditure reduction. This picture is however oversimplified, because of the fragmentation of the system into multiple schemes and funds (régimes) and because of trade-unions division. Each régime has its specific history and power structure. Consequently significant differences arise in the forms of “démocratie sociale”, “paritarisme ” or “tripartisme” according to régimes, depending on social partners’ capacities (apRoberts and alii, 1997)29. Under state supervision the system’s cohesiveness is however organised through special
26 It is now mainly deductible. Under the CSG label coexist three distinct taxes (on wages and welfare benefits; on property earnings; on capital earnings). In 1995, 75.5 % of CSG came from wages taxation, 17,5 % from benefits and only 7 % from capital income (Le Figaro du 14/11/95), a structure that does not correspond to these incomes’ shares in the GDP.
27 Incidentally (figures 2 and 10) this deficit is in built. As total expenditure is only known of after annual accounts are established, corresponding resources cannot be fixed ex-ante. Which results in a permanent imbalance, either positive or negative. To balance actual expenditure, social contributions’ rates for the different funds and régimes as well as state subsidies have to be adjusted every year. Hence a recurring dispute between state administration and social partners on the basis of these accounts.
28 For instance in 1952, the Pinay government tried to transfer social contributions collection from social security to the Ministry of Finance administration, but was defeated and left office (Palier, 1999, p. 272). The same type of event happened to the Juppé Government in 1995-96.
29 Four different configurations of power contrast (i) state companies (régimes spéciaux for the railways, gas and electricity, the post, etc.); (ii) the régime général (mainstream fund for private sector employees); (iii) régimes
transfers30 between the different régimes, based both on national and “inter-professional” solidarity (Abramovici and Mathieu, 1999, p. 85-90).
During the first business cycle under review (1974-1983), things remained unchanged: social contributions kept increasing to match growing expenditures. The government nevertheless gradually stepped up its intervention in order to reduce healthcare expenditure’s growth (see section 3). During the second economic cycle (1984-1993) adjusting contributions to expenditure turned up very difficult, as the context had radically changed. In this period, trade unions as the weakest actors had to accept a gradual substitution of employees’ for employers’ contributions. So as to compensate for their weakness, they tried to abide strictly by Bismarckian social insurance and professional solidarity principles. Conversely they called for the state to contribute for national solidarity risks31. Accepting these transfers over to the state budget, the government staged a trade off in 1993. In exchange for taking charge of non-contributive pensions (minimum
vieillesse), trade unions tacitly approved the Balladur pension reform for the régime général (see
further). A new configuration emerged from 1994, and especially with the 1995 “Plan Juppé” (Dehove et Théret, 1996). Prime Minister Juppé forced the passing of his secretly conceived plan through Parliament while resisting all forms of negotiation with social partners32. His plan encompassed wide ranging reforms: privatisation of the national railway company (SNCF), an overall reform of social security financing, healthcare and public companies’ pensions schemes reform. A powerful popular movement subsequently paralysed the country for two months and defeated Juppé’s plan - at least partially. Both SNCF’s privatisation and the pension reform had to be cancelled. Essential elements of the reform nevertheless were retained (see section 3). Of particular interest with respect to the FSPS’ power structure were (i) the principle of an annual Parliament approval of a Social Security Bill33; (ii) the transfer of aggregated social security funds’ debt to a state run special fund, CADS (Caisse d’amortissement de la dette sociale). It was agreed that the debt would be financed via CRDS, a new contribution akin to CSG34. CRDS’s creation as well as a subsequent 1996 constitutional amendment allowing for Parliament’s competencies to be extended to social security matters, represent a significant shift of power over to the state, thus reinforcing the Beveridgean component of the French system.
All in all, France paradoxically emerges as the country where “welfare stateness” (Flora, 1986) is the lowest in Europe. Up to 1994 social contributions accounted for 80% of total social security resources. That social contributions have always been collected independently and have not fallen under the ministry of finance’s supervision, is also an indicator of weak stateness. In such a system, resources tend to be linked more to economic developments than to government’s financial decisions. However, as has already been mentioned, the situation of pensions and healthcare on one hand, and other welfare areas on the other, are structurally very different. For
30 See note on “demographic compensation”.
31 Those expenditures deemed to exceed the boundaries of professional solidarity were termed as “charges indues”, i.e. undue charges.
32 “ The location chosen for the presentation of the Plan was highly significant. Whilst all other previous “Plans de
redressement de la sécurité sociale ” were announced after meetings with trade unions, Alain Juppé reserved the
announcement of his plan to Parliament ” (Palier, 1999, p. 526).
33 This Bill was supposed to initiate a new era for legitimising decisions concerning social expenditure. Its purpose was to address: 1/ general orientations and purposes of social protection; 2/ tax resources; 3/ the securing of a provisional expenditure growth rate compatible with balanced accounts; 4/ criteria for quantitative targets between risks and regions (Palier, 1999, p. 527).
34 Its uniform rate (0.5%) applied to all incomes (save social minimum incomes, interests on popular savings bankbooks and some pensions).
pensions and healthcare (see section 3) which absorb a little over three quarters of the social budget political decisions have been pending. For the other areas (section 4 and 5), significant transformations have already been implemented. Globally, the challenges to the FSPS have been addressed very differently according to the three periods reviewed above.
***
(1) From 1975 to 1983, growth was more export-led and wages emerged less as a factor of internal demand than as a cost to be reduced. Nevertheless Fordist-Keynesian fiscal and monetary policies proved unable to control growing unemployment and high inflation. Along with high inflation came financing difficulties either through state budget or pay roll contributions. Fiscal and monetary tensions revealed the contradiction existing between Keynesian policies and internationalisation of the French economy. In 1983, President Mitterand eventually opted for the “franc fort” (strong franc) strategy and restrictive fiscal policies.
(2) The 1984-1993 period was one of “désinflation compétitive” (see previous note) abiding by the German Bundesbank rules. Allowing for persistent high unemployment and interest rates’ growth, these policies forbade any rise in resources whilst social needs kept increasing, because of long term unemployment and poverty. Hence successive retrenchment plans were implemented, that lowered social coverage and contributed to the emergence of “social exclusion”. In this period, welfare reforms responded to strict financial considerations. Major qualitative changes may also be ascribed to European Union developments, i.e. the single market and monetary union preparations. Indeed neo-liberal policies of deflation, deregulation and privatisation were directly submitted to the EMU political agenda (Jobert and Théret, 1994).
(3) 1994 initiates a new period where the new European monetary union framework is working. The economic context seems more favourable. Real interest rates have fallen and eased fiscal deficits and public debt constraints. Unemployment has started to drop seriously. Economic recovery is export-led and a positive trade balance helps interest rates decrease. From a political point of view, EMU completion has resulted in a new agenda where European institutions’ legitimacy is questioned (Quermonne, 1999). European citizenship and Social Europe are discussed as well (Maurice, 1999) and times are ripe for true European politics. But it is also time for a renewal of internal politics and structural reforms. These should less be dictated by purely financial reasons and take into account social protection’s forgotten sociological dimensions. The Juppé plan seems to have contributed to a return of political debate on welfare reform, involving collective actors and civil society. Two opposite agendas are currently competing: (i) a strict market-driven orientation in favour of convergence towards residual social protection in a Europe only conceived of as a free-trade zone; (ii) the promotion of EU as a new political and cultural entity with a specific continental social model - a mix of Bismarckian and social-democratic-Beveridgean traditions. The extent to which the European level of government will influence the future architecture of national systems obviously will be the outcome of national options towards either the residualist or social-democratic regimes.
However the challenges the French system is currently facing are obviously not only external and related either to the European Union building process or to globalisation. Internal challenges concerning unemployment and inactivity, poverty and inequalities, family and demographic transformations during the last two decades will be analysed in the next section, in order to understand the transformations described in sections 3 to 5.
Section 2 – Internal context: employment, poverty and demography
France has undergone a significant transformation of its employment and activity regime for the last twenty years so that is ranks to day as one of the European countries with relatively low employment rates. However this has to be analysed in terms of structures of activity, employment and unemployment that obviously influence the balance of a welfare regime still mainly funded through pay roll contributions. In terms of poverty, a problem often deemed to constitute one of the universal contemporary challenges France’s performance is intermediate in Europe. Its demography also demonstrates specific features.
2 - 1 – The French employment and activity regime
A "benchmarking" process for "labour market performances" has been gaining momentum for the last two years in the context of the European Employment Strategy. Politicians and statisticians now tend to prefer employment rates to unemployment ones as indicators of “labour market performance”. Benchmarking countries according to employment rates should however be seriously qualified because these rates reflect “societal” choices, choices of social justice and values (Barbier, 2000). Employment rates nevertheless tell part of the story in the context of national “employment and activity regimes” (Barbier and Gautié, 1998).
According to the Employment rates report, France appears as one of the intermediate member states (EU Commission, 1998), along with Germany and Belgium. It is intermediary between countries with high employment rates (the UK, the Netherlands and the Nordic countries) and countries with low rate (the southern member states, except Portugal). Table 3 illustrates the last decade’s developments, breaking figures according to age and gender.
Table 3 – Employment rates in France (1985-1997)
(age) 1985 1997 All 15-24 38.7 24.4 25-54 77.3 77.1 55-64 33.6 29.1 total 62.0 60.1 Men 15-24 43.3 27.1 25-54 91.6 86.5 55-64 42.1 33.2 total 73.9 67.7 Women 15-24 34.6 22.0 25-54 63.1 67.9 55-64 26.0 25.2 total 50.7 52.7
Source: EU, Employment report (1998)
Table 3 clearly illustrates one of France's labour market structural features, i.e. very low employment rates at both ends of the age spectrum (the young massively being in education and training and older workers commonly retiring early). One should not however jump to comparative conclusions from a mere analysis of such rates. A first qualification is that, when
adjusted to full time equivalents, the ranking of countries differ significantly. For instance, a 60.8% employment rate for France in 1998 is equivalent to 57.4% in full time equivalents (EU Commission, 1999). For the Netherlands, the drop from a 68.3 rate is 14 points to 54.0 when shifting to full time equivalents. For the UK, the rate drops from 71.4 to 60.9 in full time equivalents.
Despite their standardisation, employment indicators do not homogeneously capture all the significant features of the labour markets across Europe. For instance comparison only based on unemployment rates is flawed, because a “slack labour force” exists in most member states, i.e. a potential labour force of working age individuals, who are not considered economically active for various reasons (discouragement, participation in labour market schemes, eligibility to welfare benefits for the inactive, early retirement, underemployment, involuntary part time and so on). The clearest case in this realm is that of the disabled. In France, roughly 600.000 working age disabled workers presently claim welfare benefits35 of which an estimated 30% are active (Brygoo et al., 2000) so that there is no major “welfare-to-work” or “dependency” problem for this category of the population. The problem would rather be of discriminatory attitudes on the part of employers.
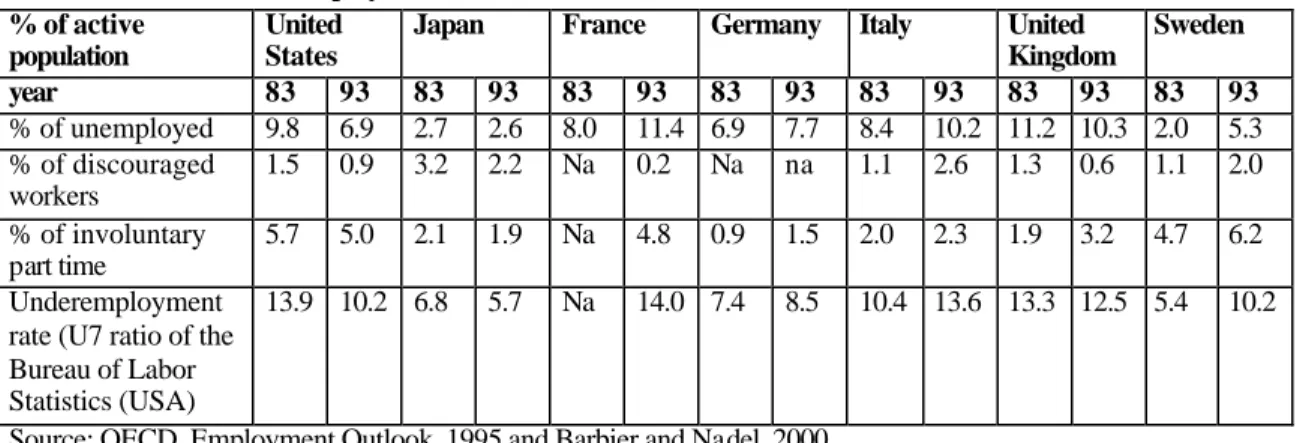
The subsequent table shows a comparative picture of underemployment in the European Union, according to US Bureau of Labour Statistics ratios. But, on the whole, underemployment might be roughly estimated as having varied from 10 to 25% of the potential active population in all countries, including those with apparently the best labour market performances36. All these data tend to put unemployment rates’ comparisons in a wider perspective37.
Table 4 - Underemployment indexes (1983-93) % of active
population
United States
Japan France Germany Italy United
Kingdom Sweden year 83 93 83 93 83 93 83 93 83 93 83 93 83 93 % of unemployed 9.8 6.9 2.7 2.6 8.0 11.4 6.9 7.7 8.4 10.2 11.2 10.3 2.0 5.3 % of discouraged workers 1.5 0.9 3.2 2.2 Na 0.2 Na na 1.1 2.6 1.3 0.6 1.1 2.0 % of involuntary part time 5.7 5.0 2.1 1.9 Na 4.8 0.9 1.5 2.0 2.3 1.9 3.2 4.7 6.2 Underemployment
rate (U7 ratio of the Bureau of Labor Statistics (USA)
13.9 10.2 6.8 5.7 Na 14.0 7.4 8.5 10.4 13.6 13.3 12.5 5.4 10.2
Source: OECD, Employment Outlook, 1995 and Barbier and Nadel, 2000
Another structural feature of the French employment regime is the persisting gap between male and female activity rates, which is nevertheless constantly decreasing. A higher unemployment rate for women, roughly 4 points higher than the male rate has also persisted for the last twenty years. The gap is about double for the young under 25.
In France, in the midst of the second period reviewed, the number of people in employment in 1990 was 22.32 millions and reached 22.43 millions in 1997 (the corresponding
35 AAH (allocation d'adulte handicapé) beneficiaries are currently about 800.000.
36 For instance, Denmark the current 2000 labour market “miracle” with an unemployment rate of 5% also has roughly 5% of its working age population in labour market programmes (Jorgensen, 2000).
37 It is particularly the case for the Netherlands, because of the combined outcome of a high prevalence of part-time, especially among women and a high percentage of the potential active population on permanent invalidity benefits (De Beer and Luttikhuizen, 1998).
figure was 21.25 in 1972). Adjustments on the French labour market for the last twenty years have been made through two channels: explicit unemployment on one hand, and participation in employment policies and insertion programmes38. The balance established by the ministry of labour clearly illustrates this dynamics (table 5).
Table 5– Unemployment, employment and labour market programmes (1972-96)
(thousands) 1972 1996 Variation 1 Total employment 21 253 22 321 + 1068 2 of which: subsidised 2 2065 + 2063 3 Non subsidised 21251 20256 - 995 4 Unemployment (ILO) 669 3248 + 2579 5 Early retirements (state funded) 93 850 + 757 6 Active population (1+4) 21922 25569 + 3647 7 Potentially active population
(6+5) 22015 26419 + 4404 8 Total of participants in government programmes (2+5) 95 2915 + 2820 Source: DARES, 1997 (PS 97.07, n° 27.1)
These overall transformations of the labour market for the last twenty years constitute a major factor of the French system. Whilst the French “welfare state” has not been rolled back, it certainly has undergone a major transformation via the emergence of “politiques d’insertion”, and employment policies, as we will see in section 5.
2-2. Poverty and inequality
France's contemporary relative performance in Europe in terms of poverty is intermediate between the Scandinavian and Northern countries where poverty is lower and the UK, Ireland and the southern countries, where poverty is higher (Paugam, 1999). Measured as a proportion of the population earning less than half the national mean income, the French poverty rate was 16% in 1993 (as against 9% for Denmark, 13% for Germany and 14% for the Netherlands). It was thus closer to European countries with lower rates than to the UK’s (23%) or Portugal’s (29%). A similar ranking is true for the proportion of the poor among the long-term unemployed (30% as against 64% in the UK but 7.5% in Denmark) (Paugam, 1999). Recent comparative Eurostat statistical series confirm this intermediate status among the Union's member states, when the proportion of low-income39 categories is considered (16%) (as against 11% in Denmark but 21% in Ireland and the UK). Eurostat calculates a Gini index of less than 0.30 for France, Belgium and Germany, as against more than 0.33 for the UK, Ireland and Spain (Eurostat, 1999).
However the structure of poverty varies significantly among European countries, which is of course very important when welfare reform is considered in comparative terms. For instance, Eurostat series show that single parents’ poverty is much less a problem in France where the risk
38 On the whole the working age inactive population remained stable from 1990 to 1996. This contrasts France for instance with the UK where adjustment happened not through unemployment but via inactivity (Employment Policy Institute, 1998).
39 Low income is here defined as less than 60% of the median national income. Data are available for 1995 from the European Households Panel.
of being poor for them is twice the risk for the rest of the population, as against five times higher in Britain and six times in Ireland. Structural differences across countries must also be stressed as to the composition of the poor category: 114 aged persons (over 65) belong to the poor in France as against 100 for the rest of the population (respectively 160 in the UK). Conversely the French young (16-24) have a higher probability of being poor: 185 are in this category as against 100 for the rest of the population (and 78 in the UK).
That poverty is not homogeneous across Europe is well documented and may be linked to national systems’ features. Two instances of this are the proportion of poor children and the proportion of "workless households". Testimony to a very worrying extension of poverty or deprivation situations in France has been the unprecedented increase in numbers of people eligible for benefits designed for various poverty situations (minima sociaux, cf. section 4). In 1970, 2.3 million households (accounting for 3 million people) claimed these benefits. Numbers started to rise sharply from 1990 and, in 1996, there were about 3.2 million households minimum income recipients40 (i.e. 6 million people, or 10% of the total population). Among these were 1,5 million children (Amrouni et Math, 1998).
A comparative study (Jeandidier et al., 2000) illustrates how differently the French and US welfare systems operate and how the French - as other continental systems - achieve better outcomes in alleviating poverty for children. In the French situation, 19% of children would be poor41 without family benefits and social assistance, whereas after these transfers, only 7% remained poor. In California and Pennsylvania, the corresponding figures were 34% and 25% before transfers. After transfers, 29% of Californian children remained poor as well as 21% in Pennsylvania. Such wide differences are explained by the family content of French social policy but also in terms of its expenditure levels42.
Similarly, workless households with children are more a problem in liberal welfare state regimes. As has been shown by The Economist (1999) drawing on OECD statistics, France and Germany have around 8% such households as against 20% in Britain and 15% in Ireland (more than 10% in the US, Australia and Canada).
More precisely, in the biggest EU member states the risks of being without employment were as follows in 1995 according to types of households:
Table 6 - Risk for households of being workless
Countries 1 adult no children 1 adult with children 2 adults no children 2 adults with children All households France 37.1 34.0 31.9 5.9 21.9 Germany 31.8 38.0 28.1 5.5 20.7 Italy 41.4 28.9 38.9 6.6 20.7 UK 35.8 60.8 21.5 10.7 21.6 Netherlands 35.6 55.1 23.7 5.7 19.7
Source: OECD, 1998 Employment Outlook
40 See further. Using (not strictly comparable) UK statistics shows that social problems differ between France and the UK. “Key benefits” there catered for 17% of the working age population in 1998. This was down from 20% in 1995 (See Bivand, 1999). Key benefits include Family Credit, Jobseeker’s Allowance, Incapacity Benefits and Income Support.
41 With an under 50% of the median income definition.
42 The study estimates that an "equivalent" to the French and Luxembourg policies reviewed, when applied in California, would expand social expenditure there fivefold.
Although all member states in the table above show a rather convergent mean rate, their structures differ widely. Single parent workless households are a majority only in Britain and the Netherlands, whereas France and all other considered countries have a rather convergent 6 points rate for workless households with two children (as against 10.7 for the UK).
What are the French system’s relative performances in terms of redistribution? Redistribution performances are complex to compare across countries. Traditionally the French system has been regarded as able to organise very little vertical redistribution (from the rich to the poor) and one of its outcome has even been counter-redistribution (Palier, 1999, p. 263-292). Nevertheless given the cancelling of ceilings for social contributions, it has turned out more neutral at the end of the periods under review. Some of the counterproductive effects are typically seen in the pension system (Lagarde et Worms, 19xx) because life expectancies between social groups diverge.
Analysing redistribution outcomes from the perspective of the three periods defined in section 1, the first one (1975-83) certainly appears as following the previous pattern (family benefits were raised in 1981 and tax policies favoured a reduction of income inequality). “Solidarity” was then substituted to equality, from 1984 on (Théret, 1991; Jobert et Théret, 1994). In the third period vertical redistribution has tended to return to the political agenda, as well as the reduction of regional imbalances. Arguments in favour of a more minimalist Beveridgean orientation with increased emphasis on targeting have also gained momentum in the public debate. Nevertheless, from a European perspective (Eurostat, 1999), and when pensions are excluded, France is among countries where income distribution before transfers is intermediate, and where income inequality decreases significantly after transfers. Income distribution in the four main countries is as follows:
Table 7: Redistribution in the European Union: France in perspective
Country
1995
Threshold (in SPA43)
Income before transfers Income after transfers
144 2 3 4 1 2 3 4 Germany 7433 24 31 24 21 18 32 26 24 France 7025 28 29 21 22 16 34 25 25 UK 6720 34 22 19 26 20 30 22 28 Italy 5232 21 31 21 26 19 31 23 27 UE 13 6352 26 29 21 24 18 32 24 26 Source: Eurostat, 1999
Only the UK and Ireland have more than a third of their population under the low-income threshold before transfers. Other member states have proportions ranging from 21 (Italy) to 30% (Belgium). After transfers, the UK and Ireland score more than 20% (Portugal being the leader with 24%) and the Netherlands and Denmark showing the best scores (with only 10% of their population under the 60% threshold). France and Luxembourg score best after them. Comparison of quintiles result in similar findings (Eurostat, 1999).
43 PPPS (purchasing power parity standards) are a conversion of national currencies; each unit corresponding to an identical quantity of goods and services in the different countries.
2-3. – Demographic trends
France’s population increase mainly results from natural increase, immigration having had a relatively low impact on total increase for the last 15 years. With 4.3 per thousand in 1999 (3.2 in 1995 as against 4.6 in 1985) France’s population growth ranks among the highest rates in the EU (with the Netherlands and Luxembourg) (Beaumel and al., 1999). It is estimated that it will keep increasing till 2020 (between 1990 and 1999, its annual increase has oscillated between around 190 to 250 thousands for a population which grew from 56.7 to 58.6 million45). This annual change entails a substantial yearly flow of new entrants on the labour market.
French fertility rates have decreased for the last twenty years as in other EU countries. However the French pattern resembles that of Sweden and is very different from other southern European countries (its birth rate - 13.4 per thousand in 1990 - decreased to 12.3 in 1994 but has since recovered to 12.7 for the last four years). Current fertility rates per women in France thus rank among the highest in Europe (at 1.7 in 1995, they remain similar to Bristish rates – 1.8). Although significantly lower than Canadian and US rates, French fertility rates are only outperformed in Europe by Ireland and Scandinavian countries (Beaumel and al., 1999). The French ranking has traditionally been ascribed –partially at least - to a specific set of family policies (see section 4), including measures allowing full time employment for mothers (mainly childcare benefits and services). This means that a “double earner” pattern for couples has settled in France for a longer time than it has in some other member states46.
French matrimonial behaviours have also changed significantly for the last 30 years. Divorce is more frequent (38% of 1995 marriages are expected to break down). The proportion of unmarried couples has also increased. The number of marriages has decreased by 32% since 1972, but marriage rates have recently increased again (4.9 per thousand in 1999 as against 4.4 from 1993 to 1995, but 7.8 in 1970). Marriages are concluded later in life and nearly 40% of children are now born out of wedlock (6.8% in 1970 and 19.6% in 1985). The prevalence of single parenthood is however rather lower than in many European countries. Around 14% of all families with children47 are single parents families (84% of these are single women), a proportion close to Germany’s or Finland’s but significantly lower than the UK’s (23%). Moreover, contrary to many other EU members, lone parents in France have traditionally been economically active (more than 70% of lone mothers were active in 1996). Of the single parents with two children, 86% were active at the same date as against 49% in the UK or 56% in the Netherlands. On top of this, their activity pattern has been dominantly full time (only one third presently have a part time job). For this reason the “single parent question” has not been so crucial in social policy as it has in some other countries; again this may be ascribed to the traditional French family policy where,
globally, economic inactivity has not been encouraged48. 17% of young adults (25-29) are living with their parents in France like in the UK (as against 56% in Italy, 24% in Belgium, 34% in Ireland, more than 50 in Greece, Spain and Portugal)49.
45 Excluding overseas territories (Kerjosse, 2000).
46 Unfortunately strictly comparable data still lack on the subject. Majnoni d’Intignano (1999, p. 19) notes that only 17% of 14.4 million economically active households are couples with inactive women.
47 1.7 million families in 1999 as against 1.4 in 1990.
48 Notwithstanding some cases were, especially in the second period under review, women’s inactivity was obliquely encouraged, for instance through “allocation parentale d’éducation” (see further).