HAL Id: hal-00820959
https://hal.inria.fr/hal-00820959
Submitted on 7 May 2013
HAL is a multi-disciplinary open access
archive for the deposit and dissemination of
sci-entific research documents, whether they are
pub-lished or not. The documents may come from
teaching and research institutions in France or
abroad, or from public or private research centers.
L’archive ouverte pluridisciplinaire HAL, est
destinée au dépôt et à la diffusion de documents
scientifiques de niveau recherche, publiés ou non,
émanant des établissements d’enseignement et de
recherche français ou étrangers, des laboratoires
publics ou privés.
Snapshot Provisioning of Cloud Application Stacks to
Face Traffic Surges
Daniel Pewo Fouomene, Romain Rouvoy, Lionel Seinturier
To cite this version:
Daniel Pewo Fouomene, Romain Rouvoy, Lionel Seinturier. Snapshot Provisioning of Cloud
Applica-tion Stacks to Face Traffic Surges. [Research Report] RR-8299, INRIA. 2013, pp.17. �hal-00820959�
0249-6399 ISRN INRIA/RR--8299--FR+ENG
RESEARCH
REPORT
N° 8299
May 2013Daniel Fouomene Pewo
1,2, Romain Rouvoy
1,2, Lionel Seinturier
1,2,31
INRIA Lille – Nord Europe, Project-team ADAM
2University Lille 1 - LIFL CNRS UMR 8022, France
3Institut Universitaire de France
RESEARCH CENTRE LILLE – NORD EUROPE
Parc scientifique de la Haute-Borne
Project-Team Adam
Research Report n° 8299 — May 2013 — 17 pages
Abstract: Traffic surges, like the Slashdot effect, occur when a web application is overloaded by a huge number of requests, potentially leading to unavailability. Unfortunately, such traffic variations are generally totally unplanned, of great amplitude, within a very short period, and a variable delay to return to a normal regime. In this report, we introduce PeakForecast as an elastic middleware solution to detect and absorb a traffic surge. In particular, PeakForecast can, from a trace of queries received in the last seconds, minutes or hours, to detect if the underlying system is facing a traffic surge or not, and then estimate the future traffic using a forecast model with an acceptable precision, thereby calculating the number of resources required to absorb the remaining traffic to come. We validate our solution by experimental results demonstrating that it can provide instantaneous elasticity of resources for traffic surges observed on the Japanese version of Wikipedia during the Fukushima Daiichi nuclear disaster in March 2011.
Approvisionnement de piles logicielles pour les
applications dans les nuages informatiques pour
faire face aux pics de trafic
Résumé : Les pics de trafic, tels que l’effet Slashdot, apparaissent lorsqu’une application web doit faire face un nombre important de requêtes qui peut poten-tiellement entraîner une mise hors service de l’application. Malheureusement, de telles variations de traffic sont en général totalement imprévues et d’une grande amplitude, arrivent pendant une très courte période de temps et le retour à un régime normal prend un délai variable. Dans ce rapport, nous présentons Peak-Forecast qui est une solution intergicielle élastique pour détecter et absorber les pics de trafic. En particulier, PeakForecast peut, à partir des traces de requêtes reçues dans les dernières secondes, minutes ou heures, détecter si le système sous-jacent fait face ou non à un pic de trafic, estimer le trafic futur en utilisant un modèle de prédiction suffisamment précis, et calculer le nombre de ressources nécessaires à l’absorption du trafic restant à venir. Nous validons notre solution avec des résultats expérimentaux qui démontrent qu’elle fournit une élasticité instantanée des ressources pour des pics de trafic qui ont été observés sur la ver-sion japonaise de Wikipedia lors de l’accident nucléaire de Fukushima Daiichi en mars 2011.
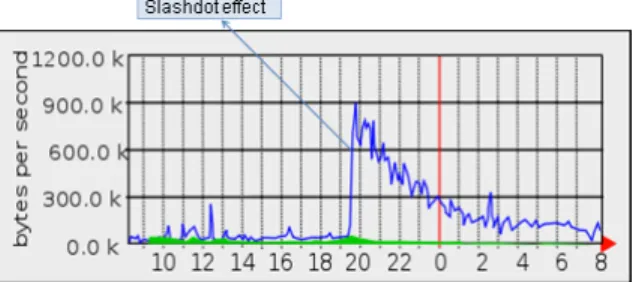
Figure 1: Graph from some Web server statistics showing a moderate Slashdot effect in action in 2005.
1
Introduction
Traffic surges, like the Slashdot effect, occur when a web application is over-loaded by a huge number of requests, potentially leading to unavailability. Un-fortunately, such traffic variations are generally totally unplanned, of great am-plitude, within a very short period, and a variable delay to return to a normal regime, as illustrated in Figure 11.
A Slashdot effect is characterized by a sudden rise of traffic occurring when a site attracting many Internet users publishes a link for its visitors to a less known or smaller site that will barely be able to take into account this peak audience and that will cause it to slow down its functioning or even to become temporarily unavailable. This phenomenon has been observed when the Slashdot2site,
well-known in the Linux community, publishes articles with links referring to more marginal sites. This is the origin of the term Slashdot effect. This has a major impact on communications because the saturation of the site can saturate the server and deprive all users from the possibility to communicate with the site. Moreover, with the generalization of broadband access, many users join the Internet through mobile devices and computers, which suggest an increase in the frequency of the Slashdot effects and more generally in traffic surges. In this context, it is legitimate to ask the following questions: from the history of the number of requests received in the last seconds / minutes / hours, how to detect if we are facing a traffic surge, and how to predict the upcoming traffic?
In order to address this challenge, we propose an elastic IaaS management solution, that can (i) detect traffic surges in less than 60 seconds, (ii) predict the upcoming traffic using a forecasting model with an acceptable precision, and (iii) estimate the number of resources needed to absorb this traffic surge, by adding or removing, quickly and automatically, resources within a virtual infrastructure.
The remainder of this paper is organized as follows. We present a case study (see Section 2) and our contribution, PeakForecast, by describing its various components (see Section 3) and then validate with experimental results (see
1http://en.wikipedia.org/wiki/Slashdot_effect 2
4 Daniel Fouomene Pewo1,2, Romain Rouvoy1,2, Lionel Seinturier1,2,3 1INRIA Lille – Nord Europe, Project-team ADAM 2University Lille 1 - LIFL CNRS UMR 8022, France 3Institut Universitaire de France
Section 4). Finally, we discuss related work (see Section 5) in this domain before concluding (see Section 6).
2
Case study
Figure 2 depicts the traffic traces that were collected on the Japanese version of Wikipedia, days before and after the tsunami on 11 March 2011. We can observe that between 12:49 and 12:50 a traffic surge occurred. In this case, how to detect if we are facing a traffic surge caused by a Slashdot effect or not, and predict the upcoming traffic?
Figure 2: Graph of requests by minute interval of 10-03-2011
2.1
Detecting the traffic surges
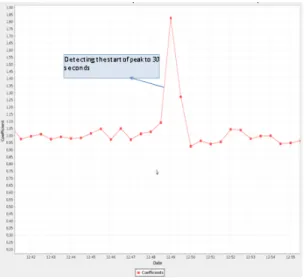
Detecting a traffic surge requires to monitor the number of incoming requests within a period of a reasonable length in order to get enough confidence in the actual occurrence of such an event. To detect the nearest second, we collect the number of requests per interval of 30 seconds (see Figure 3).
Figure 3: Graph of requests by intervals of 30 seconds on 10-03-2011
Then, we plot the curve of variations multiplier coefficients between two intervals of 30 seconds (Figure 4).
Figure 4: Graph of the multiplier coefficient between two intervals of 30 seconds on 10 March 2011
Where the multiplier coefficient is:
Coef = N umber of requests at Tn+1 N umber of requests at Tn
6 Daniel Fouomene Pewo1,2, Romain Rouvoy1,2, Lionel Seinturier1,2,3 1INRIA Lille – Nord Europe, Project-team ADAM 2University Lille 1 - LIFL CNRS UMR 8022, France 3Institut Universitaire de France
T, the curve is more than tenfold. This multiplier coefficient thus allows us to detect the start of the peak, in this case 30 seconds.
2.2
Forecasting traffic surge coming from the Slashdot
Ef-fect
After detecting the traffic surge, we need to predict the upcoming traffic. To do this, we consider the prediction method simple exponential smoothing for time series. The simple exponential smoothing model is one of the most popular forecasting methods. Its principle is to give more importance to recent obser-vations. It is more reactive than moving averages or regression models because it takes into account a rapidly changing trend. It is a method of forecasting t + 1. It does not extend a series, unlike a simple regression, but seeks to obtain a smoothed value for t refers simply t + 1. The forecasting formula is the basic equation:
ˆ
yi+1= αyi+ (1 − α)ˆyi , 0 < α < 1, i > 0 (1)
Where yi is the actual known series value for time period i, ˆyi is the forecast
value of the variable Y for time period i, ˆyi+1 is the forecast value for time
period i + 1 and α is the smoothing constant. (1) can be written as:
ˆ
yi+1= ˆyi+ αei (2)
where residual ei = yi− ˆyi is forecast error for time period i. We choose α
minimizing P e2
i. This model is described comprehensively in [1].
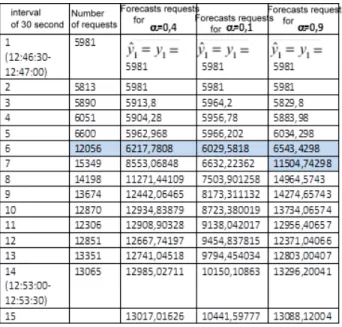
We have applied the simple exponential smoothing method on the number of requests in a time interval containing the traffic surge (see Table 1).
Table 1: Values of the number of requests per interval of 30 seconds on 10-03-2011 between 12:46:30 and 12:53:30
Due to the recurring formula of simple exponential smoothing, we must choose a value from which forecasts can be made. This value is of little im-portance if the series is long. It often takes the average of the two or three first observations but this choice is arbitrary. In our case (see Table 1), we chose the first observation, i.e. the number of requests for the interval #1 (5,981). Concerning the choice of the smoothing constant α, which directly affects the results, no direct mathematical method gives its optimum value. For this, it is obviously necessary to rely on data stored and therefore in our case (see Table 1), based on request history. Thus, we have chosen three values of α, 0.4, 0.1 and 0.9, and then calculated prediction using the formula forecasts recurring simple exponential smoothing. By summing the differences between predicted and real number of requests per interval of 30 seconds (first column), squared for each smoothing constant, we note that the one that minimizes this sum is α= 0.9. Therefore the smoothing constant gives estimates with an acceptable precision when it is α = 0.9. This can be confirmed in Figure 5.
8 Daniel Fouomene Pewo1,2, Romain Rouvoy1,2, Lionel Seinturier1,2,3 1INRIA Lille – Nord Europe, Project-team ADAM 2University Lille 1 - LIFL CNRS UMR 8022, France 3Institut Universitaire de France
Figure 5: Graph of requests by intervals 30 seconds on 10–03–2011 between 12:46:30 and 12:53:30
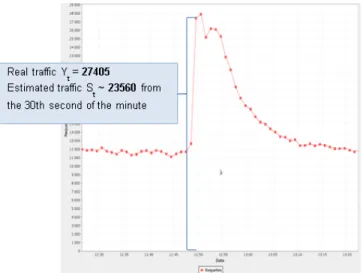
With this value of 0.9, the constant smoothing, when we detect that we face a traffic surge at the interval #6 (see Table 1), it predicts 11,504 upcoming requests during the next period (see Table 1). Adding this estimated traffic to previous requests, we obtain a forecasted traffic of 23,560 requests from the 30th
second of the minute marking the traffic surge, as shown in Figure 6.
Figure 6: Graph of requests per minute on 10-03-2011
This prediction is close to the peak of real traffic, which reached 27,405 requests per minute (adding the interval number 6 and 7 of Table 1), with an average of 457 requests per second.
taking into account their deployment time. In particular, we use the following formula where the number of virtual machines to deploy N is estimated as:
N = St− Yt X
Where St is the estimated value of the traffic at time t, Yt is the value of the
traffic at time t, X is the number of requests that can support a virtual machine, about 600 requests per second in our case (estimation based on benchmarks).
3
Contribution
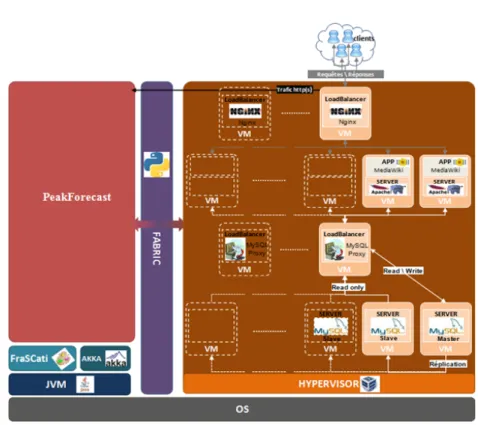
In a virtual infrastructure (see Figure 7), PeakForecast is the solution we have developed to automatically respond to scalability issues not only by adding resources to absorb traffic surges, but also to release resources when the load decreases. Adding more resources mainly concerns instances of virtual machines (VMs) hosting the presentation layer and the business logic tier of the website, because they are usually the bottleneck caused by traffic surges. After adding its instances of VMs, the load balancer (NGINX3) is responsible for the load
balancing. Finally, FABRIC4 is a Python library and command–line tool for
streamlining the use of SSH for application deployment or systems administra-tion tasks.
3http://wiki.nginx.org 4
10 Daniel Fouomene Pewo1,2, Romain Rouvoy1,2, Lionel Seinturier1,2,3 1INRIA Lille – Nord Europe, Project-team ADAM 2University Lille 1 - LIFL CNRS UMR 8022, France 3Institut Universitaire de France
Figure 7: Virtual Web Infrastructure
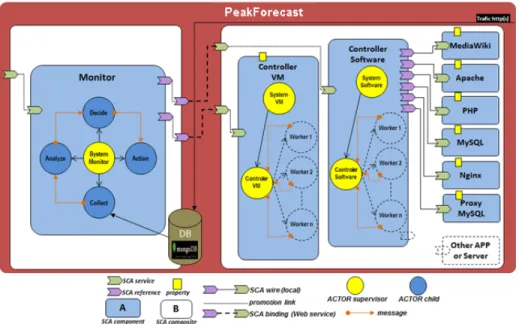
In this section, we provide a detailed overview of our tool PeakForecast in vir-tual web infrastructure (see Figure 7). PeakForecast is an SCA distributed sys-tem (see Figure 8). The Service Component Architecture (SCA) standard is a set of specifications for building distributed application based on Service–Oriented Architectures(SOA) and Component–Based Software Engineering (CBSE) prin-ciples [2]. As illustrated in Figure 8, in SCA the basic construction blocks are software components, which have services (or provided interfaces), references (or required interfaces) and expose properties. The references and services are connected by means of wires. SCA specifies a hierarchical component model, which means that components can be implemented either by primitive lan-guage entities or by subcomponents. In the latter case the components are called composites. Both component references and services can be exposed at the composite level by means of promotion links. SCA is designed to be in-dependent from programming languages, interface definition languages (IDL), communication protocols, and non–functional properties. We use the FraSCAti5
[3] middleware platform, which enables the development and the execution of distributed SOA applications based on SCA. Beyond the support of standard SCA features, FRASCATI brings reflection to SCA—i.e., introspection and re-configuration capabilities, via a specialization of the Fractal component model
5
http://frascati.ow2.org
ory footprint; 2.7 million actors per GB of heap. As illustrated in Figure 8, PeakForecast is composed of two SCA composites:
• The first composite exposes a web service to manipulate and perform op-erations on VMs of the virtual web infrastructure (see Fig.7). It contains two essential components "ControllerSoftware" and "ControllerVM ". The component "ControllerSoftware" provides, services such as install, unin-stall, status, reconfigure, stop, start, restart a component representing a server or an application on one or more VMs. In case the service must be running on multiple VMs, execution is performed by actors "Worker n" operating in parallel and coordinated by the supervisor actor "Con-trollerSoftware". The component "ControllerVM " meanwhile, provides services, such as start, restart, pause, resume, clone, create, delete one or more VMs. Similarly, in case the service must be running for multiple VMs, the execution is performed by the actors "Worker n" operating in parallel and coordinated by the supervisor actor "ControllerVM ". • The second composite allows PeakForecast to monitor HTTP traffic,
de-tecting traffic surges and reacting accordingly by consuming the services provided by the first composite. It contains a single component "Monitor". The component "Monitor" is mainly composed of four actors: "Collect", "Analyse", "Decide", "Action", communicating with each others by ex-changing messages. The actor "Collect" collects traffic information per time interval, for example the number of requests per second, 15 seconds, 30 seconds, or minute. The number of requests collected by the actor "Collect" are sent as a message to the actor "Analyse". The actor "Anal-yse" analyzes the number of requests to detect when we are facing a traffic surge (see section 2.1), or prediction gives an estimate of upcoming traffic (see section 2.2). It is within this actor that we have implemented the recurrent formula simple exponential smoothing. With this prediction of the traffic, it estimates the number of VMs to absorb traffic surge (see section 2.3). The actor "Analyse" sends the number of VMs as a message to the actor "Decide". Based on a user profile, the latency of VMs in use, the actor "Decide" determines the exact number of VM instances to deploy in order to absorb the traffic surge, and then sends this number to actor "Action", which takes care of making available the requested VM
6
12 Daniel Fouomene Pewo1,2, Romain Rouvoy1,2, Lionel Seinturier1,2,3 1INRIA Lille – Nord Europe, Project-team ADAM 2University Lille 1 - LIFL CNRS UMR 8022, France 3Institut Universitaire de France
instances, allowing the virtual web infrastructure to anticipate the traffic surge ahead.
Figure 8: PeakForecast architecture
4
Validation
As a matter of validation, the virtual web infrastructure (see Figure 7) has been developed. The physical machine uses Virtual Box as an hypervisor and has the following characteristics: Dual Core CPU 2.50GHz, RAM 2000 MB and for each virtual machine (VM): CPU 1 GHz, RAM 500 MB.
In this virtual web infrastructure, a VM front–end hosts the load balancer NGINX responsible for distributing incoming HTTP requests among the VMs hosting the MediaWiki website (the business logic tier of the website). While another VM contains the MYSQL load balancer responsible for distributing SQL queries to the VMs hosting the database (the data layer of the website). As illustrated in Figure 7, MYSQL Proxy redirects read SQL queries to MYSQL server master and slaves, while write queries are processed by the MYSQL server master before forwarding the master replica to slaves.
For the purpose of this validation, adding additional resources mainly con-cerns instances of VMs containing MediaWiki, because they are considered as the bottleneck in traffic surges. To perform our benchmark, we use the tool SIEGE7. It can stress test a single URL with a user–defined number of
simu-7
http://manpages.ubuntu.com/manpages/hardy/man1/siege.1.html
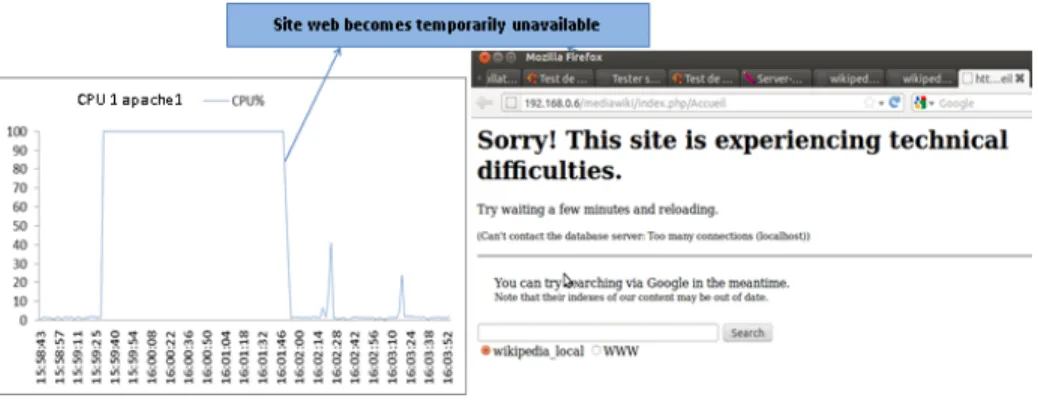
For the first test without PeakForecast: we have a single VM (apache1) containing MediaWiki and thus treating all HTTP requests sent by the NGINX load balancer. After some minutes, the web site becomes over-loaded and causing it to slow down or even temporarily becomes unavail-able, as illustrated in Figure 9.
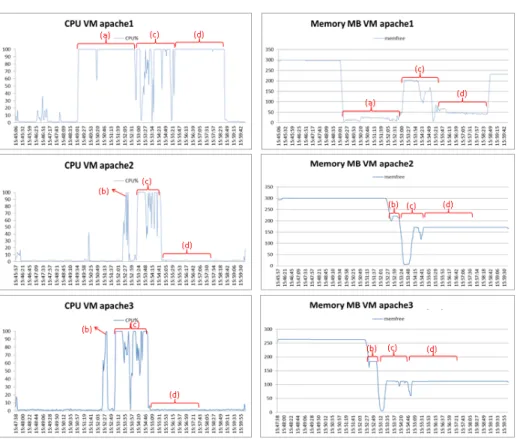
For the second test with PeakForecast: In Figure 10(a), we also have a single VM (apache1) containing MediaWiki and thus serving all HTTP requests sent by NGINX load balancer. After a few minutes, PeakFore-cast detects that we are facing a traffic surge, predicates the future traffic, estimates the number of VMs required to absorb the traffic surge (2 VMs: apache 2 & 3) and starts the process of provisioning these VMs. In Fig-ure 10(b), PeakForecast installs MediaWiki on VMs apache 2 & 3 (in approximately 10 seconds), then add the VMs in the configuration file of the NGINX load balancer to make them visible to NGINX. Figure 10(c) reports treatments, such as requests sent by VMs apache 2 & 3, which ex-plains the evolution of CPU and RAM in VM apache 1. In Figure 10(d), PeakForecast removes the VMs apache 2 & 3 after the traffic surge has been absorbed.
14 Daniel Fouomene Pewo1,2, Romain Rouvoy1,2, Lionel Seinturier1,2,3 1INRIA Lille – Nord Europe, Project-team ADAM 2University Lille 1 - LIFL CNRS UMR 8022, France 3Institut Universitaire de France
Figure 10: Benchmark 2 with PeakForecast
5
Related work
There is a lot of prior work that deals with dynamic capacity management [5]. These works can be classified into reactive [6, 7, 8], predictive [9, 10] and mixed [13, 12, 11] approaches. While these approaches can handle gradual changes in load, they cannot handle abrupt changes, especially load spikes that occur almost instantaneously [5]. This claim was also verified by other authors [14].
In order to handle traffic surges, the authors advocate either having spare servers that are always available (over–provisioning), or finding a way to lower setup times. This is the case in [5], which considers that the architecture of the datacenter includes a tier "caching" consisting of machines that are always available. They then temporarily use the resources of these machines to respond to requests as long as new servers are deployed in the tier application. The elastic part is limited to the tier application which is the tier largest consumer of CPU resources. If the load is high, [5] needs of being coupled with techniques like those in [15, 16, 17, 18] to minimize the damage caused by load spikes. However, by using PeakForecast, we do not have to pay for any additional resources, which is not the case when over–provisioning via spare servers. Furthermore,
tier application services that allocate and release resources in discrete units, such as virtual server instances of pre–determined sizes. It focuses on elastic control of the storage tier, in which adding or removing a storage node or "brick" requires rebalancing stored data across the nodes, and are not the focus of our paper.
6
Conclusion
In this paper, we have presented an elastic IaaS management solution capable named PeakForecast. From a trace of requests received in the last seconds, minutes or hours, PeakForecast detects if the underlying system is facing a traffic surge or not, and then predicts the upcoming traffic using a forecast model with an acceptable precision, thereby estimating the number of resources required to absorb the remaining traffic to come. We have evaluated our solution using MediaWiki and web application traffic traces that were collected on the Japanese version of Wikipedia some days before and after the tsunami on 11 March 2011, in an interval where the Slashdot effect PeakForecast. The experimental results confirm that our solution can provide instantaneous elasticity of resources during traffic surges.
References
[1] Brown, R. G., Meyer, R. F.: The fundamental theory of exponential smoothing, Operations Research, 9, 1961, p. 673–685
[2] P. Merle, R. Rouvoy, L. Seinturier.: A Reflective Platform for Highly Adap-tive Multi–Cloud Systems, 10th International Workshop on AdapAdap-tive and Reflective Middleware (ARM’2011) at the12th ACM/IFIP/USENIX Inter-national Middleware Conference (2011) 1–7
[3] L. Seinturier, P. Merle, R. Rouvoy, D. Romero, V. Schiavoni, and J.– B. Stefani: A Component–Based Middleware Platform for Reconfigurable Service-Oriented Architectures, Software, Practice and Experience (SPE), 2011.
[4] E. Bruneton, T. Coupaye, M. Leclercq, V. Quéma, and J.–B. Stefani: The Fractal Component Model and its Support in Java, Software Practice and Experience (SPE), 36(11–12):1257—1284, 2006.
16 Daniel Fouomene Pewo1,2, Romain Rouvoy1,2, Lionel Seinturier1,2,3 1INRIA Lille – Nord Europe, Project-team ADAM 2University Lille 1 - LIFL CNRS UMR 8022, France 3Institut Universitaire de France
[5] Anshul Gandhi, Timothy Zhu, Mor Harchol–Balter, Michael A. Kozuch: SOFTScale: Stealing Opportunistically for Transient Scaling, Middleware 2012: 142–163
[6] Julius C.B. Leite, Dara M. Kusic, and Daniel Mossé: Stochastic approxi-mation control of power and tardiness in a three–tier web–hosting cluster, In ICAC 2010, Washington, DC, USA.
[7] Ripal Nathuji, Aman Kansal, and Alireza Ghaffarkhah.: Q–clouds: Manag-ing performance interference effects for qos-aware clouds, In EuroSys 2010, Paris, France.
[8] Pradeep Padala, Kai–Yuan Hou, Kang G. Shin, Xiaoyun Zhu, Mustafa Uysal, Zhikui Wang, Sharad Singhal, and Arif Merchant: Automated con-trol of multiple virtualized resources,In EuroSys 2009, Nuremberg, Ger-many.
[9] Andrew Krioukov, Prashanth Mohan, Sara Alspaugh, Laura Keys, David Culler, and Randy Katz. Napsac: Design and implementation of a power-proportional web cluster, In Green Networking 2010, New Delhi, India. [10] Tibor Horvath and Kevin Skadron: Multi-mode energy management for
multi-tier server clusters, In PACT 2008, Toronto, ON, Canada.
[11] Anshul Gandhi, Yuan Chen, Daniel Gmach, Martin Arlitt, and Manish Marwah: Minimizing data center sla violations and power consumption via hybrid resource provisioning, In IGCC 2011, Orlando, FL, USA.
[12] Daniel Gmach, Stefan Krompass, Andreas Scholz, Martin Wimmer, and Alfons Kemper: Adaptive quality of service management for enterprise services, ACMTrans. Web, 2(1):1—46, 2008.
[13] Bhuvan Urgaonkar and Abhishek Chandra: Dynamic provisioning of multi– tier internet applications, In ICAC 2005, Washington, DC, USA.
[14] Abhishek Chandra and Prashant Shenoy: Effectiveness of dynamic resource allocation for handling internet flash crowds, Technical Report TR03–37, Department of Computer Science, University of Massachusetts at Amherst, November 2003.
[15] Bhuvan Urgaonkar and Prashant Shenoy: Cataclysm: Scalable overload policing for internet applications, Journal of Network and Computer Ap-plications, 31(4):891 – 920, 2008.
[16] Atul Adya, William J. Bolosky, Ronnie Chaiken, John R. Douceur, Jon Howell, and Jacob Lorch: Load management in a large-scale decentralized file system, MSR-TR, 2004–60, July 2004.
[17] Thiemo Voigt, Renu Tewari, Douglas Freimuth, and Ashish Mehra: Ker-nel mechanisms for service differentiation in overloaded web servers. In USENIX ATC 2001, Boston, MA, USA.
An approach to handling unexpected workload surges with resource ac-tions that have lead times, In DSOM 2003, Heidelberg, Germany
[20] H. C. Lim, S. Babu, and J. S. Chase: Automated control for elastic storage, in ICAC10. New York,NY, USA: ACM, 2010, pp. 19—24.
[21] Beth Trushkowsky, Peter Bodik, Armando Fox, Michael J. Franklin, Michael I. Jordan, and David A. Patterson: The scads director: scaling a distributed storage system under stringent performance requirements, In FAST 2011, San Jose, CA, USA.
RESEARCH CENTRE LILLE – NORD EUROPE
Parc scientifique de la Haute-Borne 40 avenue Halley - Bât A - Park Plaza 59650 Villeneuve d’Ascq
Publisher Inria
Domaine de Voluceau - Rocquencourt BP 105 - 78153 Le Chesnay Cedex inria.fr