Université de Montréal
A study of chymotrypsin immobilization conditions
for improved peptide mapping
Fatma Omar Elshalale
Département de chimie
Faculté des Arts et Sciences
Mémoire présenté à la Faculté des études supérieures et postdoctorales
en vue de l’obtention du grade de Maître ès science (M.Sc.)
en Chimie
March, 2014
Résumé
La cartographie peptidique est une technique de grande importance utilisée lors de l’identification des protéines et la caractérisation des modifications post-traductionnelles des protéines. Deux méthodes sont utilisées afin de couper les protéines en peptides pour la cartographie : les méthodes chimiques et les méthodes enzymatiques. Dans ce projet, l’enzyme chymotrypsine a été utilisée pour l’hydrolyse (la digestion) des liens peptidiques. Cependant, l’autoprotéolyse des enzymes peut augmenter la complexité des échantillons, rendant ainsi ardue l’obtention de pics résolus suite à l’apparition de pics non-désirés dans la carte peptidique. Par conséquent, nous avons utilisé la réticulation des enzymes protéolytiques par réaction avec le glutaraldéhyde (GA) donnant une enzyme insoluble afin de réduire l’autoprotéolyse. L’immobilisation de la chymotrypsine par GA a été effectuée selon une méthode rapportée précédemment par le groupe Waldron. L’électrophorèse capillaire (CE) couplée à l’absorption UV-visible a été utilisée pour la séparation et la détection de peptides et pour obtenir ainsi une cartographie peptidique.
Deux tampons différents ont été évalués afin d’obtenir les meilleures conditions pour la digestion de substrats protéiques par la chymotrypsine libre (soluble) ou la GA-chymotrypsine et l’analyse par CE. Les cartes des peptides autoprotéolytiques ont été comparées entre les deux formats de chymotrypsine. Afin d’améliorer la cartographie peptidique, nous avons évalué trois méthodes de conditionnement du capillaire CE et deux méthodes pour stopper la digestion. Le bicarbonate d’ammonium s’est avéré être le tampon optimal pour la digestion en solution et l’utilisation d’un bain d’acétone et de glace sèche s’est avérée être la méthode optimale pour stopper la digestion. Une solution de SDS, 25 mM, dans l’étape de rinçage a été utilisée après chaque analyse CE et a permis d’améliorer la résolution des cartes peptidiques. La comparaison entre l’autoprotéolyse de la chymotrypsine libre et de celle immobilisé par GA a été effectuée par des tests utilisant une gamme de six différentes combinaisons de conditions afin d’évaluer le temps (30 et 240 min) et la température de digestion (4, 24 et 37°C). Dans ces conditions, nos résultats ont confirmé que le GA-chymotrypsine réduit l’autoprotéolyse par rapport à l’enzyme libre.
La digestion (à 37°C/240 min) de deux substrats modèles par la chymotrypsine libre et immobilisée en fonction de la température de dénaturation du substrat a été étudiée. Avant
la digestion, les substrats (l’albumine de sérum bovine, BSA, et la myoglobine) ont été dénaturés par chauffage pendant 45 min à trois températures différentes (60, 75 et 90°C). Les résultats ont démontré que la dénaturation par chauffage du BSA et de la myoglobine n’a pas amélioré la cartographie peptidique pour la GA-chymotrypsine, tandis que la digestion de ceux-ci en présence de la chymotrypsine libre a amélioré de façon quantifiable à des températures élevées. Ainsi, le chauffage du substrat à 90°C avec l’enzyme soluble facilite le dépliement partiel du substrat et sa digestion limitée, ce qui a été mieux pour la myoglobine que pour la BSA.
Mots-clés : Cartographie peptidique / Réticulation / Glutaraldéhyde / Chymotrypsine / Électrophorèse capillaire
Abstract
Peptide mapping is an important technique used in conjunction with other methods to identify proteins and characterize post-translational modifications. To cleave proteins into small peptides for mapping, chemical and/or enzymatic methods are used. In the present study, the enzyme chymotrypsin was used for hydrolysis (digestion) of peptide bonds. A drawback of using soluble enzyme is autoproteolysis, the formation of peptides coming from chymotrypsin, giving unwanted peaks in the peptide map of the protein substrate. Therefore, making chymotrypsin immobile by cross-linking it with glutaraldehyde (GA) to avoid unwanted autoproteolysis peaks has been used in the present work. GA cross-linking for enzyme immobilization was carried out based on a method described previously in the Waldron group. Capillary electrophoresis (CE) was used for separation of the peptides (i.e., peptide mapping) as a way to evaluate digestion efficiency of soluble versus immobilized chymotrypsin.
To investigate the best conditions for digestion of protein substrate by free (soluble) versus GA-cross-linked chymotrypsin prior to analysis by CE, two different buffers were evaluated (ammonium bicarbonate and Tris-HCl). The maps of autoproteolysis peptides were compared between the two chymotrypsin formats. To improve the peptide maps obtained by CE, again using autoproteolysis of chymotrypsin without substrate present, three methods for capillary conditioning and two methods for terminating the digestion were investigated. Ammonium bicarbonate was found to be the best digestion buffer and a dry ice/acetone bath was the best method for stopping the digestion, with both of these giving better CE-based peptide maps. Adding 25 mM SDS in the post-conditioning capillary rinse was demonstrated to further improve peptide mapping. The autoproteolysis of soluble and GA-chymotrypsin were compared under 6 different conditions of digestion time (30 and 240 min) and temperature (4, 24 and 37ºC). Under these conditions, our results confirmed that the GA-cross-linking reduces chymotrypsin autoproteolysis compared to the free enzyme.
Digestion (at 37ºC/240 min) of two model substrates with free or immobilized chymotrypsin as a function of heat-induced denaturation of substrate was studied. Prior to digestion, the substrates (bovine serum albumin, BSA, and myoglobin) were denatured by heating for 45 min at three different temperatures (60, 75, and 90ºC). The results showed
heat-induced denaturation of BSA and myoglobin did not improve peptide maps when using GA-chymotrypsin digestion compared to using free chymotrypsin, although the latter improved with heat-induced denaturation at higher temperatures. Therefore, heating the substrate to 90ºC and using soluble enzyme provided some unfolding of substrate and limited digestion, which was better for myoglobin than for BSA.
Keywords: Peptide mapping / Cross-linking / Glutaraldehyde / Chymotrypsin / Capillary electrophoresis
Table of Contents
Résumé ... ii
Abstract ... iv
List of Tables... viii
List of Figures ... ix
Abbreviations: ... xviii
Acknowledgements ... xxi
Chapter 1. General Introduction ... `1
1.1. Proteomics and peptide mapping ... 2
1.1.1. Protein structure ... 2
1.1.2. Determination of primary protein structure ... 4
1.2. Immobilized or solid phase enzymes ... 10
1.3. Capillary electrophoresis (CE) ... 12
1.3.1. Instrumentation for capillary electrophoretic analysis ... 12
1.3.2. Analyte migration in CZE ... 14
1.4. Goals of studies ... 17
Chapter 2. Materials and Methods ... 18
2.1. Reagents and consumables ... 19
2.2. Sample preparation... 19
2.2.1. Soluble chymotrypsin autoproteolysis ... 19
2.2.2. Synthesis of immobilized chymotrypsin particles ... 20
2.2.3. Termination of chymotrypsin digestion ... 21
2.2.4. Heat-induced denaturation of protein substrates ... 22
2.2.5. In-solution digestion of substrates by free chymotrypsin ... 22
2.2.6. Digestion of substrates by immobilized chymotrypsin particles ... 22
2.3. CE separation conditions ... 22
Chapter 3. Results and Discussion ... 25
3.1. Choice of digestion buffer: ammonium bicarbonate versus Tris-HCl ... 26
3.2. Effect of SDS rinsing on CE separation reproducibility ... 29
3.4. Effect of time and temperature on autoproteolysis of soluble and immobilized
chymotrypsin ... 37
3.4.1. Soluble chymotrypsin ... 37
3.4.2. Immobilized chymotrypsin ... 45
3.5. Effect of heat-induced denaturation time on substrate digestion ... 51
3.5.1. BSA digestion by immobilized chymotrypsin ... 51
3.5.2. BSA digestion by soluble chymotrypsin ... 56
3.5.3. Myoglobin digestion by immobilized chymotrypsin ... 60
3.5.4. Myoglobin digestion by soluble chymotrypsin ... 62
Chapter 4. Conclusions and Future Work ... 65
Chapter 5. References ... 69
List of Tables
Table 1. Initial capillary conditioning parameters without SDS rinsing (Method A), those with SDS in pre-conditioning (Method B), and with SDS in post-conditioning (Method C), to optimize the reproducibility of peptide separations. ... 24 Table 2. Reproducibility of peptide maps showing the effect of rinsing with SDS during
capillary conditioning. ... 34 Table 3. Summary of migration time and peak height reproducibility across 15 peaksa as a
function of digestion time and temperatureb for triplicate injections. ... 44
Table 4. Summary of migration time and peak height reproducibility across 15 peaks as function of digestion time and temperature for triplicate injections of each of 3 samples of free CT. ... 45
List of Figures
Figure 1. Three-dimensional structure of hemoglobin [9]. ... 3 Figure 2. Schematic showing the procedure for peptide mapping of a protein used in this study
or others from the Waldron research group. ... 7 Figure 3. Structure of BSA (Bovine Serum Albumin). A few of the 17 disulfide bridges (-S-S-
bonds) are circled in red [31]. ... 8 Figure 4. Structure of Sperm Whale myoglobin [8], which has no disulfide bridges. ... 8 Figure 5. Structure of glutaraldehyde (GA) (1,5-pentanedial). ... 12 Figure 6. Cross-linking of proteins with glutaraldehyde gives a quaternary pyridinium
compound [7], which is in-soluble at pH > 5... 12 Figure 7. A schematic diagram of a capillary electrophoresis instrument. ... 13 Figure 8. A representation of analyte migration as a function of charge (cations, neutals and
anions) during CE. The terms veo, vep and vapp represent the electroosmotic,
electrophoretic and apparent velocities, respectively. ... 14 Figure 9. Schematic representation of an electropherogram showing the order of elution of CE
separation at pH > 2.7 [64]. ... 16 Figure 10. Schematic representation of the migration of cations in a capillary at pH 2.5. ... 16 Figure 11. Photograph of immobilized chymotrypsin (GA-CT) particle in centrifuge tube after
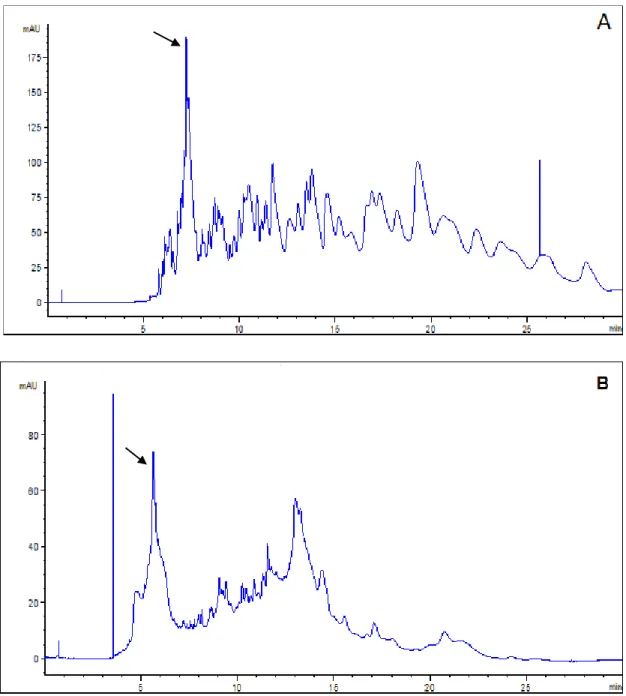
storage in 400 µL water. ... 21 Figure 12.Electropherograms showing autoproteolysis of 0.12 mM soluble CT digested in 25
mM of ammonium bicarbonate (A) and in 25 mM Tris-HCl (B), both at pH 8. Both solutions were incubated at 37ºC for 240 min. The separations were performed using a 25 mM phosphate buffer, pH 2.5,Vapp= +15 kV, Lt = 46 cm, Ld = 36 cm, using the
conditioning and injection method A (Table 1) as described in Section 2.3.1.Note that the scale is different in each graph, for clarity. Arrows indicate undigested CT. ... 28 Figure 13. Electropherograms for triplicate injections showing peptide maps for soluble CT
(0.12 mM) autoproteolysis. The digestion and separation conditions were the same as shown in Fig. 12, where no SDS rinsing of the capillary was used. ... 30 Figure 14. Electropherograms for triplicate injections showing peptide maps for 0.12 mM
as in Fig. 12 except that SDS rinsing was used in the capillary pre-conditioning (Method B, Table 1, in Section 2.3). ... 31 Figure 15. Electropherograms for triplicate injections showing peptide maps for 0.12 mM
soluble CT autoproteolysis. The digestion and separation conditions were the same as in Fig. 12 except that SDS rinsing was used in the capillary post-conditioning (Method C, Table 1, in Section 2.3). ... 31 Figure 16. Bar chart showing the migration time reproducibility of 15 peaks as identified in
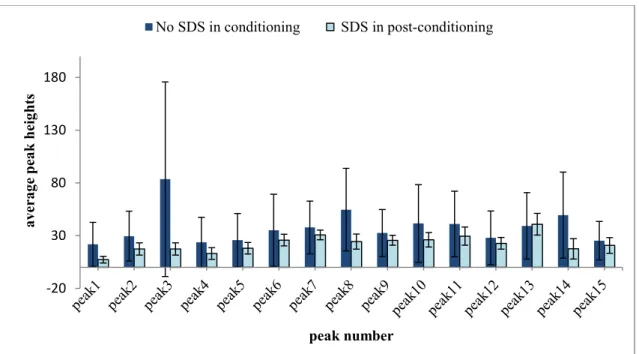
Figs. 13 and 15 resulting from autoproteolysis of 0.12 mM soluble CT using identical CE separation conditions as in Fig. 12 except for the omission of SDS (dark blue bars) and addition of SDS (light blue bars) in capillary post-conditioning rinses. Errors bars represent the standard deviation (STD) of the migration time (n=3). . 32 Figure 17. Bar chart showing the migration time reproducibility of 15 peaks as identified in
Figs. 13 and 15 resulting from autoproteolysis of 0.12 mM soluble CT using identical CE separation conditions except for the omission of SDS (dark blue bars) and addition of SDS (light blue bars) in capillary post-conditioning rinses. Errors bars represent the standard deviation (STD) of the migration time (n=3). ... 33 Figure 18. Electropherogram showing peptide maps for 0.12 mM soluble CT autoproteolysis.
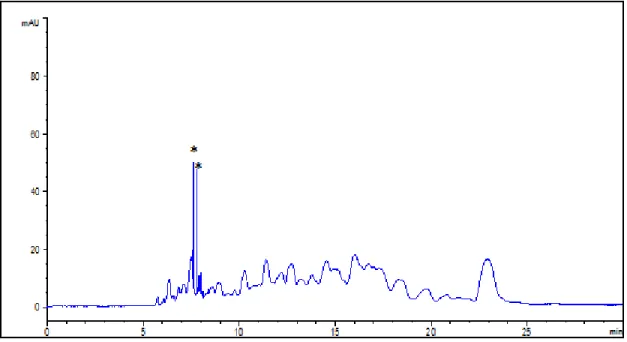
The digestion and separation conditions were the same as in Fig. 15 except that the reaction was stopped by adding 1 µL 12 M HCl (method in Section 2.2.3). Peaks labeled with a star (*) are noise: they are too narrow to be dissolved species and appear randomly. ... 36 Figure 19. Electropherogram showing peptide maps for 0.12 mM soluble CT autoproteolysis.
The digestion and separation conditions were the same as in Fig. 15 except that the reaction was stopped by putting the digestion solution in a dry ice/acetone bath (-78ºC) (method in Section 2.2.3). ... 36 Figure 20. Electropherograms showing peptide maps for autoproteolysis of 0.12 mM soluble
CT (A) at three different temperatures, 37, 24 and 4ºC, for 240 min and the zoomed-in electropherograms (B). The experiment was repeated 3 times at each temperature and a reproducibility study is shown in Figs. A1 to A3 in the Annex. The peaks labeled with numbers in the electropherograms are those followed for
reproducibility studies. The separation condition was the same as shown in Fig. 15. ... 38 Figure 21. Electropherograms showing peptide mapping for autoproteolysis of 0.12 mM soluble
CT in three temperatures (A) at three different temperatures 37, 24 and 4ºC, for 30 min. (B) is a zoomed-in version of the same electropherogram. The experiment was repeated 3 times at each temperature and a reproducibility study is shown in Figs. A4 to A6 in the Annex. The separation conditions were as shown in Fig. 15. ... 39 . Figure 22. A plot of the average enzyme peak height versus digestion temperature for 0.12
mM soluble CT digestion at 37, 24 and 4ºC for 240 min (the red data points, and 30 min (blue data points) compared with free enzyme (same concentration) without any digestion. Errors bars represent the standard deviation (n = 3 injections) of the peak heights. ... 40 Figure 23. Bar charts showing the variation of migration time (A) and the variation of the peak
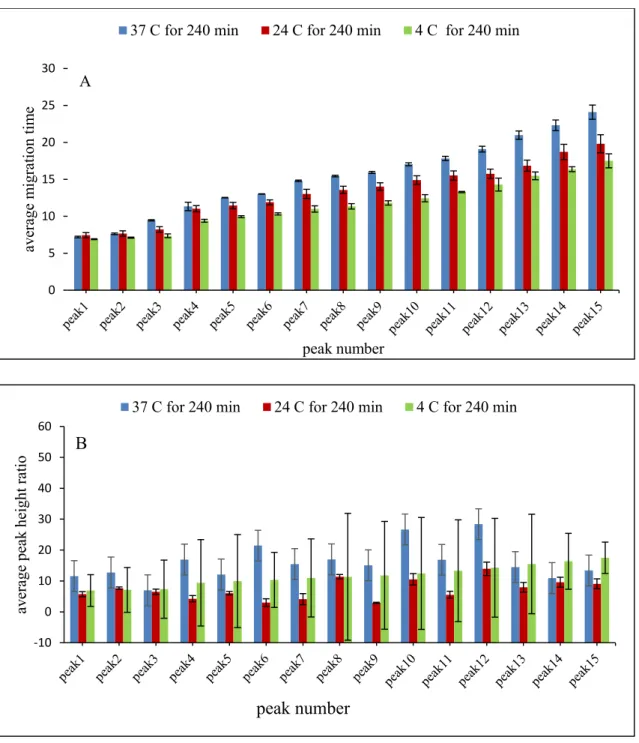
height (B) across 15 peaks, where the blue bars, the red bars and the green bars represent digestions at temperatures of 37, 24 and 4ºC, respectively, for 240 min. The peptide maps (separations) are presented in Figs. A1-A3 (Annex). Error bars represent the standard deviation of the three analyses (injections). ... 42 Figure 24. Bar chart showing the reproducibility of average migration time (A) and
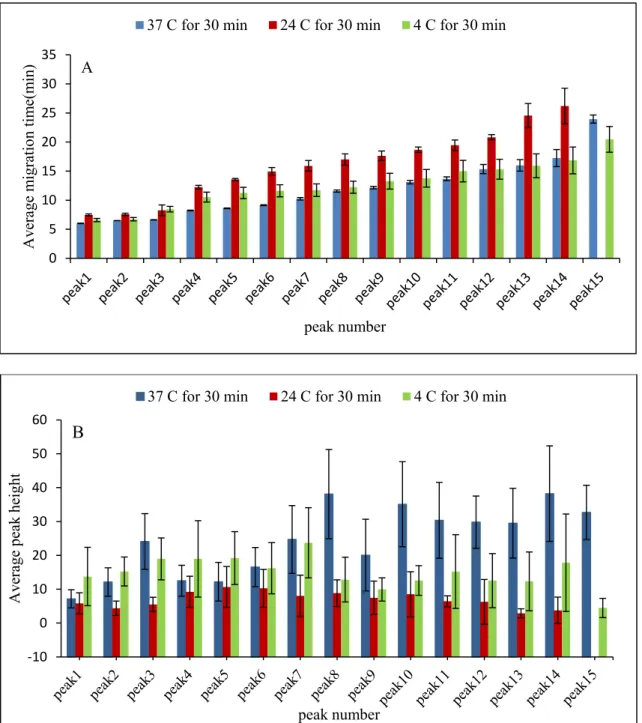
reproducibility of peak heights (B) across 15 peaks, where the blue bars, the red bars and the green bars represent digestions at temperatures of 37, 24 and 4ºC, respectively, for 30 min. The peptide maps (separations) are presented in Figs. A4-A6 (Annex). Error bars represent the standard deviation of the three analyses (injections). ... 43 Figure 25. Electropherograms showing peptide maps for three analyses of 0.24 mM
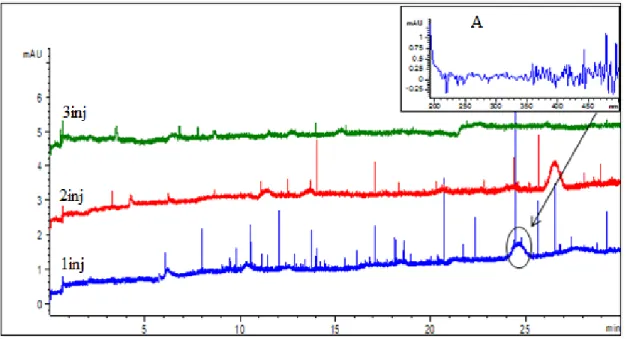
immobilized CT (i.e., GA-CT; same batch) with incubation time of 240 min at 37°C. The separation conditions were the same as shown in Fig. 15. Panel A is the UV-visible spectrum from the DAD detector of the peak circled in the electropherogram of the 1st injection. ... 46
Figure 26. Electropherograms showing peptide maps for four analyses of 0.24 mM GA-CT (same batch) with incubation time 240 min at 24ºC. The separation conditions were the same as shown in Fig. 15. ... 47
Figure 27. Electropherograms showing peptide maps for three analyses of 0.24 mM GA-CT (same batch) with incubation time 240 min at 4°C. The separation conditions were the same as shown in Fig. 15. Panel A is the UV-visible spectrum from the DAD detector of the peak circled in the electropherogram of the 1st injection. ... 47
Figure 28. Electropherograms showing peptide maps for three analyses of 0.24 mM GA-CT (same batch) with incubation time 30 min at 37°C. The separation conditions were the same as shown in Fig. 15. Panel A is the UV-visible spectrum from the DAD detector of the peak circled in the electropherogram of the 3rd injection. ... 48
Figure 29. Electropherograms showing peptide maps for three analyses of 0.24 mM GA-CT (same batch) with incubation time 30 min at 24°C. The separation conditions were the same as shown in Fig. 15. Panel A is the UV-visible spectrum from the DAD detector of the peak circled in the electropherogram of the 1st injection. ... 49
Figure 30. Electropherograms showing peptide maps for three analyses of 0.24 mM GA-CT (same batch) with incubation time 30 min at 4°C The separation conditions were the same as shown in Fig. 15. Panel A is the spectrum of the peak circled in the electropherogram of the 3rd injection. ... 49
Figure 31. Electropherograms (peptide maps) showing the comparison between autoproteolysis of free (soluble) CT (A) and immobilized CT (B). Both were incubated at 37ºC for 240 min. The separation conditions were the same as shown in Fig. 15. ... 50 Figure 32. Electropherograms showing effect of different concentration of CE separation buffer
on peptide maps of BSA: (A) 25 mM sodium phosphate buffer, pH 2.5; (B) 75mM sodium phosphate buffer, pH 2.5. The sample was the same in both separations: 0.013 mM BSA digested with GA-CT at 37ºC for 240 min after BSA denaturation at 90ºC for 45 min. The separation conditions were the same as shown in Fig. 15, except the separation buffer concentration. ... 53 Figure 33. Electropherograms showing peptide maps of BSA (0.013 mM) with three different
temperatures of denaturation for 45 min: 60, 75 and 90oC. The digestion was made
with GA-CT at 37ºC for 240 min and the enzyme to substrate ratio was 18:1 (mol:mol). The separation conditions were the same as shown in Fig. 15, except for CE buffer concentration, which was now 75 mM. The inset image (Fig. 33A) presents the injection of undenaturated BSA to identify its migration time (9.35 min)
in this CE separation. Peaks 1 and 2 for each denaturation temperature were selected for quantitative comparison. ... 54 Figure 34. Plot of the average peak height ratios of h1/hBSA and h2/hBSA versus denaturation
temperature for BSA denatured at 60, 75 and 90ºC for 45 min and digested at 37ºC for 240 min, for triplicate injections. Peaks 1, 2 and BSA are those labeled in Fig. 33. Data for this graph are shown in Table A1 in the Annex. ... 55 Figure 35. Electropherograms showing peptide maps of BSA (0.013 mM) for three different
temperatures of denaturation: 60, 75 and 90ºC. The digestion was made with free CT at 37ºC for 240 min and the enzyme to substrate ratio was 1:10 (mol:mol). The separation conditions were the same as in Fig. 33. The inset, Fig. 35A, presents the injection of undenatured BSA, showing that migration time for a standard solution injected into the CE has a different migration time than when in a digest. Peaks 1 and 2 are peptides identified by their UV absorbance spectra. ... 57 Figure 36. Plot of the average peak height ratios of h1/hBSA and h2/hBSA versus denaturation
temperature for BSA denatured at 60, 75 and 90ºC for 45 min and digested at 37ºC for 240 min, for triplicate injections. Peaks 1, 2 and BSA are those labelled in Fig. 35. Data for this graph are shown in Table A2 in the Annex. ... 58 Figure 37. Electropherograms showing peptide maps of heat-denatured BSA (0.013 mM) at
90ºC digested for 240 min at 37ºC with: (A) GA-CT (enzyme:substrate = 18:1), (B) soluble CT (enzyme;substrate = 1:10), and (C) soluble CT but without BSA (blank experiment). The separation conditions were the same as shown in Fig. 33. ... 59 Figure 38. Electropherograms showing peptide maps of myoglobin (2 mg/ml) at three different
temperatures of denaturation: 60, 75 and 90oC. The digestion was made with
GA-CT at 37ºC for 240 min and the enzyme to substrate ratio was 18:1 (mol:mol). The separation conditions were the same as shown in Fig. 33. ... 61 Figure 39. Electropherogram showing the blank digestion of 0.013 mM myoglobin heat-denatured at 90ºC, then incubated with no CT at 37ºC for 240 min. The inset, Fig. 39A, presents the UV absorbance spectrum of myoglobin from the DAD detector. The separation conditions were the same as shown in Fig. 33. ... 61 Figure 40. Electropherograms showing peptide maps of myoglobin (0.013 mM) at three
was made with soluble CT at 37ºC for 240 min and the enzyme to substrate ratio was 1:10 (mol:mol). The separation conditions were the same as in Fig. 33. ... 62 Figure 41. Electropherogram of a blank experiment (no myoglobin substrate) heated at 90ºC
and incubated with soluble CT at 37ºC for 240 min. The separation conditions were the same as shown in Fig. 33. Panel A (inset) is the DAD spectrum of the CT peak. ... 63 Figure 42. Electropherograms showing peptide maps of myoglobin (0.013 mM) heat-denatured
at 90ºC (Panel B), and the blank experiment (no myoglobin; Panel A). Both digestions were made at 37ºC for 240 min. The separation conditions were the same as in Fig. 33. ... 64
List of Annex Figures
Figure A1. Electropherograms showing peptide maps of three injections of 0.12 mM soluble CT autoproteolysis (same sample) with incubation time 240 min at 37ºC. The separation conditions were the same as shown in Fig. 15. Panel A is the UV-visible spectrum from the DAD detector of the peak circled in the electropherogram of the 1st injection. ... 77
Figure A2. Electropherograms showing peptide maps of three injection 0.12 mM soluble CT autoproteolysis (same sample) with incubation time 240 min at 24ºC (A) and (B) is a zoomed-in version of the same electropherogram. The separation conditions were the same as shown in Fig. 15. ... 78 Figure A3. Electropherograms showing peptide maps of three injection 0.12 mM soluble CT
autoproteolysis (same sample) with incubation time 240 min at 4ºC and (B) is a zoomed-in version of the same electropherogram. The separation conditions were the same as shown in Fig. 15. ... 79 Figure A4. Electropherograms showing peptide maps of three injections 0.12 mM soluble CT
autoproteolysis (same sample) with incubation time 30 min at 37ºC. The separation conditions were the same as shown in Fig. 15. ... 80 Figure A5. Electropherograms showing peptide maps of three injection 0.12 mM soluble CT
autoproteolysis (same sample) with incubation time 30 min at 24ºC (A) and (B) is a zoomed-in version of the same electropherogram. The separation conditions were the same as shown in Fig. 15. ... 81 Figure A6. Electropherograms showing peptide maps of three injection 0.12 mM soluble CT
autoproteolysis (same sample) with incubation time 30 min at 4ºC (A) and (B) is a zoomed-in version of the same electropherogram. The separation conditions were the same as shown in Fig. 15. ... 82 Figure A7. Electropherograms showing comparison between autoproteolysis of free CT (A),
and GA-CT (B). Both incubated at 24 ºC for 240 min and separation conditions were the same as in Fig. 15. ... 83
Figure A8. Electropherograms show comparison between autoproteolysis of free CT (A), and GA-CT (B). Both were incubated at 4ºC for 240 min and the separation conditions were the same as in Figure 15. ... 83 Figure A9. Electropherograms show comparison between autoproteolysis of free CT (A), and
GA-CT (B). Both were incubated at 37ºC for 30 min and the separation conditions were the same as in Fig. 15. ... 84 Figure A10. Electropherograms show comparison between autoproteolysis of free CT (A), and
GA-CT (B). Both were incubated at 24ºC for 30 min and the separation conditions were the same as in Fig. 15. ... 84 Figure A11. Electropherograms show comparison between autoproteolysis of free CT (A), and
GA-CT (B). Both were incubated at 4 ºC for 30 min and the separation conditions were the same as shown in Fig. 15. ... 85 Figure A12. Electropherograms showing peptide maps of heat-denaturated BSA (2 mg/ml) at
60ºC then digested for 240 min at 37ºC (A), and blank experiment without BSA (B), both cases digested with free CT (enzyme: substrate = 1:10). The separation conditions were the same as in Fig. 33. ... 86 Figure A13. Electropherograms showing peptide maps of heat-denaturated BSA (2 mg/ml) at
75ºC then digested for 240 min at 37ºC (A), and blank experiment without BSA (B), both cases digested with free CT (enzyme: substrate = 1:10). The separation conditions were the same as in Fig. 33. ... 87 Figure A 14. Electropherograms showing peptide maps of heat denaturated BSA (2 mg/ml) at
90ºC (2 mg/ml) then digested for 240 min at 37ºC (A), and blank experiment without BSA (B), both cases digested with free CT (enzyme: substrate = 1:10). The separation conditions were the same as in Fig. 33. ... 87
List
of Annex Tables
Table A1. Summary of CE reproducibility for 0.013 mM BSA digested with immobilized chymotrypsin (GA-CT) ... 88 Table A2. Summary of CE reproducibility for 0.013 mM BSA digested with free CT ... 89
Abbreviations:
BSA Bovine serum albumin BGE Background electrolyte CE Capillary electrophoresis CZE Capillary zone electrophoresis CIEF Capillary isoelectric focusing CITP Capillary isotachophoresis CGE Capillary gel electrophoresis
CT Chymotrypsin
DAD Diode array detector EOF Electroosmotic flow f.s. Fused silica
GA Glutaraldehyde
GA-CT Glutaraldehyde cross-linked chymotrypsin HPLC High performance liquid chromatography
HPLC-MS/MS High performance liquid chromatography-tandem mass spectrometry IEC Ion exchange chromatography
ID Inner diameter
LC Liquid chromatography
Lt Total length
Ld Total length to capillary detector
MALDI-TOF-MS Matrix assisted laser desorption/ionization time-of-flight mass spectrometry
MECC Micellar electrokinetic capillary chromatography
MS Mass spectrometry
O.D. Outer diameter
RSD Relative standard deviation SDS Sodium dodecyl sulfate
SDS-PAGE Sodium dodecylesulfate-polyacrylamide gel electrophoresis
s Standard deviation
UV Ultra-Violet
Vis Visible
veo Electroosmotic velocity vep Electrophoretic velocity vapp Apparent velocity
I dedicate my dissertation work to my family especially mama, you always
said
" work hard now and enjoy later". with all this hard work, I guess it is my time
to enjoy.
I also dedicate this work and give special thanks to my best husband Dr. Ben zabeh and
my wonderful kids Salima, Faraj, Sundoos and Omar for being there for me throughout
Acknowledgements
I would like to express the deepest appreciation to my supervisor Professor Karen C. Waldron, who has supported me continually during my research and progressive improvement of my scientific knowledge. Without her supervision and constant help this dissertation would not have been possible.
I would like to thank our group members, Golfam, Denis, Samantha, Antoine and Brain who helped me to achieve my goal and provided me with valuable scientific recommendations. Without help and support of my classmates, this achievement would not be complete.
Also, I would like to extend my appreciation for their continual support and help to the group members of Professor Rochefort; John Forgie, Άrann McMahon, Bruno Gèlinas, Arash Atashi, Imene Benrazek, Soumia El Khakani, etc.
I wish to thank my committee members, Pr. Pierre Thibault and Pr. Alexis Vallée-Bélisle, for their expertise, precious time and extensive corrections.
On a more personal note, I would like to thank my mother, sisters, and brothers for believing in me and my capabilities to complete this dissertation. Their support and encouragement gives me enough strength and power to complete my work.
Last but not least, I would like to dedicate my thesis to my lovely husband, Dr. Muftah Ben zabeh, who has provided me a stable life socially and emotionally, and to my children, Salima, Faraj, Sundoos, and Omar who continually enlighten my life and are my source of power used to overcome any challenge.
Chapter 1. General Introduction
1.1. Proteomics and peptide mapping
Proteomics is the study of proteins, specifically the characterization of their function and structure. Proteins are macromolecule complexes (polypeptides), which are composed of linear amino acid sequences linked by peptide bonds and then folded and connected by mostly non-covalent interactions. Proteins play important roles in different biological processes and represent the final expression product of transcribed genes. Proteomic experiments generally focus on the identification and quantification of proteins [1-3]. Proteomics can lead to insights into biological systems to further understand disease progression, and to identify biomarkers associated to disease or the effectiveness of therapeutic treatment [3-5].
One method commonly used as tool in proteomic studies is peptide mapping, where protein digestion is followed by analytical separation of peptide fragments, i.e., polypeptides. The resulting peptide fragments are a fingerprint or map of the original protein [6, 7]. In other words, the peptide map obtained after the digestion will be unique and will allow the user to identify the parent protein. Bio-analysts often use peptide mapping to characterize proteins and to identify post-translational modifications or amino acid substitution (mutation). This thesis touches the topic of peptide mapping, which relates to the primary sequence of proteins. The following section describes the general structure of proteins, and then the details for determination of primary structure are described in Section 1.1.2. The two techniques used for peptide mapping in this thesis, immobilized enzymes for digestion and capillary electrophoresis (CE) for analytical separation of peptides, are presented in Sections 1.2 and 1.3.
1.1.1. Protein structure
This topic is a matter of interest because the structure of a protein is modified during denaturation and cleavage (also called digestion), and the structure of a protein determines its functions. There are four different types of protein molecular structure: primary, secondary, tertiary and quaternary [8].
The primary protein structure is the linear sequence of amino acids that are connected by covalent bonds called "peptide bonds." It starts at the N-terminal of the amino acid group and ends at the C - terminal of the carboxyl acid (Fig. 1a).
The secondary protein structure is the shape of the peptide chain caused by intermolecular and intermolecular hydrogen bonding. Two main structures are observed, called α-helices and β-pleated sheets (Fig. 1b).
The tertiary protein structure refers to the three-dimensional conformation of the long polypeptide chains. There are two general classes of proteins based on tertiary structure: fibrous and globular (Fig. 1c).
The quaternary protein structure is the way in which multiple polypeptide chains interact in a large protein [8-10]. The different levels of protein structure are illustrated in Fig. 1, and the cumulative effect is called folding (Fig. 1d).
In general, the stability of the three dimensional structure of proteins depends on the types of bonds at each level of structure in the protein such as hydrogen bonds, electrostatic attractions, hydrophobic interactions (non polar) and disulfide bridges [8]. A small modification of the primary structure of the protein can lead to a significant change in the shape and function of the entire molecule. For example, Pauling explains sickle cell anemia as being the result of a modification of the primary structure of hemoglobin [8]. His studies showed that a glutamic acid group is replaced by a valine group, leading to the modification of the larger structure. In other words, the substitution of a single amino acid led to the modification of the three dimensional structure and then to the malfunction of the protein and thus disease.
The secondary, tertiary and quaternary structures are held together mainly by hydrogen bonds and electrostatic attractions [8]. These can be changed by modifying the environment of the protein. Hydrogen bonds are weak bonds, but in a long polypeptide chain there are numerous amino acids that participate in this type of interaction, resulting in the overall stability of the protein. The electrostatic attraction between the positive and negative charges on the backbone of the polypeptide chain is stronger than hydrogen bonds, when present. These charges can be found on amino acids with basic or acidic side chains like in histidine, lysine, arginine, glutamic acid, aspartic acid, cysteine, asparagine, glutamine and even tyrosine.
The tertiary structure of a protein can also include a third type of interaction, disulfide bonding, which is a covalent bond and thus stronger than electrostatic attraction. A disulfide bridge (disulfide bond) is the result of a covalent bond between the thiol groups of two cysteine residues [8]. Lastly, weaker hydrophobic interactions between amino acid side chains also contribute to the folding of proteins.
1.1.2. Determination of primary protein structure
To determine the structure of a protein and its function, it is important to know the primary sequence of amino acids as shown in Fig. 1a. In cells, very large sequences of DNA coding for specific genes are transcribed into mRNA in the ribosome. The nuclear pores in
cells facilitate the movement of mRNA in the ribosome to form the structure of the protein. The protein's function is based on its structure; any change in the sequence of protein, i.e., primary structure, can affect function [8]. To define the primary structure, two main techniques exist: Edman degradation [11-13] and peptide mapping by high performance liquid chromatography-tandem mass spectrometry (HPLC-MS/MS) or by matrix assisted laser desorption/ionization time-of-flight mass spectrometry (MALDI-TOF-MS) [14-17]. These two MS methods are now routinely used to characterize and identify proteins. Peptide separations can also be performed by sodium dodecylsulfate-polyacrylamide gel electrophoresis (SDS-PAGE), HPLC, ion exchange chromatography (IEC), or capillary electrophoresis (CE), where these last three are coupled with various detection methods like UV-Vis absorbance or fluorescence spectroscopy or mass spectrometry (MS). Without MS detection, these separation methods can be used to compare two peptide maps, but cannot define primary amino acid sequence. In this work, peptide mapping refers to the CE separation of proteolytic peptides. In CE with UV detection, although the identity of the individual peaks may not be known and would require sequencing for proper identification, comparisons between peptide maps can be informative.
Peptide mapping is often used to characterize proteins by identification of post-translational modifications or anomalies within the polypeptide chain. Any change in migration time of a single peptide peak or band on the electropherogram confirms that one or more amino acids have been altered in the peptide [18, 19]. In some cases, such modifications can lead to diseases.
The focus of our group’s research has been to develop analytical techniques to improve peptide mapping. Peptide mapping involves three steps:
1) Protein denaturation, reduction and alkylation (if needed); 2) Protein cleavage by an enzyme, or chemical reagent; 3) Separation of the peptides.
These concepts are shown in Fig. 2. The first step, protein denaturation with reduction and alkylation, is a process in which a protein's overall 3-dimensional structure is disassembled to make linear polypeptide chains. This usually involves chemical or heat treatment, discussed further below. In general, large proteins require chemical denaturation to break
hydrogen and electrostatic bonds using, for example, urea or SDS. Then they require reduction of the resulting -SH groups from the disulfide bonds and alkylation because such proteins are highly folded and the enzyme will not otherwise be able to cut (digest) them. Some proteins do not require this step or may only require heat-induced denaturation if there is not much folding present [8], although this processes is often reversible upon cooling the protein solution.
The second step involves using proteases (enzymes) to cleave proteins into smaller polypeptides [20, 21]. Common enzymes used for proteolytic cleavage include trypsin, chymotrypsin and pepsin [22, 23]. Trypsin cleaves proteins at the carboxyl terminal side of the amino acids lysine (K) and arginine (R) [7]. Chymotrypsin cleaves peptide bonds at the carboxyl terminal side of tryptophan (W), tyrosine (Y) and phenylalanine (F); in other words, at an amino acid containing an aromatic ring in its side chain [22-25]. Some cleavage on the C-terminal side of leucine (L) and methionine (M) is also possible with chymotrypsin. Finally, pepsin cleaves peptide bonds between hydrophobic and also at aromatic amino acids. In this study, chymotrypsin (CT) was used as an alternative to trypsin, currently the most commonly used enzyme for proteomic studies. Trypsin is favored because it cannot cut at as many positions on the protein, which leads to more selective cleavage and thus peptides terminating only in lysine and arginine residues [6, 26, 27]. A greater amount of peptides will be observed when using CT because of its ability to cut at more amino acid positions on a protein than trypsin [23]. Pepsin is a less common enzyme than trypsin, for similar reasons. Chemical cleavage involves using reagents like cyanogen bromide to cut proteins into polypeptides; however, only enzymatic methods were investigated in this study.
For the third step, separation, possible methods include HPLC, MS, HPLC-MS, IEC and CE [2, 26]. In this study, the technique of CE coupled with UV absorbance detection was employed [23, 27-29]. CE has many advantages compared to other separation techniques, such as speed, the small amount of sample injected, its low solvent consumption, and a high separation efficiency [23, 27, 28, 30].
Figure 2. Schematic showing the procedure for peptide mapping of a protein used in this
study or others from the Waldron research group.
Bovine serum albumin (BSA) and myoglobin were used as model substrates in this study. Fig. 3 shows the structure of BSA from Bovine Serum Albumin, and Fig. 4 shows the structure of Sperm Whale myoglobin. However, as mentioned above, the specific conformation of a native protein depends on the physical and chemical conditions of the protein environment. A distortion of the three dimensional structure of a protein is called denaturation, and this will be explained further below.
Figure 3. Structure of BSA (Bovine Serum Albumin). A few of the 17 disulfide bridges
(-S-S- bonds) are circled in red [31].
Figure 4. Structure of Sperm Whale myoglobin [8], which has no disulfide bridges.
Protein denaturation involves the alteration of the native secondary, tertiary, and/or quaternary structures, and is usually caused by changes in the protein’s environment [8]. These changes include variations in pH, temperature and pressure or the addition of chemical
denaturants such as urea, guanidine hydrochloride and SDS [8, 32, 33]. Most commonly, protein denaturation is followed by reduction and alkylation [2, 22, 33, 34].
Heat-induced denaturation is the change of conformation of the secondary and tertiary protein structure. Heating can cause the breakdown of hydrogen bonds and non-polar hydrophobic interactions: this causes the folded protein to partially unfold. A protein's conformation does not generally change until the temperature passes a certain threshold [8]. The process is, however, reversible upon cooling for most proteins. In the present study, the effect of heat-induced denaturation on peptide mapping by soluble and immobilized CT was explored; the results are presented in Chapter 3.
Denaturation can also be achieved by changes in the pH, which can lead to ionization of amino acid side chains (Lysine, Arginine, Histidine, Aspartic acid, Glutamic acid, Tyrosine and Cysteine), a breakdown of H-bonding and a change in the molecular charge distribution [8]. Chemically-induced denaturation is caused by adding a chemical reagent to the protein in solution. Adding surfactants like SDS to a protein can affect interactions within the protein resulting in its unfolding [35].Urea is also widely used as a chemical agent in protein denaturation by breaking hydrogen bonds between polypeptide chains of a protein [8, 23, 32, 36].
After denaturation, the disulfide bridges within a protein can then be reductively cleaved by the addition of dithiothreitol. Iodoacetamide is usually added after this to prevent reformation of disulfide bridges between cysteine groups by alkylating the thiol side chains [36, 37]. This aspect of protein treatment by reduction and alkylation was not studied in this project, as described further in Section 1.4.
The proteolytic digestion of proteins at 37ºC for a given period of time can be carried out by adding a soluble enzyme to the protein after heat-induced denaturation, reduction and alkylation [38]. Trypsin is the most commonly-used proteolytic enzyme for protein digestion in solution [23, 39]. The enzyme is typically added to a denatured and reduced/alkylated protein in solution a low enzyme to substrate ratio (1:25) so that autoproteolysis products from the enzyme are in low abundance compared to peptides from the substrate.
However, the digestion of proteins in solution has some disadvantages. For example, the enzyme samples can only be used once (owing to the inability to separate the enzyme
from the digestion mixture), there is a slow rate of digestion because of the low enzyme concentration, and there is a decrease in enzyme activity due to autoproteolysis [23]. It also has some advantages on the other hand, such as the rapid preparation of the soluble enzymes, and the ability to carry out digestion directly on gels when using proteins that have been purified using gel electrophoresis [40, 41].
1.2. Immobilized or solid phase enzymes
Recently, immobilized enzymes have become a topic of considerable interest in the literature. The number of methods to immobilize enzymes is increasing steadily [7, 42-44]. In our group, immobilized enzymes are studied because we can easily separate them from the digestion mixture, resulting in a purer peptide map. The other advantage of immobilized proteolytic enzymes is their increased stability and their reusability.
Current methods for enzyme immobilization can be divided into two general classes: chemical methods and physical methods [45]. Chemical methods add covalent bonds, which are formed between the enzyme and the support, such as a silica or polymeric particle [46]. Physical methods can include adsorption to mesoporous silicates [47] adsorption to modified silica gel [48], and sol-gel entrapment [9, 49] without creating covalent bounds. There are different methods used to immobilize enzymes on a carrier (solid particle), such as Cross-linking Enzyme Crystals (CLECs) or by Cross-Cross-linking Enzyme Aggregates (CLEA) [45]. Porter et al. [50] studied immobilized enzymes such as pepsin, trypsin and α-chymotrypsin bound to controlled pore glass (CPG) beads and determined enzyme activity by monitoring the digestion of plant and animal proteins. Also, immobilized enzyme platforms can be produced by using microencapsulation methods such as that used to make paper-based biosensors [51].
Previous studies by Migneault et al. [43] were done to determine the efficiency when comparing two procedures for immobilizing trypsin via linkage of the enzyme to CPG beads or by the cross-linking reaction (i.e., without solid support) with glutaraldehyde (GA). Human hemoglobin was used as a substrate for peptide mapping by CE as the separation technique. Bonneil et al. [6] studied the activity of an immobilized trypsin microreactor made
and insulin chain B and CE-UV was used as a separation technique for peptide mapping. Nguyen [22] used a similar method to immobilize chymotrypsin via GA cross-linking with CE-UV as the separation technique for the analysis of peptides from human hemoglobin. Ghafourifar et al. [23] used an immobilized enzyme reactor based on GA-cross-linking of chymotrypsin (CT) into a fused silica (f.s) capillary for the analysis of myoglobin by CE-UV and CE-MS. Ghafourifar et al. [23] also used GA-CT particles for peptide mapping of fluorescently labelled β-casein by CE-laser induced fluorescence (LIF). The advantage of using CE-LIF as an alternative method to CE-UV is because it is a very sensitive detection method [52, 53]. However, the kinetics of fluorescent labelling of peptides in a digest is concentration limited. This means that if the substrate concentration is too low, the peptides will be too diluted for labelling. Therefore, this limits the studying of immobilized enzyme efficiency at very low substrate concentrations (i.e., if they are < 1 µM) by both CE-LIF and CE-UV peptide mapping. It is possible instead to use diluted fluorescent substrates to study immobilized enzymes by mapping their fluorescent peptides by CE-LIF, which has nanomolar or better detection ability. Unfortunately, this leads to another drawback for the most common proteolytic enzyme, trypsin: many fluorophores are attached to proteins at their lysine amino groups and thus the lysines are no longer recognized as a tryptic cleavage site. This is the reason our group is studying immobilized chymotrypsin, which can digest fluorescent proteins labelled at lysine groups and at concentrations that would be too low to detect by CE-UV.
In the present study, chemical immobilization was achieved using GA as a cross-linking agent for chymotrypsin. This choice was made because GA reacts rapidly with primary amines, and thus with lysine residues as well as the N-terminus of proteins [54]. Various methods of enzyme immobilization have been described in the literature [7, 44 , 55, 56]. To restrict the mobility of enzymes, GA is the most common reagent used for cross-linking proteins [54]. The same procedure that was previously used in our lab for trypsin immobilization by GA cross-linking [43] has also been used for chymotrypsin immobilization [22, 23]. Fig. 5 shows the structure of GA.
Figure 5. Structure of glutaraldehyde (GA) (1,5-pentanedial).
Glutaraldehyde immobilization has one major advantage, which is its rapid bonding with the primary amine groups present in proteins. Fig. 6 details how the reaction occurs between the protein (Enz-N) and the cross-linker, GA. Cross-linking can cause significant changes in enzyme activity, which may be disadvantageous in some circumstances [22].
Figure 6. Cross-linking of proteins with glutaraldehyde gives a quaternary pyridinium
compound [7], which is in-soluble at pH > 5.
1.3. Capillary electrophoresis (CE)
1.3.1. Instrumentation for capillary electrophoretic analysis
To follow the digestion of a protein by an enzyme, many different separation methods can be used. In this work, CE was used as a separation method, but HPLC is most commonly employed [57-59]. CE has some significant advantages such as improved speed and resolution [10, 27, 28]. Multiple separation mechanisms can be used (described below), and CE only requires nanolitre-sized sample injection [60].
There are several different modes of CE: capillary zone electrophoresis (CZE), capillary isoelectric focusing (CIEF), capillary isotachophoresis, micellar electrokinetic capillary chromatography (MECC), and capillary gel electrophoresis (CGE). CZE is the simplest and most commonly used mode of CE because of its efficiency and high resolution [61, 62]. Fig. 7 shows a diagram of a general CE instrumental setup.
CZE was used in this study, and the separation buffer was composed of sodium phosphate salt at a pH of 2.5. This buffer is commonly used in CE separation of peptides because of its resolution power [63]. In this project, the highest selectivity is found at pH 2.5 for the separation, because almost all peptides are cations at this pH and small differences in the carboxylate pKa of aspartic acid (D), glutamic acid (E) and the C-terminus will allow
peptide isomers to be separated [64]. CZE is most often used without an internal capillary coating, as in this project. A special coating can be applied to the capillary walls before carrying out CZE to stop proteins or highly cationic peptides from adsorbing onto the inner surface [65]. However, the separations in this study only involved peptides from BSA and myoglobin, which are less likely to adsorb, so a capillary coating was not used.
Finally, a DAD (diode array detector) was used as a detector. This type of multi-wavelength detector can be very useful when observing molecules with different absorption maxima, but this advantage was not exploited in this study because a single wavelength of 200 nm was used. Absorption at this wavelength is typical for peptide bonds.
Figure 7. A schematic diagram of a capillary electrophoresis instrument.
1.3.2. Analyte migration in CZE
The movement of charged analytes through the capillary is governed by two phenomena: electrophoresis and electroosmosis. Briefly, electrophoresis is the movement of a charged molecule in solution when a voltage is applied, while electroosmosis is the
movement of the bulk solution allowing neutral molecules to be detected at the cathodic end of the capillary [66].
The movement of analytes in the capillary is affected by electroosmotic flow (EOF). In fused silica capillaries, the surface is composed of silanol groups (-SiOH). A negative charge forms on the inner surface when the pH is higher than 2.7. A layer of cations from the buffer solution will begin to build up at the surface in order to keep the bulk solution neutral. When a voltage is applied, the dissolved cations begin to migrate toward the cathode, and drag with them the entire bulk solvent. In other words, all the dissolved molecules will move towards the cathode, causing the EOF.
The sum of these two movements (electrophoresis and electroosmosis) under an electric field, is illustrated in the next figure (Fig. 8), where veo is defined as the
electroosmotic velocity, vep the electrophoretic velocity, and vep the apparent velocity.
Figure 8. A representation of analyte migration as a function of charge (cations, neutals and
anions) during CE. The terms veo, vep and vapp represent the electroosmotic, electrophoretic and apparent velocities, respectively.
The flowing equation describes the velocity of electrophoretic mobility, vep, which depends
𝑣𝑒𝑝 = 𝑞
6𝜋𝜂𝑟 𝐸 (1)
where vep is electrophoretic velocity (cm/s), E is the applied electric filed (V/cm) and η is
the viscosity of the buffer. The equation of electroosmotic velocity (veo), or EOF’ is not
shown here but can be explained as the flow of buffer in a f.s. capillary tube when an electric field is applied as shown in Fig. 8. The apparent velocity, vapp, is the sum of the the
electrophoretic and electroosmotic velocities.
The separation of cations and anions is based on differences in their apparent mobilities, which is illustrated in Fig. 8 by the "+" and "-" molecules. For cations, which move in the same direction as the electroosmotic flow, the electrophoretic mobility (μep) and
the electroosmotic mobility (μeo) have the same sign (both are positive). On the other hand,
the electrophoretic mobility of anions is in the opposite direction of electroosmosis, so for anions, μep is substracted from μeo. At pH around 2.7 and higher, electroosmotic velocity is
higher than electrophoretic velocity causing anions to migrate towards the cathode, which is where the detector is located [66]. The electropherogram in Fig. 9 shows the order of CZE separations (i.e., cations > neutrals > anions) at pH > 3.
Figure 9. Schematic representation of an electropherogram showing the order of elution of
CE separation at pH > 2.7 [64].
At low pH, electroosmosis is weak (EOF = 0) and anions cannot reach the detector, only electrophoretic mobility is responsible which depends on charge (q) and radius (r), which is related to the mass of the ion. The separation pH used in this project was 2.5, so only cations are detected, where small and mulit-charged cations elute faster, followed by large cations, as shown in Fig. 10. Throughout the remainder of this thesis, the term CE is used rather than CZE.
1.4. Goals of studies
The hypothesis is that immobilized chymotrypsin (CT) can effectively digest protein substrates relative to free CT, and also reduce or prevent autoproteolysis. Previous studies from our group by Migneault et al. [43] showed that it was possible to do peptide mapping using GA-cross-linked trypsin. Nguyen used a similar method to immobilize chymotrypsin via GA cross-linking (i.e., GA-CT) with CE-UV as the separation technique used for her analysis of human hemoglobin [22] and Ghafourifar et al. [23] demonstrated peptide mapping of BSA and myoglobin with GA-CT. However, some basic experiments had not yet been done as outlined in more detail in the next paragraphs.
In the previous work done by Nguyen [22], the autoproteolysis of soluble CT without substrate was followed. The soluble CT was incubated at 37ºC for 240 min and then analyzed by CE-UV. Her result showed only a few autoproteolysis peaks. However, when Ghafourifar [23] studied autoproteolysis using a blank substrate (water as sample) “denatured” with urea, then reduced, alkylated, and incubated for 24 h at 37ºC with soluble CT, the results showed many autoproteolysis peaks for the soluble CT. the same experimental procedure but using GA-CT showed essentially no autoproteolysis peaks. These studies by Nguyen and Ghafourifar in our group showed the importance of how the substrate is prepared before digestion and that the residual reagents for denaturation/reduction/alkylation increase autoproteolysis of the free enzyme. Therefore, it was deemed interesting to see the effects of using only denaturation by heating of substrates for free (i.e., soluble) versus immobilized CT, which is explored in the current work.
The main goals of this project were to compare the performance of GA-immobilized CT to that of free CT by looking at: a) the extent of autoproteolysis for various digestion times (30 and 240 min) and temperatures (4, 24, and 37ºC), and b) whether mild substrate denaturation conditions (i.e., heating at 60, 75 and 90ºC) made a difference in enzyme digestion efficiency. For the second goal, two model proteins were used: BSA and myoglobin. Additional studies were carried out to support the main goals: i) choosing the best buffer (ammonium bicarbonate and Tris-HCl) for digestion and peptide mapping by CE-UV, ii) choosing a method for terminating the digestion that was compatible with CE-CE-UV, and iii) finding the best capillary conditioning protocol for repeatable peptide maps.
2.1. Reagents and consumables
α-Chymotrypsin from bovine pancreas type II, bovine serum albumin (BSA), and horse myoglobin-α and glutaraldehyde (25% grade ll, aqueous solution of GA), Tris(hydroxy methyl) amino methane hydrochloride, Tris base, monobasic sodium phosphate, dibasic sodium phosphate were from Sigma Aldrich (St-Louis, MO, USA). Methanol and acetone were from Fisher Scientific. Sodium chloride was from BIO BASIC INC (Torbay Road, Markham Ontario. Canada). Ammonium bicarbonate, glycine and phosphoric acid were from Sigma Aldrich (Oakville, ON, Canada). Sodium dodecyl sulphate (SDS) and sodium hydroxide were from Fisher Scientific. Hydrochloric acid was from EMD Millipore (Gibbstown, NJ, USA). Fused silica capillary tubing for CE separation (75 μm inner diameter ID, 360 μm O.D. outer diameter) was from Polymicro Technologies (Phoenix, AZ, USA). A multi cartridge Milli-Q filtration/deionization system (Millipore, Bedford, MA, USA) was employed for water purification that was used for all solutions and buffers preparation. 250 µL PP (polypropylene) insert bottom spring, with diameter 6x29 mm product from Canadian Life Science was used for CE separation in all experiments.
2.2. Sample preparation
2.2.1. Soluble chymotrypsin autoproteolysis
Chymotrypsin in Milli-Q water was added to either ammonium bicarbonate (25 mM, pH 8) or Tris-HCl (25 mM, pH 8) for autoproteolysis experiments on chymotrypsin. The final concentration of chymotrypsin for both experiments was (0.12 mM) and digestion was performed at 37ºC for 240 min. We evaluated 6 different conditions: time (30 and 240 min), and temperature (4, 24, and 37ºC) and digestion was stopped using two different methods, as described in Section 2.2.3.
2.2.2. Synthesis of immobilized chymotrypsin particles
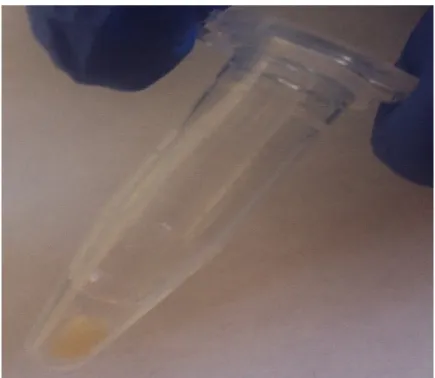
Chymotrypsin immobilization by GA-cross-linking was carried out based on a procedure described previously for trypsin and chymotrypsin [22, 23]. Briefly, in a 1.5 mL micro centrifuge vial, 80 μL of aqueous chymotrypsin solution (1.3 mM) was added to 594 μL of 50 mM phosphate buffer, pH 6.4 and 156 μL of GA, diluted to 2.5% v/v in water and added drop wise to the enzyme solution. The mixture was reacted at room temperature for 120 min and the solid or immobilized GA-CT formed, was centrifuged for 2 min at 3000 rpm and the supernatant was decanted off. The immobilized enzyme cross-linked-GA particles were washed 3 times with 400 μL phosphate buffer (50 mM, pH 6.4), then 3 times with 400 μL of sodium chloride (500 mM), and again with 400 μL of buffer. All washing steps were to remove unreacted enzyme and excess GA. Next, 400 μL glycine (200 mM) was added to react with any remaining aldehyde groups of GA and the solution was allowed to stand at room temperature for 180 min. The final product, which gave a yellow colour with irregular shape (Fig. 11) was washed 3 times with 400 μL phosphate buffer and then 3 times with 400 μL Milli-Q water. The GA-cross-linked chymotrypsin was stored in 400 µL Milli-Q water at -20⁰C in 400 μL until used.
To determine the amount of enzyme (CT) that reacted with glutaraldehyde after the cross-linking reaction (GA-CT), Ghafourifar et al. [23] reported two methods: Forth Derivative Spectroscopy and Analysis of a Mixture, which are commonly used quantitative methods in analytical chemistry [10]. Ghafourifar et al. [23] indicated that the amount of CT that reacted with GA was 94±2% by these two quantification methods. Since the GA-CT immobilization procedure used in this study was the same that used by Ghafourifar, it was assumed that we also have a 94±2% mass immobilization efficiency. It is important to point out that the activity of an enzyme usually decreases when immobilized, compared with the free (soluble) enzyme.
Figure 11. Photograph of immobilized chymotrypsin (GA-CT) particle in centrifuge tube
after storage in 400 µL water.
2.2.2.1. Immobilized chymotrypsin autoproteolysis
A solution of 400 µL of GA-CT (having 0.24 mM apparent concentration based on the initial moles of CT reacted with GA and 94% immobilization efficiency) was used for digestion in two different buffers (ammonium bicarbonate or Tris-HCl). The solutions were incubated at different temperature (4, 24, and 37ºC) for different times (30 and 240 min). Digestion products were gently shaken by hand, then 200 µL of digestion solution were collected for CE separation after stopping digestion by two methods as describe below.
2.2.3. Termination of chymotrypsin digestion
For in-solution and immobilized CT (in Sections 2.2.1 and 2.2.2), the enzymatic reactions were stopped by adding 1 μL of 12 M HCl to the digestion solution or by using a dry ice / acetone bath at very low temperature (-78ºC) prior to peptide analysis by CE.
2.2.4. Heat-induced denaturation of protein substrates
A solution of 0.013 mM substrate (BSA or myoglobin) was dissolved in ammonium bicarbonate (25 mM, pH 8), heated at 60, 75, and 90ºC for 45 min, then cooled at room temperature for 15 min. Digestion was carried out immediately before the reversible re-folding process could be complete. For all studies, BSA and myoglobin were denatured only by heating without adding any chemicals (i.e., urea). No reduction/alkylation reactions were carried out either.
2.2.5. In-solution digestion of substrates by free chymotrypsin
Heat-induced denaturated protein substrates (Section 2.2.4) were added to 400 µL free chymotrypsin (0.0013 mM final concentration) to reach an enzyme-to-substrate ratio of 1:10 and a final concentration of substrate of 0.013 mM. Digestion was carried out in 1.5 mL microcentrifuge tube at 37ºC for 240 min.
2.2.6. Digestion of substrates by immobilized chymotrypsin particles
BSA and myoglobin were heat denatured (Section 2.2.4). And digestions were carried out in 1.5 mL micro centrifuge tube by adding protein substrate immobilize chymotrypsin as described in Section 2.2.2 to reach enzyme to substrate ratio of 18:1 (mol:mol). The digestion solutions of 0.013 mM BSA or myoglobin and an effective concentration of 0.24 mM immobilized enzyme (in 400 µL) were incubated at 37ºC for 240 min. The digestion solution was decanted off by gentle shaking and 200 µL digestion solution was placed in a dry ice/acetone bath to stop reaction, before CE separation.
2.3. CE separation conditions
Separations were carried out on an HP3DCE System (Agilent Technologies, Santa
Clara, CA, USA) equipped with an ultraviolet-visible (UV/Vis) Diode Array Detector (DAD). All separations were performed in f.s. capillary of 75 μm inner diameter (ID) and 360 μm outer diameter (OD). The total capillary length was 46 cm with effective length to
the detection window of 36 cm from the inlet. Background electrolyte (BGE) separation buffers (25 and 75 mM) were made in purified water and the pH was adjusted to 2.5 by using sodium phosphate and phosphoric acid, with concentration of 25 or 75 mM as indicated in Table 1. All BGEs and rinsing solutions were passed through 0.22 μL Nylon syringe filters from (Thermo Scientific, Waltham, MA) to fill the reservoirs in HP3DCE instrument. The
current, +15 kV electric potential, was switched on for 30 min with the anode plunged into BGE buffer at the inlet vial and the cathode into the outlet BGE buffer vial. A SDS solution was dissolved in Milli-Q water and passed through 0.22 µL filter before use. For all separations detections were performed at λ = 200 nm.
In this project, a new capillary was conditioned by rinsing sequentially 1M NaOH for 10 min (flush = 950 mbar), pure water for 10 min (flush), and phosphate buffer for 10 min (flush). Between each new sample, the capillary was rinsed (flushed) with 0.1 M NaOH for 3 min, pure water for 3 min and phosphate buffer for 3 min.
The method for capillary conditioning was modified a few times during the study. For convenience, the different methods used are shown in Table 1. All autoproteolysis and digest samples were run (injected) at least three times. According to the injection conditions in Table 1, the volume of sample injected into the capillary (29 nL, determined by using the Poiseuille equation) was accomplished by applying pressure of 34.5 mbar for 5 s. Electropherograms (i.e., the peptide maps) were compared either visually or by measuring peak heights and migration times as a way to evaluate the efficiency of digestion (or autoproteolysis).
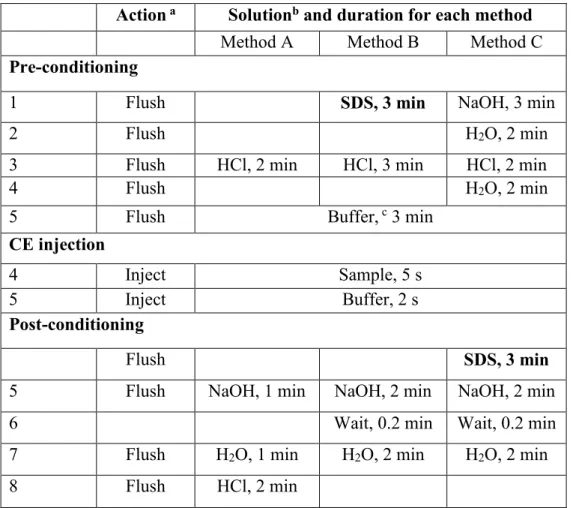
Table 1. Initial capillary conditioning parameters without SDS rinsing (Method A), those with SDS in pre-conditioning (Method B), and with SDS in post-conditioning (Method C), to optimize the reproducibility of peptide separations.
Action a Solutionb and duration for each method
Method A Method B Method C
Pre-conditioning
1 Flush SDS, 3 min NaOH, 3 min
2 Flush H2O, 2 min
3 Flush HCl, 2 min HCl, 3 min HCl, 2 min
4 Flush H2O, 2 min
5 Flush Buffer, c 3 min
CE injection
4 Inject Sample, 5 s
5 Inject Buffer, 2 s
Post-conditioning
Flush SDS, 3 min
5 Flush NaOH, 1 min NaOH, 2 min NaOH, 2 min
6 Wait, 0.2 min Wait, 0.2 min
7 Flush H2O, 1 min H2O, 2 min H2O, 2 min
8 Flush HCl, 2 min
a Flush carried out at 950 mbar; injection carried out at 34.5 mbar;
b HCl at 0.1 M; NaOH at 0.1 M; sodium phosphate buffer at 25 mM, pH 2.5; water was always Millipore
polished; SDS at 25 mM in water.
During the initial experiments of chymotrypsin (CT) autoproteolysis, we suspected that the digestion buffer composition and the method for stopping the digestion might affect the quality of the peptide maps. It was also evident that residual enzyme in digest solutions was affecting the CE separations so capillary rinsing with an SDS solution, which denatures proteins, was added in order to improve reproducibility of the peptide maps. These three experimental parameters, explored for soluble CT only, are described in the first three sections of Chapter 3.
To evaluate the extent of proteolysis of immobilized versus soluble CT, several different digestion temperatures and times were studied, as described below in Section 3.4. The hypothesis that heat-denatured substrates can be digested by immobilized CT to the same extent as soluble CT is evaluated in Section 3.5 for the protein substrates BSA and myoglobin.
3.1. Choice of digestion buffer: ammonium bicarbonate versus Tris-HCl
The choice of digestion buffer is important because its composition and pH affect the activity of the enzyme [38, 67]. As mentioned before, the structure of a protein substrate can be modified by its environment, which could impair or improve the effectiveness of the enzyme [22, 43]. In addition, since digested samples are injected directly into the CE without any solid phase extraction “clean-up” or enrichment, the presence of digestion buffer in the sample matrix can greatly affect the peak shapes and selectivity in CE because a high matrix ionic strength causes reverse stacking leading to peak broadening. The optimal buffer should provide the best digestion (including CT autodigestion) and should also not affect the separation of individual peaks in an electropherogram. Typically, digestion buffers are volatile and often used in biochemistry studies where buffer exchange is required. In the current study, enzyme digestion in two different buffer solutions (ammonium bicarbonate and Tris-HCl) was investigated to determine their effects on autoproteolysis and on the quality of the peptide maps by CE. Our group had previously used these buffers when investigating trypsin and CT digestion [7, 23, 43]. Ammonium bicarbonate is a buffer used in the pH 8-10 range, and Tris-HCl in the pH 7.3–9.3 range [47, 68].Aqueous ammonium bicarbonate solution was added to soluble CT to give final concentrations of 25 mM for the buffer and 0.12 mM for CT. The solution was incubated at 37ºC for 240 min, and then analyzed by CE. The same procedure was followed for Tris-HCl. Both digestion buffer solutions were 25 mM and prepared at a pH of 8. The CE Method A (Table 1) was used for peptide mapping in a pH 2.5 phosphate buffer, as described in Section 2.3.1. Figs. 12A and B show the CE-based peptide maps resulting from the autoproteolysis of soluble CT carried out in ammonium bicarbonate and in Tris-HCl, respectively. By visual inspection, autodigestion performed in Tris-HCl buffer (Fig. 12B) resulted in much weaker signals (approx. 30 mAU on average), compared to autodigestion done in the ammonium bicarbonate buffer (approx. 75 mAU on average). The experiments shown in Fig. 12 were repeated 3 times and reproducible electropherograms were obtained for both buffers, giving confidence to the noticeable difference between the two digestion buffers. The 25 mM ammonium bicarbonate buffer at pH 8 (Fig. 12A). consistently provided the highest number of peaks with the best resolution and was thus used in all subsequent CE analyses.
![Figure 4. Structure of Sperm Whale myoglobin [8], which has no disulfide bridges.](https://thumb-eu.123doks.com/thumbv2/123doknet/12443453.335555/29.918.185.822.527.882/figure-structure-sperm-whale-myoglobin-disulfide-bridges.webp)
![Figure 9. Schematic representation of an electropherogram showing the order of elution of CE separation at pH > 2.7 [64]](https://thumb-eu.123doks.com/thumbv2/123doknet/12443453.335555/37.918.225.769.114.467/figure-schematic-representation-electropherogram-showing-order-elution-separation.webp)