HAL Id: hal-01678805
https://hal.archives-ouvertes.fr/hal-01678805
Submitted on 17 Jan 2018HAL is a multi-disciplinary open access
archive for the deposit and dissemination of sci-entific research documents, whether they are pub-lished or not. The documents may come from teaching and research institutions in France or
L’archive ouverte pluridisciplinaire HAL, est destinée au dépôt et à la diffusion de documents scientifiques de niveau recherche, publiés ou non, émanant des établissements d’enseignement et de recherche français ou étrangers, des laboratoires
Sono-crystallization of ZnSO4.7H(2)O with variation of
solution heights
Hassen Harzali, Fabien Baillon, Olivier Louisnard, Fabienne Espitalier, Arbi
Mgaidi
To cite this version:
Hassen Harzali, Fabien Baillon, Olivier Louisnard, Fabienne Espitalier, Arbi Mgaidi. Sono-crystallization of ZnSO4.7H(2)O with variation of solution heights. Chemical Engineering Journal, Elsevier, 2012, 195, pp.332-338. �10.1016/j.cej.2012.04.087�. �hal-01678805�
Sono-crystallization of ZnSO
4.7H
2O with variation of
solution heights.
Hassen Harzali 1,2, Fabien Baillon1, Olivier Louisnard 1,
Fabienne Espitalier 1, and Arbi Mgaidi 2
1Ecole des Mines d’Albi, Centre RAPSODEE, UMR CNRS 2392,
81013 ALBI Cedex 09, FRANCE. [email protected]
2Industrial Inorganic Chemistry Laboratory, Chemistry Department,
Faculty of Sciences,Tunis 1060, TUNISIA
Abstract
The effects of acoustic cavitation on crystallization of zinc sulphate hep-tahydrate was observed in a sono-reactor build-up from a large emitting area transducer located at the bottom of the vessel (sometimes referred as cup-horn reactor).
The aim of this work is to carry out measurements of both dissipated acoustic power in the sono-reactor using calorimetric method, and induction-time of crystallization of ZnSO4.7H2O. Our measurements were recorded in
the sono-reactor for different liquid phase heights ranging between 0.08 and 0.2 m, and for different electric power supplied by the generator.
The experimental results have shown that the dissipated acoustic power passes through a maximum at about 0.15 ±0.01 m, and that the induction-time passes through a minimum for the same liquid-level. The dissipated-power and the induction-time are found to be well correlated as the liquid height was varied. The acoustics of the sono-reactor was studied with linear acoustics, accounting for the wall vibrations by using the Multiphysics Mod-eling and Simulation Software (COMSOL). Theoretical dissipated acoustic powers were compared to the experimental ones. One of the motivations of this study is to assess by simulation the existence of the maximum of dissipated power in a given sono-reactor.
Key words : Ultrasound, Dissipated power, Induction time, FEM Sim-ulation, Zinc sulphate heptahydrate.
1
Introduction
The ultrasound science and technology are becoming a growing research field [1] because of a wide range of emerging applications in chemical syn-thesis, therapeutics, environmental protection, electrochemistry, processing
When a liquid is irradiated by a high-power ultrasonic wave, numerous radially oscillating micron-sized bubbles appear. The phenomenon is known as acoustic cavitation [3, 4]. The strong collapse, following the explosive ex-pansion of these bubbles, induces extreme conditions inside or near the bub-bles, which are responsible for a specific chemistry, known as sonochemistry. The bubbles repeat expansion and contraction according to the pressure os-cillation of an ultrasonic wave [5]. Some bubbles collapse violently at the contraction phase of an ultrasonic wave [3, 6]. The temperature and the pressure inside bubbles increase to 5000 K and 300 atm, respectively or more at the strong collapse [7].
Studies have been conducted on the influence of many physical properties of solutions, solvents, pressure, viscosity, temperature, surface tension and dissolved gas on sonochemical reactions [8, 9]. Frequency is one of the im-portant factors required to specify the efficiency of sonochemical reactions. Many researchers have investigated the frequency dependence of sonochem-ical reactions in the range from 20 to 1200 kHz [10]. In these experiments, the irradiation volume used ranged from 10 to 500 ml.
The intensity of the ultrasonic power was, after the frequency, the second most important parameter characterizing the ultrasonic field in any sono-chemical experiment. The measurement of ultrasonic intensity (the dosime-try of ultrasound) has been comprehensively described by Berlan and Ma-son [11]. Whereas its determination was well established for low intensity ultrasound used in diagnostics, the problem is much more complicated when high power ultrasound is used and the cavitation threshold is exceeded.
Experiments performed by Ratoarinoro and Delmas [12] were to study the effect of liquid heights and electrical input power on the chemical reaction yield in a horn-type reactor (use of piezoelectric transducer). Under these experimental conditions, the specific dissipated power (dissipated power per unit volume) was found to be almost independent from the liquid heights. But, Asakura et al. [10] has suggested in cup-horn reactors, that the sono-chemical efficiency depended on the frequency and liquid heights. The plot of sonochemical efficiency against liquid heights exhibits one or two peaks for each frequency. The sonochemical efficiency up to the first peak increased monotonically with the logarithm of the frequency, and the liquid height for the first peak was inversely proportional to the frequency. From these results, the optimum frequency for a sonochemical reactor can be determined if the liquid height is specified for scale-up of the sonochemical reactor.
Studies have been conducted and showed how important to characterize the behaviour of sonoreactors in order to identify accurately the active zones, especially those related to the cavitation events, as well as it might also shed light on an accurate picture on the reaction environment in the
sonoreac-tor [13]. In order to scale-up the sonochemical reacsonoreac-tors, it’s important to elucidate the effect of liquid heights and the ultrasonic intensity. It’s very important to compare the experimental results with numerical simulations in order to characterize the ultrasonic field propagation and to obtain the spatial distribution of the dissipated power.
Numerical simulations have also been evaluated in recent years [11, 13, 14]. An initial approach to the calculation of the acoustic field by FEM techniques was made in order to mechanically characterize a commercial 20 kHz sonoreactor. Similar results are obtained with both approaches used in this work (experimental and numerical methods) and consequently, from these results, the use of this kind of numerical simulation could be promising tool for prediction of the behaviour of new configurations.
The effect of ultrasonic power in crystallization was investigated in our laboratory [15, 16]. Crystallization with ultrasound of have shown that the induction time decreases with the dissipated acoustic power.
In this work, different measurements of dissipated acoustic power and of induction time of ZnSO4.7H2O in an existing sono-reactor (cup-horn) were
recorded for different liquid heights and for different electric powers. After, we present our simulation results compared to the experimental ones.
2
Experimental section
2.1
Experimental setup
A schematic experimental setup is shown in Fig. 1. A thermostated vessel (1500 ml) is stirred with an agitator from the top at a constant rotation speed of about 180 rpm. Ultrasound is applied from the bottom (cup-horn reactors, type Bioblock scientific) to the liquid. Different dissipated powers, obtained by different electric powers supplied by the generator in the sono-reactor, have been used.
2.2
Ultrasonic intensity
The intensity of the cavitation is obviously linked to the local ultrasonic power, which affects the cavitation regimes (stable or unstable). Conse-quently, measurement of the ultrasonic intensity is required in order to design ultrasonic reactors.
We use the calorimetric method because all the energy entering into the calorimeter is expected to be transformed into heat. The advantage of such a
Figure 1: Experimental set-up. 1: Thermostated reactor ; 2: Computer ; 3: Generator of ultrasound; 4: Temperature probe ; 5: Agitator.
method lies in the possibility of its being used beyond or below the threshold of cavitation.
This technique allows a local measurement of the ultrasonic intensity and the experiments are simple and not time consuming. In the present work, a temperature probe, with resolution of 0.01˚C, has been used in order to measure the ultrasonic intensity distribution in our cup-horn reactor.
The ultrasound power Pdiss(dissipated power) was estimated by
calorime-try and calculated using the following equation:
Pdiss= M CP
∆T
∆t (1)
where M , CP and ∆T∆t denote the solution mass, specific heat of water
and is the initial slope of the curve of temperature versus time respectively. Different measurements of ultrasonic intensity were recorded for different liquid heights (H20).
A known mass of water was added in the sonoreactor and the water heights (cm) was noted. Two ultrasonic powers delivred by the generator levels have been used and applicated to measure the dissipated power in water by the calorimetric method at ambiant temperature.
2.3
Induction time
Aqueous solutions are prepared from ZnSO4.7H2O (zinc sulphate
heptahy-drate, Sigma Aldrich 99.5%) ultra pure water (18.2 MΩ.cm). The experimen-tal apparatus used for the determination of induction time is represented in Fig. 1. Before each experiment, in order to dissolve all the solid, suspensions were heated to a temperature higher by 10◦C than the saturation tempera-ture during 5 hour. Then, the solution was rapidly cooled to a temperatempera-ture around 25◦C. Ultrasound is applied at the end of the cooling phase. The appearance of crystals was detected by the sudden increase of temperature and visually with the naked eye. The induction time tind is defined as the
time elapsed between the creation of supersaturation and the appearance of crystals. The induction time is measured as soon as the temperature 25◦C is reached. As it was mentioned in our earlier work [16]. Ultrasound is applied at this moment.
3
Results and discussion
3.1
Dissipated power
The power measurements (±3.10−4) are plotted against the heights of water wich were varied between 0.08 m and 0.2 m in the reactor for each ultrasonic power delivred by the generator (Fig. 2). The power caused by agitation is calculated using the Reynolds number Re and the power number NP given by
Baldyga and Bourne [17]. Under our experimental condition, the agitation power equals to 0.027 W. Thus, we can neglect the agitation power in the presence of the dissipated power caused by ultrasound. The experimental results in Fig. 2 have shown that the dissipated acoustic power passes through a maximum at about 15 cm and probably at about 12 cm. The dissipated-power is found to be well correlated as the liquid height was varied.
0.08
0.1
0.12
0.14
0.16
0.18
0.2
10
20
30
40
50
60
H (m)
P
diss(Watt)
Figure 2: Pdiss as a function of water heights.
3.2
Induction time
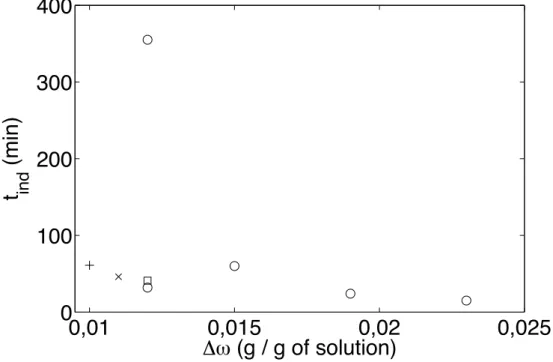
The variation of induction time with absolute supersaturation is illustrated in Fig. 4. The absolute supersaturation (∆ω = ω − ωeq(T )) is calculated
as the difference between the initial, and saturation mass fractions at the crystallisation temperature (Ref la premire publi).
3.2.1 Experiments without ultrasound for different absolute su-persaturation
In silent condition, the induction time tindis measured for different
supersatu-rations at the same solution heights (H=13.5 cm). As seen in Fig. 4 the induc-tion time decreases when absolute supersaturainduc-tion increases. This behaviour agrees with classical results on crystallization (Ref la premire publi,Lyczko).
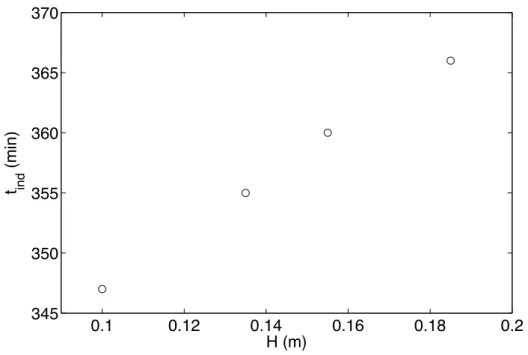
3.2.2 Experiments without ultrasound and with variation of so-lution heights 0.1 0.12 0.14 0.16 0.18 0.2 345 350 355 360 365 370 H (m) t ind (min)
Figure 3: Induction time of ZnSO4.7H2O as a function of solution heights.
In silent condition, the induction time is measured for one supersatura-tion (∆ω=0.012 g of ZnSO4.7H2O / g of solution) but with the variation of
solution heights. The experimental results in Fig. 3 found that the induc-tion time (±5 min) depends weakly on the soluinduc-tion heights (±0.02 m) in the sono-reactor...
3.2.3 Experiments with ultrasound with variation of solution heights
0,01
0,015
0,02
0,025
0
100
200
300
400
!" (g / g of solution)
t
ind(min)
Figure 4: Induction time of ZnSO4.7H2O as a function of absolute
supersat-uration for the same solution heights (H = 0.135 m) : in silent conditions (circles), ∆ω = 0.011 g of ZnSO4.7H2O / g of solution; grad 7 (cross), ∆ω
= 0.012 g of ZnSO4.7H2O / g of solution; grad 7 (stars), ∆ω = 0.012 g of
ZnSO4.7H2O / g of solution; grad 3 (box), ∆ω = 0.010 g of ZnSO4.7H2O /
g of solution; grad 7 (plus).
We obtained the same type of curve with and without ultrasound. The induction time decreases when absolute supersaturation increases (Fig. 4). This behaviour agrees with classical results on crystallization. We can ob-serve that ultrasound has a significant effect on induction time, especially at low supersaturation. This effect is less significant at high supersaturation, since nucleation is very fast anyway in this case.
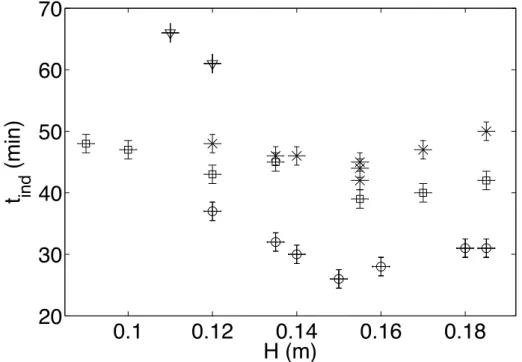
The experimental results in Fig. 5 found that the induction time depends on the solution heights in the sono-reactor wich depends on the dissipated acoustic power (Fig. 2). However, we can observe that in the maximum of dissipated power for different electric power (graduation 3 and 7) supplied by the generator (Fig. 2), the induction time will be the minimum . It’s very important to use the maximum of dissipated power in crystallization to gain in the nucleation time. But, we shoud be attentive because at heigh power,
0.1
0.12
0.14
0.16
0.18
20
30
40
50
60
70
H (m)
t
ind(min)
Figure 5: The induction time as a function of solution heights. ∆ω = 0.011 g of ZnSO4.7H2O / g of solution; grad 7 (stars), ∆ω = 0.010 g of ZnSO4.7H2O
/ g of solution; grad 3 (triangledown), ∆ω = 0.012 g of ZnSO4.7H2O / g of
solution; grad 7 (circles), ∆ω = 0.012 g of ZnSO4.7H2O / g of solution; grad
ultrasound has also an effect of abrasion on the crystals [18].
In this work, the solution was gassing once by Helium (introduced before 1 hour of the the dissolution phase) and once by Argon with keeping the same condition for experiments with ultrasound. The induction time decreases in the case of introduction of Helium in the sono-reactor and decreases also in the case of introduction of Argon alone (Fig. 5). One of the motivations of this paper is to assess by simulation the existence of the maximum of dissipated power of a given sono-reactor.
4
FEM simulation
4.1
Theoretical model
A short recapitulation of the key equations previously developed is included in the following subsections. For deeper discussion on this topic, reader is referred to our earlier work [14, 19].
4.1.1 Linear acoustics in the working liquid
The linear propagation of an acoustic wave is described by the linearization of the following Euler equations (2) and (3) :
1 ρlc2l ∂p ∂t + ∇.v = 0, (2) ρl ∂v ∂t = −∇p, (3)
where v(x, t) is the liquid velocity field associated to the acoustic wave, p(x, t) is the local acoustic pressure, and ρl, cl are the density and the sound speed
of the liquid, respectively.
We assume mono-harmonic waves at angular frequency ω. Using the complex notation, the acoustic wave and the liquid velocity field will be written as :
p(x, y, z, t) = 12[P (x, y, z)eiωt+ P∗(x, y, z)e−iωt] , (4)
v(x, y, z, t) = 1
2 [V(x, y, z)e
iωt+ V∗(x, y, z)e−iωt] . (5)
Also, Eq. (2) and Eq. (3) could be rewritten as :
iωP + ρlc2l∇.V = 0, (6)
Eliminating V between the two equations yields, the well-known Helmholtz equation can be as :
∇2P + k2
lP = 0, (8)
where kl = ω/cl is the wavenumber.
4.1.2 Vibrations of the solids
The vibrations of the reactor walls were estimated with the next equation Eq. (9), where volume forces were neglected and mono-harmonic vibrations were considered: − ρsω2Us= ∇.Σ, (9) where Σ = Eν (1 − 2ν)(1 + ν)(TrE) I + E 1 + ν E, (10) E = 1 2 h ∇Us+T ∇Us i . (11)
where ρs is the solid density, ν the Poisson ratio, I the identity tensor, Tr
the trace operator and E is the Young modulus.
Two different boundary conditions were defined to solve equation (9). The next dynamic condition was used for the solid-liquid interface, stating that the normal force per unit area exerted on the solid boundary in contact with the liquid was just the pressure of the liquid, while for the rest of the solid boundaries (as those in contact with air), the three components of the stress were ascribed to zero.
Σ.n = −P n. (12)
4.1.3 Energy dissipation
In order to account for the energy dissipation by cavitating bubbles, the next energy conservation expression was employed, assuming mono-harmonic waves in steady state:
where Pactive = Z Z Ssonotrode −1 2<(P V ∗).n dS, (14) Pbound= Z Z Sboundaries 1 2<(P V ∗ ).n dS, (15) Pdiss= Z Z Z V α|P | 2 ρlcl dV. (16)
• Pactive is the power entering the liquid through the sonotrode area, and
is termed as active power,
• Pbound is the power lost through the other (passive) boundaries of the
liquid. This quantity vanishes for either infinitely soft boundaries, or non-dissipative unconstrained elastic solid walls. This will be the case in this study so that Pbound = 0.
• Pdiss is the power dissipated in the medium, and is related to the
at-tenuation coefficient α described below. where < denotes the real part of a complex number
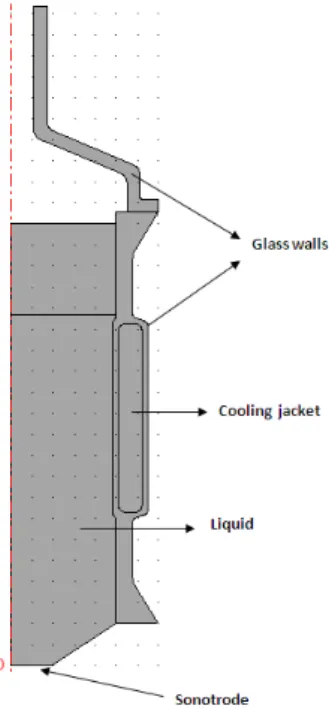
4.1.4 Experimental configuration studied
The experimental setup simulated is represented in Fig. 6 Since it presents axial symmetry, only one half of a cut plane is represented. The sonotrode (diameter 39 mm) emits from below in a liquid (differents liquid heights were used in this work) in contact with air on its upper surface, and limited laterally by thin glass walls. The sono-reactor also presents a cooling jacket to maintain the temperature constant all along an experiment. A Teflon ring prevents the fluid to leak downward and maintains the whole setup. The liquid in the reactor and in the cooling jacket is water with properties ρl = 1000 kg.m−3 and cl = 1500 m.s−1. The elastic properties are E = 73
GPa, ν = 0.17 for glass and E = 0.5 GPa, ν = 0.46 for Teflon. The liquid height was varied between 80 mm and 200 mm , counted from the vibrating surface of the sonotrode. The latter was assumed to vibrate vertically with an amplitude of 10−6 m.
4.2
Results
COMSOL Multiphysics software was used to calculate the response curves of the system, the frequency of the transducer is 20 kHz.
Figure 6: Geometry studied. Only one-half of the reactor is drawn.
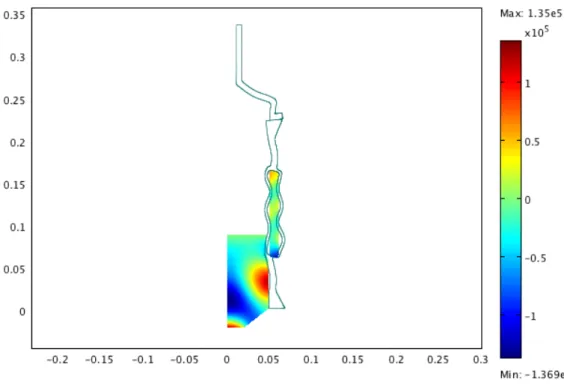
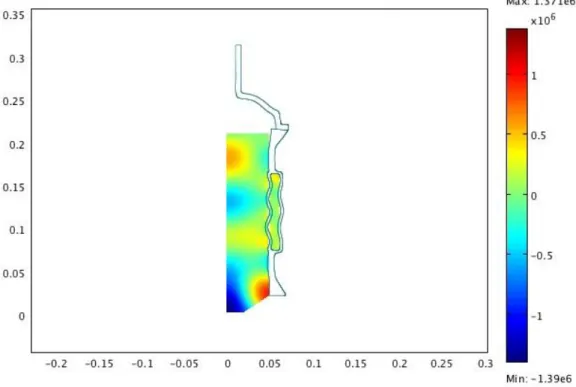
Eqs. (2), (9) and (13) were numerically solved with COMSOL Multi-physics package, where both axial 2D linear acoustics and structural me-chanics application modes were employed in order to obtain the spatial dis-tribution of the acoustic pressure in the working liquid and the deformation of the reactor walls. In this work, we varied the solution heights in the sonoreactor to find the resonnace peaks (Fig. 7, 8 and 9).
The response curves of the sonoreactor are displayed in Fig. 10. The simulation results in Fig. 10 shows 5 resonnance peaks.
We can found that there are a resonnance peak at 15.2 cm (by simulation) and from the experimental results a maximum dissipated acoustic power at this level (Fig. 2). We can found for an other level (12.3 cm ) where there is a resonnance peak and a small peak of dissipated acoustic power. There is a consistency between experiment and the power distribution by simulation.
5
Conclusion
The present results shown that, both the dissipated power and induction time varie with the solution heights in the reactor with and without ultrasound.
Figure 7: Results of simulation for the low level.
Figure 9: Results of simulation for the top level. 0.06 0.08 0.1 0.12 0.14 0.16 0.18 0.2 0.22 104 105 106 107 H (m) Volume −
• the dissipated power is maximum • the induction time is minimum
• linear acoustics predicts a resonance peak.
From these results, the use of numerical simulation is a promising tool for prediction of the behaviour of new configurations of sonoreactor. The linear acoustics-based model accounting for the vibration of the solid boundaries used in this work provides interesting results in order to design optimized sono-reactors, as it gives a qualitative idea of the acoustic field inside the re-actors (acoustic pressure amplitude seemed a bit unrealistic, especially when no attenuation was accounted for), and also provides the approximate loca-tion of the resonance frequencies.
Moreover, simulations could be enhanced at various levels. First, vibra-tions of the horn tip should be simulated in order to account for the lateral cavitation fields commonly observed during experimental work. And second, a more realistic model of attenuation by cavitating bubbles is required. In this work, we employed an arbitrary, spatially uniform attenuation factor strongly linked to the bubble repartition in the liquid, which in turn depends on the shape of the acoustic field.
References
[1] T.J. Mason. Ultrasonics Sonochemistry, 10:175–179, 2003.
[2] In Fourth Conference in Applications of Power Ultrasound in Physical and Chemical Processing. Besancon, France, May 2003.
[3] T.J. Leighton. The Acoustic Bubble. Academic Press, 1994.
[4] J.L. Reisse K.S. Suslick (Eds.) L.A. Crum, T.J. Mason. Sonochemistry and sonoluminescence. In Proceedings of the NATO Advanced Study Institute on Sonoluminescence and Sonoluminescence, 1997.
[5] F.R. Young. Cavitation. Imperial College, London, 1994.
[6] K. Yasui, T. Kozuka, T. Tuziuti, A. Towata, Y. Iida, J. King, and P. Macey. FEM calculation of an acoustic field in a sonochemical reactor. Ultrasonics Sonochemistry, 14:605–614, 2007.
[7] Y.T. Didenko, W.B. McNamara III, and K.S. Suslick. Physical Review Letters, 84:777–780, 2007.
[8] M.M. Chivate and A.B. Pandit. Quantification of cavitation intensity in fluid bulk. Ultrason. Sonochem, 2:519–525, 1995.
[9] T.J. Mason and J.P. Lorimer. Applied Sonochemistry: Uses of Power Ultrasound in Chemistry and Processing. Wiley-VCH, Weinheim, 2002. [10] Y. Asakura, T. Nishida, T. Matsuoka, and S. Koda. Effects of ultrasonic frequency and liquid height on sonochemical efficiency of large-scale sonochemical reactors. Ultrasonics Sonochemistry, 15:244–250, 2008. [11] J. Klima, A. Frias-Ferrer, J. Gonzalez-Garcia, J. Ludvik, V. Saez, and
J. Iniesta. Optimisation of 20 kHz sonoreactor geometry on the basis of numerical simulation of local ultrasonic intensity and qualitative com-parison with experimental results. Ultrasonics Sonochemistry, 14:19–28, 2007.
[12] A.M. Wilhelm J. Berlan Ratoarinoro, F. Contamine and H. Delmas. Power measurement in sonochemistry. Ultrasonics Sonochemistry, 2(1),
[13] V. Saez, A. Fras-Ferrer, J. Iniesta, J. Gonzalez-Garcia, A. Aldaza, and E. Riera. Chacterization of a 20 kHz sonoreactor. part i: analysis of me-chanical effects by classical and numerical methods. Ultrasonics Sono-chemistry, 12:59–65, 2005.
[14] O. Louisnard, J. Gonzlez-Garca, I. Tudela, J. Klma, V. Sez, and Y. Vargas-Hernndez. Fem simulation of a sonoreactor accounting for vi-brations of the boundaries. Ultrasonics Sonochemistry, 16:250259, 2009. [15] N. Lyczko, F. Espitalier, O. Louisnard, and J. Schwartzentruber. Effect of ultrasound on the induction time and the metastable zone width of potassium sulphate. Chemical Engineering journal, 86:233–241, 2002. [16] Experimental study of sono-crystallisation of ZnSO4.7H2O, and
inter-pretation by the segregation theory. Ultrasonics Sonochemistry, Ac-cepted Manuscripts, 2011.
[17] J. Baldyga and J. Bourne. Turbulent Mixing and chemical Reactions. John Wiley and Sons, 1999.
[18] A.M. Wilhelm J. Berlan N. Amara, B. Tatsimba and H. Delmas. Crys-tallization of potash alum: effect of power ultrasound. Ultrasonics Sono-chemistry, 8:265–270, 2001.
[19] Study of the influence of transducer-electrode and electrode-wall gaps on the acoustic field inside a sonoelectrochemical reactor by FEM sim-ulations. Chemical Engineering Journal, Submitted article, 2011.