Université de Montréal
Eye Disease and Mobility Limitations in Older Adults
par
Mihaela-Luminita Popescu
Département d’ophtalmologie Faculté de médecine
Mémoire présenté à la Faculté des études supérieures en vue de l’obtention du grade de Maîtrise ès sciences
en Sciences Biomédicales
Université de Montréal Faculté des études supérieures
Cette thèse intitulée:
Eye Disease and Mobility Limitations in Older Adults
Présentée par: Mihaela-Luminita Popescu
a été évaluée par un jury composé des personnes suivantes :
Mark Lesk, M.D., président-rapporteur Ellen E. Freeman, Ph.D., directrice de recherche
RÉSUMÉ
Objectif: Évaluer les défis de la mobilité chez les personnes âgées atteintes de dégénérescence maculaire reliée à l’âge (DMLA), de glaucome ou de dystrophie cornéenne de Fuchs et les comparer avec les personnes âgées n’ayant pas de maladie oculaire.
Devis: Étude transversale de population hospitalière
Participants: 253 participants (61 avec la DMLA, 45 avec la dystrophie cornéenne de Fuchs, 79 avec le glaucome et 68 contrôles)
Méthodes: Nous avons recruté les patients parmi ceux qui se font soigner dans les cliniques d’ophtalmologie de l’Hôpital Maisonneuve-Rosemont (Montréal, Canada) de septembre 2009 à octobre 2010. Les patients atteints de la DMLA ou de la maladie de Fuchs ont une acuité visuelle inférieure à 20/40 dans les deux yeux, tandis que les patients avec du glaucome ont un champ visuel dans le pire œil inférieur ou égal à -4dB. Les patients contrôles, qui ont été recrutés à partir des mêmes cliniques, ont une acuité visuelle et un champ visuel normaux. Nous avons colligé des données concernant la mobilité à partir des questionnaires (aire de mobilité et chutes) et des tests (test de l’équilibre monopodal, timed Up and Go (TUG) test). Pour mesurer la fonction visuelle nous avons mesuré l’acuité visuelle, la sensibilité au contraste et le champ visuel. Nous avons également révisé le dossier médical. Pour les analyses statistiques nous avons utilisé les régressions linéaire et logistique.
Critères de jugement principaux: aire de mobilité, équilibre, test timed Up and Go, chutes
Résultats: Les trois maladies oculaires ont été associées à des patrons différents de limitation de la mobilité. Les patients atteints de glaucome ont eu le type le plus sévère de restriction de mobilité; ils ont une aire de mobilité plus réduite, des scores plus bas au test TUG et ils sont plus enclins à avoir un équilibre faible et à faire plus de chutes que les contrôles (p < 0.05). De plus, comparativement aux contrôles, les patients ayant de la DMLA ou la dystrophie cornéenne de Fuchs ont eu une aire de mobilité réduite (p < 0.05). Les chutes n’ont pas été associées aux maladies oculaires dans cette étude.
Conclusions: Nos résultats suggèrent que les maladies oculaires, et surtout le glaucome, limitent la mobilité chez les personnes âgées. De futures études sont nécessaires pour évaluer l’impact d’une mobilité restreinte chez cette population pour pouvoir envisager des interventions ciblées qui pourraient les aider à maintenir leur indépendance le plus longtemps possible.
ABSTRACT
Objective: To examine the extent of mobility limitations in patients with age-related macular degeneration (AMD), glaucoma, or Fuchs corneal dystrophy as compared to a control group of older adults with good vision.
Design: Cross-sectional hospital-based study
Participants: 253 people (61 with AMD, 45 with Fuchs, 79 with glaucoma, and 68 controls)
Methods: Patients were recruited from the ophthalmology clinic of Maisonneuve-Rosemont Hospital (Montreal, Canada) from September 2009 until October 2010. Patients with AMD and Fuchs had to have visual acuity in the better eye of worse than 20/40 while patients with glaucoma had to have visual field deficit in their worse eye of at least -4dB. Control patients who had normal visual acuity and visual field were recruited from the same clinic. Questionnaire (life space and falls) and
performance-based (one-legged balance test, timed Up and Go (TUG) test) mobility data were collected, visual acuity, contrast sensitivity, and visual field were assessed, and the medical record was reviewed. Linear and logistic regression were used. Main Outcome Measures: Life space, balance, timed Up and Go, falls
Results: The three eye diseases were associated with different patterns of mobility limitations. Patients with glaucoma had the most types of mobility limitations as they had reduced life space, had worse TUG scores, and were more likely to have poor balance than the control group (p < 0.05). Compared to controls, patients with AMD or Fuchs corneal dystrophy had reduced life space (p < 0.05). Falls were not related to eye disease in this study.
Conclusions: Our results suggest that eye diseases, especially glaucoma, restrain the mobility of older people. It is important to further explore the impact of eye disease on mobility in this population in order to develop interventions that would help affected older adults maintain their independence.
TABLE OF CONTENTS
Résumé ... iii
Abstract ... v
Table of contents ... vii
List of tables ... x
List of figures ... xi
List of abbreviations ... xii
Acknowledgments ... xiv
CHAPTER I INTRODUCTION ... 1
I.1. Mobility in Older Adults ... 1
I.2. Specific Objectives and Significance ... 1
I.3. Organization of the Thesis ... 2
CHAPTER II LITERATURE REVIEW ... 4
II.1. Aging in Canada ... 4
II. 2. Consequences of Mobility Loss in Older Adults ... 4
II.3. Prevention of Mobility Loss in Older Adults ... 4
II.3.1. Exercise-based Interventions ... 5
II.3.2. Interventions for those with Impaired Vision ... 5
II.4. Measurement of Mobility ... 6
II.4.a. Life-space Assessment ... 7
II.4.b. “Timed Up and Go” Test ... 10
II.4.c. Balance – One Leg Standing ... 11
II.4.d. Falls ... 12
II.4.e. Other Mobility Measures ... 12
II.5. Non-visual Risk Factors of Mobility Loss in Old Age ... 14
II.6. Description of Three Eye Diseases ... 14
II.6.1. Glaucoma ... 14
II.6.3. Fuchs Corneal Dystrophy ... 16
II.7. Measurement of Visual Function Relevant to Mobility ... 17
II.7.1. Visual Acuity ... 17
II.7.2. Contrast Sensitivity ... 18
II.7.3. Visual Fields ... 18
II.8. Eye Disease and Mobility Loss...19
II.8.1. Glaucoma and Mobility Loss ... 19
II.8.2. Age-Related Macular Degeneration and Mobility Loss . 21 II.8.3. Fuchs Corneal Dystrophy and Mobility Loss ... 23
CHAPTER III METHODS ... 23
III.1. Pilot Data ... 23
III.2. Sample Size Calculation ... 23
CHAPTER IV RESULTS ... 25
Manuscript: Eye Disease and Mobility Limitation in Older Adults IV.1. Abstract ... 26
IV.2. Introduction ... 28
IV.3. Methods ... 29
IV.3.1. Study Population ... 29
IV.3.2. Data Collection ... 30
IV.3.3. Outcomes ... 32
IV.3.3. Statistical Analysis ... 33
IV.4. Results ... 34
IV.5. Discussion ... 36
IV.6. Tables ... 41
CHAPTER V DISCUSSION ... 45
V.1. Eye Disease and Mobility Loss ... 45
V.2. Strength and Limits of the Study ... 47
LIST OF TABLES
Tables in Manuscript:
Table 1: Description of four study groups ... 41 Table 2: Unadjusted mobility scores of four groups ... 42 Table 3: Linear regression results on adjusted relationship between eye disease and continuous mobility outcomes ... 43 Table 4: Logistic regression on adjusted relationship between eye disease and dichotomous mobility outcomes ... 44 Table 1: Risk factors for mobility loss ... 50
LIST OF FIGURES
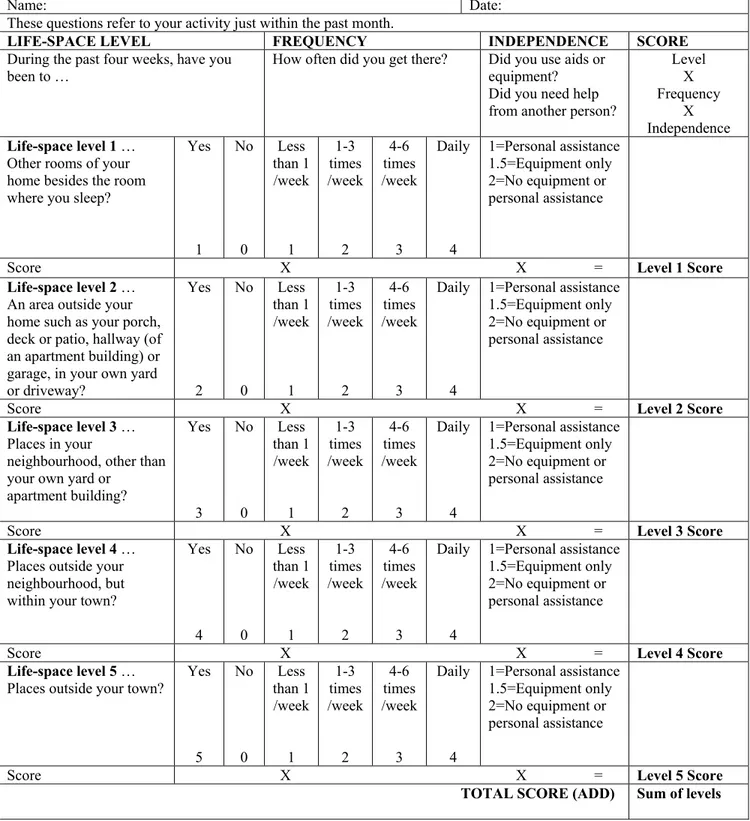
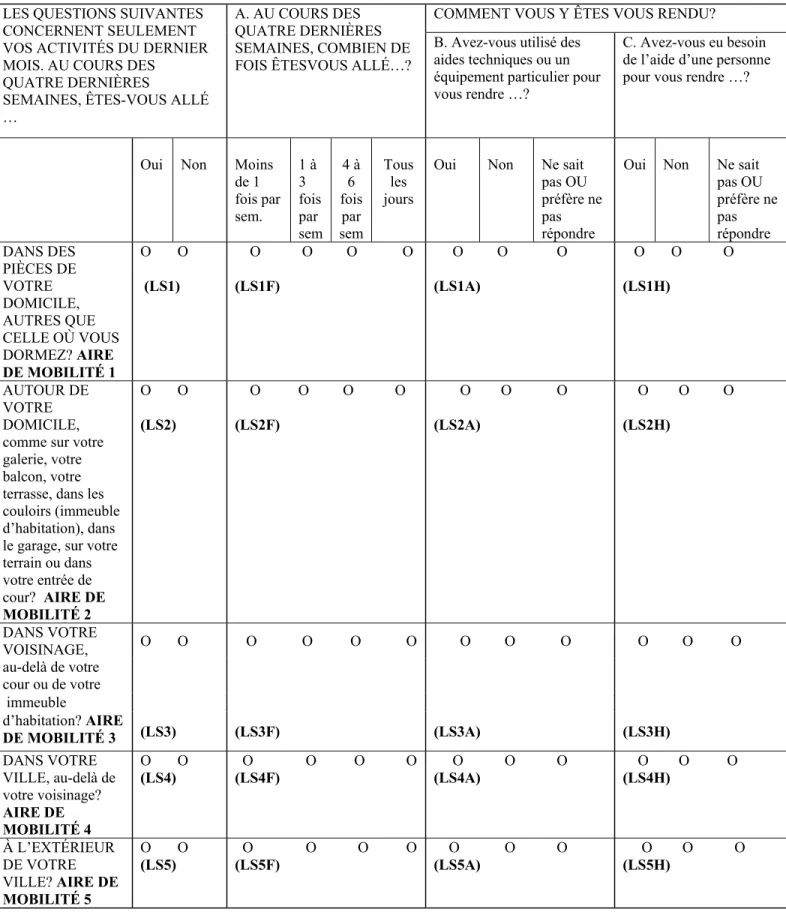
Figure 1.a.: Life Space Assessment – English Version ... 51 Figure 1.b.: Life space Assessment – French Version ... 52
LIST OF ABBREVIATIONS ADL Activities of Daily Living
AMD Age-Related Macular Degeneration β Linear Regression Coefficient CI Confidence Interval
CS Contrast Sensitivity
DMS-IV Diagnostic and Statistical Manual of Mental Disorders IV ETDRS Early Treatment of Diabetic Retinopathy Study
FCD Fuchs’ Corneal Dystrophy FDT Frequency Doubling Technology HMR Hôpital Maisonneuve-Rosemont IADL Instrumental Activities of Daily Living k Kappa Statistic
log Logarithm
logMAR Logarithm of Minimal Angle of Resolution LS Life Space
LSA Life Space Assessment
LSA-F Life Space Assessment-French version LS-C Life Space Composite score
LSQ Life Space Questionnaire LVR Low Vision Rehabilitation m Meter
MD Mean Deviation
MMSE Mini Mental State Exam n Number of subjects O&M Orientation and Mobility OR Odds Ratio
P P value
POAG Primary Open Angle Glaucoma PPA Physiological Profile Assessment
PSD Pattern Standard Deviation r Correlation Coefficient
ROC Receiver Operating Characteristic SD Standard Deviation
SF-36 Physical Functioning Scale of the Short-Form 36 SPPB Short Physical Performance Battery
TUG Timed Up and Go Test VA Visual Acuity
VF Visual Field
VA LV VFQ-48 Veterans Affairs Low Vision Visual Functioning Questionnaire- 48 items
WHO World Health Organization μm Micrometer
ACKNOWLEDGEMENTS
I would like to express my deepest gratitude to Dr. Ellen Freeman, who started me on this path, supported and guided me all through the years that I have worked with her on my Masters project; I thank her for believing in my capacity to work independently and successfully on this project. For the way in which she generously offered her valued time, her constant encouragement, her insightful wisdom, I am personally grateful.
I would like to express my gratefulness to the members of our research group, Solmaz Moghadaszadeh and Dr. Fawzia Djafari for their considerable help and advice in conducting my project.
I would like to take this opportunity to thank for the generosity in funding to Suzanne Veronneau-Troutman and the FROUM Scholarship. I am very honoured to be the recipient of this award.
I would also like to express my gratitude to the CNIB for the financial support to conduct my master project.
To my friends, who are my family And my family, who are my friends
CHAPTER I INTRODUCTION I.1. Mobility in Older Adults
The loss of mobility is a serious concern in older adults. Mobility problems have been recognized as the most frequent cause of disability in older men and women1. Shumway-Cook et al., in a cross-sectional study of 12,769 adults from the 2001 Medicare Current Beneficiary Community Survey of respondents aged 65 and over, found that half had self-reported mobility impairment2. In 2001, Statistics Canada assessed self-reported mobility impairment in adults age 18 and older. The study revealed that mobility-related disability prevalence was 31.5% for persons aged 65 and over3.
Although there are many factors that can cause mobility loss, vision plays an important role in mobility. Poor function in visual acuity, contrast sensitivity, or visual field have been related to worse mobility outcomes such as falls4, poor balance5, and car crashes6. Yet, there are very little data on how specific eye diseases are related to mobility limitations. This knowledge is necessary so that when patients have been diagnosed with an eye disease, they know what mobility risks are associated with that disease. This knowledge will also help us to know how to better help patients with eye disease with interventions designed to enhance mobility.
I.2. Specific Objectives and Significance
The present research set out to evaluate the association of eye disease with mobility limitations in patients over 65 years old. The study focused on eye diseases that are associated with age such as age-related macular degeneration, glaucoma, and Fuchs corneal dystrophy. The mobility performance of subjects with the above-mentioned eye diseases was compared to normally sighted subjects of similar age using standardized questionnaires and tests.
This thesis has 3 major objectives:
1. To determine the relationship between eye disease and life space
2. To determine the relationship between eye disease and performance-based measures such as one-legged balance and the timed Up and Go Test
3. To determine the relationship between eye disease and falls
There are many reasons why this research is important. First, given the fact that the Canadian population is getting older, the incidence and prevalence of age-related eye disease will increase considerably. Second, older people who develop mobility disability may go on to develop more severe disability and become a burden on the healthcare system and on their families. Third, this research could be used by clinicians and workers in the social services network to assist patients with eye disease by looking for signs of mobility difficulties so they can orient their patients toward eye rehabilitation services and programs. Moreover, the more we understand about the relationship between eye disease and mobility loss, the better we may be able to intervene to prevent that loss.
I.3. Organization of the Thesis
This master’s thesis is composed of 5 chapters. The literature review presented in Chapter II is structured in 8 sections which describe the aging population of Canada, the consequences of mobility loss in older adults, whether mobility loss can be prevented, how mobility is typically measured, a description of the eye diseases of interest, and what we know about the eye diseases of interest and mobility loss. Chapter III will describe pilot data and sample size calculations. Chapter IV comprises an article which has been submitted for publication entitled:
“Eye Disease and Mobility Limitations in Older Adults”. Chapter V goes into greater detail on the findings and on the clinical implications of the findings.
CHAPTER II LITERATURE REVIEW II.1. Aging in Canada
Most industrialized societies, including Canada and Quebec, are now facing a demographic shift toward an older population. Currently, 4,687,400 out of 33,739,900 people in Canada are aged 65 and over7. In Quebec, there are 1,075,467 adults over age 65 years from a total population of 7,828,879.8
According to demographic statistics, the percentage of people in Quebec aged 65 and over was 7% in 1971 and 14.6% in 2008. The predictions for 2031 indicate that 25% of the population will be over 65 years old. The median age ascended from 26 years in 1971 to 41 years in 2008, and is predicted to be 47 years in 2031.9 The aging of the population and the greater longevity of individuals will lead to increasing numbers of older people, and also, unfortunately, greater numbers of people who suffer from age-related disease.
II.2. Consequences of Mobility Loss in Older Adults
The dangers of mobility impairment are significant. Mobility disability is often the first step on the path to disability10. Mobility disability can lead to loss of independence, increased risk of cardiovascular disease11, nursing home admission12, decreased social interaction, and can increase the risk of mortality11. Therefore, it is crucial to understand the risk factors for mobility loss so that mobility loss can be prevented or delayed as long as possible.
II.3. Prevention of Mobility Loss in Older Adults
There is some evidence from randomized controlled clinical trails that mobility loss can be prevented in older adults. This is significant because the results
of the present study could be used to design interventions tailored to patients with eye disease.
II.3. 1.Exercise-based Interventions
A systematic review by Howe et al in 2007 examined the efficacy of exercise interventions designed to improve mobility in older people living in the community or in institutional care. They included 35 randomized or quasi-randomized clinical trails, which included 2883 participants. They concluded that exercise interventions do lead to improvements in mobility in older adults. The exercise routines with the greatest impact were those targeting gait, balance, and coordination. The authors warn that these results should be interpreted with caution due to the lack of homogeneity of the randomized clinical trials (RCTs) and the fact that some RCTs suffered from methodological limitations. 13
Some randomized clinical trials have been done in long-term care facilities and have also shown exercise to benefit mobility, strength, flexibility and balance. Therefore, there is some evidence that exercise can improve mobility in community and long-term care settings. However, none of these studies included people with substantial vision loss.
II.3. 2.Interventions for those with Impaired Vision
Very little research has been done to evaluate interventions to improve mobility in people with low vision. Orientation and mobility (O&M) programs are often part of low vision rehabilitation. These programs are designed to teach skills to people with low vision so that they can confidently navigate in unfamiliar surroundings or when performing tasks. However, many of these programs have been based on clinical opinion and have not been rigorously tested in RCTs. A review conducted by Virgili and Rubin only found two small quasi-randomized trials
that examined O & M programs. Neither trial found any difference between adults who received the interventions and those who did not. The goal of these rehabilitation techniques was to teach the participants new orientation and mobility skills in order to be able to cope with reduced visual data. 14
There is some RCT evidence, though, of the efficacy of low vision rehabilitation on mobility. For example, an RCT by Stelmack examined mobility as a secondary outcome. This study included 126 veterans older than 70 with a primary eye diagnosis of maculopathy and a visual acuity less than 20/100 in the better seeing eye. The primary outcome measure was the change in visual reading ability. The outcomes were measured at baseline and after a 4-month follow-up period. The out-patient rehabilitation program consisted of five weekly sessions at the low-vision clinic and one home visit. A low vision therapist and optometrist provided education and counselling, correction of refractive errors, eccentric viewing training, provision of low-vision assistive device, assigned homework, and home modifications. Mobility was assessed from answers to subsets of items in the VA LV VFQ-48 (Veterans Affairs Low vision Visual Functioning Questionnaire) and Physical Functioning Scale of the Short-Form 36 (SF-36). When compared with the control group, patients in the treatment group reported improvement in mobility (difference logOR = 0.84; 95%Cl = 0.58-1.10; p < 0.01; effect size, 1.14). 15
To summarize, there is some evidence that mobility loss we can be prevented or delayed, but more RCT evidence is needed in those with vision loss and for a greater diversity of mobility outcomes.
II.4. Measurement of Mobility
Generally speaking, mobility is defined as the ability to move purposely by walking, by using an assistive device, or by using transportation from one’s home, to the neighborhood, and to the areas outside the town.16 It is an indispensable element in maintaining independence in daily life and in preventing disability.
There are questionnaire-based and performance-based measures to assess mobility. The measures used in this project such as life-space, the timed Up and Go test, balance, and falls will be the primary focus. Other commonly used mobility measures will be then described.
II.4.a. Life Space Assessment
A global measure of mobility is life space. In 1985, May et al.17 introduced the first specific spatial measure of life-space mobility. Thirty people aged 64 to 88 who were living at home, completed a life-space diary for a month. The researchers defined life space as the zone through which a person moved over a specific period of time. A zone extended from one’s home to one’s town or geographic region. All the data written in the diaries were afterwards converted to a life-space diameter score that revealed the dimension of each subject’s mobility over a one-month period. These scores were significantly correlated with gait speed (r = 0.79, p < 0.01) and sway path measurements (r = -0.65, p < 0.01). The life space approach requires good cooperation from the participant to fill out and return the diary.
In 1990, Tinetti and Ginter 18 introduced the Nursing Home Life-Space Diameter as an adaptation for nursing home settings and as a measure of the extent and frequency of mobility among 25 skilled nursing facility residents. The data were collected via a questionnaire that was administered to the head nurse in each nursing home facility. The score indicates the frequency of a resident’s movement within his or her room and outside the room, the unit, and the facility. A lower score was associated with decreased vision (p < 0.01), presence of neurological conditions (p < 0.06), and a greater need for assistance with activities of daily living (p < 0.01).
In 1999, Stalvey et al. developed a brief, self-report questionnaire (Life-Space Questionnaire LSQ) of nine items in order to evaluate participants’ life-space during the past three days preceding the interview. The study included 242 participants older than 55 years who were recruited from eye care clinics. The objective of the study was to validate the reliability of the LSQ. The nine consecutive questions ask about
concentrically larger areas 1) room in which the person sleeps, 2) area immediately outside the home, 3) area outside the home, 4) the neighbourhood, 5) area outside the neighbourhood, 6) town, 7) county, 8) state, or 9) outside the Unites States. Participants answered with “yes”, scored as 1 or “no”, scored as 0, to all 9 questions; final individual scores were ranging from 0 to 9, larger scores suggesting larger life space. The study concluded that, in evaluating mobility, the information provided by LSQ is not redundant in comparison with other physical measurements, since the unshared variance is about 70%. Life space was significantly associated with mental status, depressive symptoms, vision (useful field of view), driving, and mobility (p < 0.05).19 The LSQ does not account for whether the participant needed assistance.
Later, in 2003, Baker et al developed the Life Space Assessment, which goes beyond the LSQ because it takes assistance into account and because it was designed to assess life space over the last month. 20 This tool assesses the spatial extent of a person in a given time, the frequency of going to different life space levels, and whether the patient required assistance from a technical device or from a person. The habits of displacement were evaluated as concentric zones which expand from the place where the person sleeps to outside one’s town during the month before the interview (bedroom, area outside the home, neighbourhood, outside the neighbourhood, outside the town). They defined a composite measure of life-space (LS-C) as being a combination of life space level attained, degree of independence, and frequency of attainment. Scores were calculated for each level by multiplying the life-space level, the degree of independence, and the frequency of attainment (see Figures 1 and 2 for English and French versions). At the end, the level-specific values were summed giving a score ranging from 0-120. Data were collected among 306 community-dwelling subjects aged 65 and older. The authors examined the test-retest reliability of the LSA data at baseline, after two weeks and six months respectively via telephone interview. The authors ascertained that the LSA revealed a high grade of stability at baseline and after two weeks (interclass correlation coefficient = 0.96), but it was sensitive to change after a 6-month follow-up period. Moreover, life space was strongly correlated as expected with measures of physical and mental health such as physical performance, activities of daily living (ADL),
instrumental activities of daily living (IADL), depression, self-reported health, and the number of comorbidities indicating its validity (p < 0.05).
The LSA was then used in a larger study. The University of Alabama at Birmingham study of Aging Life Space-Assessment (LSA)21 assessed the life-space over the month preceding the interview, taking into account not only the area, but also the frequency of movement and the assistance needed such as, special equipment or presence of another person. The 998 subjects were recruited among community-dwelling older adults (older than 65) and the follow-up period was 18 months. This prospective observational population-based study was designed to analyze the existence of associations between LSA and physical function (ADL, IADL), physical performance (Short Physical Performance Battery [SPPB]), cognition, depression and, sociodemographic factors. Life-space was associated with mobility, physical performance tests, transportation difficulty, mental status, and depression (p < 0.05).
The LSA questionnaire is both valid and reliable and has been translated into French22. The English version of the questionnaire was translated and adapted to French and then the French version was back-translated in English by five bilingual users. Discrepancies were corrected. The French-Canadian version of the Life-Space Assessment (LSA-F) was then validated by 40 French-speaking participants, age 50 years and over, who had been using a power mobility device for 2-15 months. Scores on the two versions were very similar (intra-class correlation coefficient = 0.87 for LS-C).
One cross-sectional analysis has shown that visual impairment in older adults was associated with reduced life space. This study, for which 909 participants were recruited, only measured near visual acuity (at 14 inches using a standard Snellen chart), had no information on cause of vision loss, and only examined maximal life space, which can be heavily influenced by social support. The relationship between specific eye diseases and life space has not been evaluated. 23
II.4.b. “Timed Up and Go” Test
The ability to maintain balance both while standing still and while changing directions is critical to safe mobility. One measurement commonly used to assess dynamic balance is the “timed Up and Go” (TUG) test. It is easy to administer and requires only basic mobility skills. The subject, who can use a mobility aid if necessary, is timed in seconds while rising from a chair, walking three meters, turning around, walking back and sitting back on the same chair again. The TUG test is a simple, inexpensive and broadly used method that was developed to screen basic mobility.
The initial test was developed by Mathias and colleagues24 using a subjective 5-point rating scale based on the examiner’s perception of the subject’s risk of falls. This approach was later revised by Podsialdo and Richardson25 and validated among 60 elderly patients who were compared with 10 healthy elderly patients admitted to a geriatric day hospital. The authors proposed a more objective scoring system. The score was equal to the time taken in seconds to complete the test. They found that the time was reliable and correlated well with the Berg balance scale, gait speed, and limitations in activities of daily living (p < 0.05).
A study by Shamway-Cook et al26 of 30 adults over age 65 years concluded that the TUG test is a valuable tool to identify elderly people who are prone to falls, with a sensitivity of 87% and a specificity of 87%. The authors administered the TUG under 3 conditions (TUG simple, TUG cognitive - with a subtraction task and TUG manual - while carrying a full cup of water). However, they concluded that the ability to predict falls is not increased by adding a secondary task while performing the TUG test. Moreover, the TUG plus secondary task scores did not increase the ability to identify community-dwelling older adults who are prone to falls.
One cross-sectional study tried to find the optimal cut-off of the TUG test in order to discriminate between community versus long term-care residence dwellers. Bischoff et al.27 conducted a study among 491 community-dwelling and institutionalized women older than 65 years and they concluded that values below 12 seconds best explained residency status (this threshold showed discriminative value
in the ROC-analysis with an area under the curve of 0.969). Extrapolating to clinical practice, they suggested that community-dwelling elders who need more than 12 seconds to complete the TUG test should receive early evaluation and intervention. Moreover, they found out that residential and mobility status were the strongest predictors of the timed up and go test (p < 0.001) explaining 54% of the variability in TUG times.
II.4.c. Balance - One Leg Standing
The one-leg standing test is one of the balance tests most frequently used to assess postural steadiness in a static position by quantitative measurement. 28 The test is easy to administer; however there are many variations of the one-legged test such as opening/closing the eyes, leg selection, number of trials allowed, and number of seconds of testing. Performance on this test is associated with many adverse outcomes like falls, limitations in activities of daily living, and comorbidities such as osteoporosis.
For example, Vellas et al. conducted a 3-year longitudinal study among community-living volunteers older than age 60 years in order to examine if the one-leg standing test is a predictor for falls and injurious falls. They concluded that the inability to maintain balance on one leg for 5 seconds appears to be a significant predictor of injurious falls (relative risk = 2.13; 95% CI = 1.04, 4.34; p = 0.03), but not to all falls. The authors cautioned that it is difficult to find a unique risk factor for falls or fall injuries since there are so many factors involved in falling. 29
In a prospective study involving 1-year of follow-up conducted in Canada in 1994, Maki et al. found a relationship between decreased one-leg standing time and falls. They administered the balance test to 100 volunteers older than age 62 years and measured spontaneous postural sway, induced anterior-posterior sway, induced medial-lateral sway, anticipatory adjustments preceding volitional arm movements, timed one-leg stance, and performance on a clinical balance assessment scale. Lateral stability was found to be the single best predictor of future falling risk. 30
Overall, according to Michikawa and colleagues, after reviewing almost 500 articles which focused on the one-leg standing test and its implications, there is an association between the one-leg standing test time and falls, declines in ADL, and osteoporosis. In conclusion, this test can be used as a practical tool to screen the elderly for falls risk and frailty.31
II.4.d. Falls
Falls are a major health care concern for older adults. Studies indicate that about one third of older adults living in the community fall every year. 32
Frequency of falls can be assessed by simply asking the person to recall falls over the last 3, 6, or 12 months, by asking people to mail back monthly postcards reporting the occurrence of falls, or by asking people to keep a daily diary using a customized calendar. Having people keep a diary is considered the gold standard of falls assessment. Having people retrospectively recall falls will likely lead to an underestimate of falls. A 12 month recall has been shown to be better than a 3 or 6 month recall. 33
Older adults who fall are at a greater risk of hospitalization34, nursing home admission35, and death36. A fall can also lead to a fear of falling, which may result in decreased mobility37. Research and strategies to prevent falls are necessary.
II.4.e. Other Mobility Measures
The Short Physical Performance Battery (SPPB)38 is a composite physical performance measure which evaluates gait, balance, and lower extremity strength and endurance. The final score of this test is given by summing the scores obtained by various tests such as 1) time able to stand with feet together, in the side-by-side, semi-tandem, and tandem positions, 2) 2.44 meter walking speed (8-feet), and 3) the ability to rise from a chair 5 times without using the arms. Each task is graded from 0
to 4, with 0 being the inability to perform the task and 4 being the best performance. The composite score of SPPB ranges from 0 (worse performance) to 12 (best performance). This SPPB was described for the first time by Guralnik et al.38 In a cohort of 5,174 persons aged 71 years and older, they administered the SPPB in the home and they evaluated the self-reported physical performance (ADLs, ability to walk up and down stairs one floor, and ability to walk a half a mile without help). Scores on the three performance tests of SPPB were significantly correlated (p < 0.01). The authors concluded that the SPPB is useful to distinguish a gradient of risk for mortality, nursing-home admission and disability in older people and that information provided by self-reported and performance measurements of mobility is complementary, and that both contribute to an understanding of the functional status of older adults.
Another test sometimes used to assess mobility limitations is the ability to walk 400 meters (m) at usual pace. Chang et al.39 in a longitudinal study of 21 months of follow-up found that elderly people with functional limitations have a high rate of loss of ability to walk 400m at a usual pace. They enrolled 101 community-dwelling older adults aged 75 to 85 who were mobile but at greater risk to develop future disability (baseline SPPB = 4-9). Only 62 people participated in the follow-up (the differences between those lost to follow-up and those who were being followed-up were not statistically significant). After the follow-followed-up period, 34% of the participants developed mobility disability. They found that the time required to walk 400m at baseline is a significant predictor of mobility loss at follow-up (OR = 1.6 per 1-minute difference, 95% Cl = 1.04-2.45).
The disadvantage of the SPPB and the 400m walk is that they take a longer time to administer than the other mobility measures I described. In addition, the 400m walk is difficult to administer in a hospital setting in which space is limited and safety is a concern.
II.5. Non-visual Risk Factors of Mobility Loss in Old Age
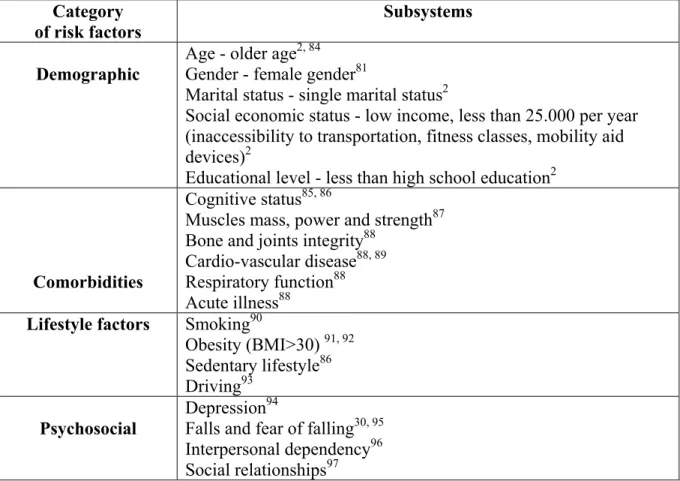
There are a variety of non-visual factors that can increase the risk of mobility loss in older age. Table 1 (page 49) summarizes the most consistent non-visual risk factors listing them in the following categories: demographic, comorbid conditions, lifestyle, and psychosocial.
The goal of this study is to determine the ocular causes of mobility loss in older adults. However, this table will be used to determine the factors that may confound the relationship between eye disease and mobility loss.
II.6. Description of Three Eye Diseases
The focus of this thesis is on: glaucoma, age-related macular degeneration, and Fuchs corneal dystrophy.
II.6.1. Glaucoma
Glaucoma is the second leading cause of blindness in the world, according to the World Health Organization.40 The term glaucoma includes several types of diseases, all being characterized by progressive loss of retinal ganglion cells leading to characteristic structural damage to the optic nerve and loss of visual field. Vision loss due to glaucoma often first affects peripheral visual field and then can progressively also affect central visual field.
Glaucoma is categorized as open-angle or closed-angle, and each of these types can be primary (when the cause is unknown) or secondary (the cause results from another disorder). A third type is congenital glaucoma.
The vision loss due to glaucoma is irreversible. In Canada, in 2002-2003, based on a self-report glaucoma study, an estimated 409,000 people were affected with glaucoma, with a prevalence of 2.7% in subjects older than 40 years and 11% in
people older than 80 years.41 Moreover, this is likely to be an underestimate because other research has found that half of people with glaucoma are unaware of their disease. 42
Glaucoma treatment aims to reduce the intraocular pressure. It cannot cure the condition, but it can considerably slow or temporarily stop its progress. Glaucoma can be treated with medication, laser or conventional surgery.
Topical glaucoma medication such as eye drops, eye ointments, or inserts are the most prescribed. Depending on the mechanism of action, there are many types of topical medications (miotics, beta-blockers, prostaglandins analogs, carbonic-anhydrase inhibitors and alpha-adrenergic agonists), each achieving different purposes with the goal of lowering the intraocular pressure. Oral medication can be also used for the same purpose.
The goal of laser treatment is to improve the flow or outflow of aqueous in the eye, or to reduce the production of aqueous in order to decrease intraocular pressure. There are three types of techniques: trabeculoplasty, iridotomy, or cyclophotocoagulation. The goal of surgical treatment is to facilitate the flow of eye fluid by either filtration surgery or seton surgery.
II.6.2. Age-Related Macular Degeneration
Age-related macular degeneration (AMD) is the leading cause of irreversible low vision in developed countries and the leading cause of legal blindness among older people in North America. Almost one million Canadians currently have early AMD with 250,000 having an advanced form of the disease and 64,000 Canadians being blind due to AMD in 2006. The number of people suffering from AMD is expected to double by 2031.43 The incidence, prevalence, and progression of all forms of AMD increase with advancing age. 44
The pathological abnormalities in AMD are most pronounced in the central part of the retina, in the area centralis, particularly in the central macula, which is
responsible for seeing fine details. There are two types of AMD: non-exudative (dry) AMD and exudative (wet) AMD.
Exudative or neovascular AMD is the most damaging type of AMD. It results from abnormal proliferation of blood vessels beneath the retina in a process called choroidal neovascularization. Although it affects only 10% of those with AMD, this type is responsible for 90% of severe vision loss associated with this disorder.45 Treatment options include laser photocoagulation, photodynamic therapy, or injection of intraocular vascular endothelial growth factor (VEGF) inhibitors.
Generally speaking, non-exudative AMD progresses quite slowly and is usually less severe than the exudative type. For non-exudative AMD, treatment options include the use of antioxidants and mineral supplements. 46
II.6.3. Fuchs Corneal Dystrophy
Fuchs corneal dystrophy (FCD) is a relatively common, bilateral, often asymmetric and slowly progressive eye disease in which the inner lining of the cornea, the endothelium, changes structure and function and results in swelling, pain and loss of vision. It is an inherited autosomal dominant disorder with incomplete penetrance that is up to 3 times more frequent in woman. 47
FCD is a progressive disorder with a typical symptomatic onset in the fifth or sixth decade of life with near visual acuity being the most affected at the beginning. As an age-related eye disease, FCD will continueto increase in prevalence in our aging population. Reliable prevalence estimates of FCD are not available as population-based studies have not included FCD.
The patient’s vision is usually unaffected during early stages of disease, but as the severity increases, patients experience foggy or blurred vision, first only on awakening and, then, throughout the day, eye sensitivity to light and to glare, sandy or gritty sensation when blinking and, fluctuating vision. In advanced stages, patients may experience blurriness or haziness that does not clear throughout the day, severe visual impairment and pain from epithelial blisters.
Hypertonic saline eye drops or ointments that absorb the excessive fluid out of the cornea are used to relieve symptoms of FCD in the beginning. However, the only cure for Fuchs’ dystrophy is a corneal transplant (penetrating keratoplasty or deep lamellar keratoplasty). Without a corneal transplant, a patient may become blind or have severe pain and very impaired vision. Corneal transplant can result in substantially improved vision and relief of symptoms with 94% achieving a visual acuity of 6/12 or better at three months post-operation. 48 However, transplant rejections can occur and corneal tissue availability can be a problem. 49
II.7. Measurements of Visual Function Relevant to Mobility
Measures of visual function important to mobility that are affected by eye disease including visual acuity, contrast sensitivity, and visual field are described below.
II.7.1. Visual Acuity
Visual acuity is the most commonly used measure of visual function. It is “a measure of the spatial resolving power of the visual system”. 50 Distance visual acuity is typically measured by having a person read, from a distance of 2-4 meters, a standardized chart of high-contrast letters that gradually decrease in size. Most researchers currently use the Early Treatment of Diabetic Retinopathy Study (ETDRS) chart to measure visual acuity, which consists of 14 rows with 5 letters per row and covers a 20-fold range of letter size. The standard for normal best-corrected acuity is 20/20 (in feet), 6/6 (in meters) or 0.0 (in logMAR), although some older adults have vision much better than this level. 51 Visual acuity can be measured with normal correction (habitual) or with optimal correction (best-corrected) depending on the goal.
II.7.2. Contrast Sensitivity
Contrast sensitivity is “the inverse of a measure of the lowest contrast, or difference in luminance across borders, an observer can detect”. 50 Diseases like cataract, glaucoma, macular degeneration, and multiple sclerosis often limit contrast sensitivity. Ideally, contrast sensitivity is measured in a laboratory setting using “patches of bars that vary over a wide range of sizes” allowing one to construct a contrast sensitivity function. 50 However, for epidemiological research on large groups of people, contrast sensitivity is typically measured using the Pelli-Robson chart which utilizes a single large letter size in which the letters gradually decrease in contrast. This chart reflects contrast sensitivity “near the peak of the contrast sensitivity function”. 50 Although contrast sensitivity and visual acuity are moderately correlated, contrast sensitivity does provide additional information and is often “a better predictor of performance than acuity”. 50
II.7.3. Visual Fields
The visual field is the “spatial extent over which the visual system is sensitive to light”.50 The visual field can be divided into three regions: macular, central, and peripheral region. Many diseases, if severe, can affect the visual field. The visual field is typically measured using an automated static perimetry device in which small spots of light are shown on a uniform background in all of the locations of the visual field. The test does not involve character recognition or resolution, but only the detection of light at varying intensities. Visual field testing “is important because it is the only clinical test that evaluates vision outside the macula”, or outside the point of fixation. 50 Frequency-doubling technology (FDT) was developed in 1997 and allows for fast and effective detection of visual field loss. FDT utilises the mechanism described by Kelly in 1966, the frequency-doubling illusion, in which a sine wave grating of low spatial frequency undergoing counterphase flicker at high temporal
frequency appears to the observer to have double the number of bars than are actually present. 50
The FDT perimeter offers two types of test patterns, screening (C-30) and threshold tests (C-20 and N-30 which detect what is the minimum contrast that will evoke a response from the patient). The C-20 presentation pattern tests the central 20º with 17 stimulus locations, made up of four 10º-targets per quadrant and a circular 5º central one. Two additional points, one presented above and the other below the horizontal midline positioned between 20º and 30º in the nasal field, are incorporated in the N-30 test. At the end of each eye examination, the fixation point is moved temporally in order to test nasal points by redirecting the fixation point 10 º temporally.
FDT provides two global indices to generally summarize the visual field results for threshold tests: mean deviation (MD) and pattern standard deviation (PSD). MD represents the average sensitivity deviation from a normal healthy person of the same age. PSD indicates localized loss, showing how evenly the field loss is spread across the visual field.
The advantages of this technique are that the test is rapid, takes one minute for screening and five minutes for the threshold determination, and it is not influenced by pupil size.
The disadvantages are that patients with poor cognitive abilities can have difficulty understanding the instructions and it is less capable of discovering early scotoma in AMD patients or in discovering visual field loss in certain neuro-ophthalmologic diseases. 52
II.8. Eye Disease and Mobility Loss II.8.1. Glaucoma and Mobility Loss
There has been little research done examining mobility limitations in patients with glaucoma.
Turano et al compared the mobility performance of 47 glaucoma patients to normal-vision subjects who were of similar age. They evaluated 1) walking speed through a predefined course with obstacles to be avoided, 2) if the subjects reported a fall or had a fear of falling in the year preceding the evaluation, and 3) vision (visual acuity, contrast sensitivity and, monocular and binocular visual fields). They found that people with glaucoma had, on average, a reduced walking speed, orientation problems and an increased likelihood of bumping into objects, but the differences were not statistically significant when compared with people with normal vision. It is possible that this study was underpowered with only 47 patients in each group. 53
In a population-based observational study, Friedman et al. investigated the relationship between glaucoma and mobility limitations. They used 1,214 people older than 74 years already enrolled in the Salisbury Eye Evaluation Project. Mobility was assessed using a predefined course which subjects had to cover as quickly and safely as possible while avoiding all obstacles, along with three other tests: climbing stairs, walking a straight 4-m course and a 30-second timed stand. They measured visual field, visual acuity and contrast sensitivity. After adjustment for demographic and health variables, they found that people with bilateral glaucoma had decreased mobility performance, walking more slowly and having more bumps on the mobility course. Walking speed through the obstacle course was 2.4 meters/minute slower for those with bilateral glaucoma compared to people without glaucoma (p < 0.05). Moreover, people with bilateral glaucoma experienced 1.65 times the number of bumps when compared with persons without glaucoma (p < 0.05). 54 How these results translate into real-world mobility difficulties is unknown.
A study conducted by Shabana et al examining 35 primary open-angle glaucoma (POAG) patients and 21 age-matched normal subjects demonstrated that individuals with POAG sway more when standing than normal individuals. Moreover, the greater sway is associated with more vision damage, indicating the existence of a visual contribution to posture at all stages of glaucoma. 55 These findings are consistent with those of another study conducted by Black et al in a larger sample of POAG patients. Greater sway was associated with increasing VF impairment in the better eye. 56
One of the consequences of poor balance and/or an increase in bumping into things may be more frequent falls. Patients with glaucoma are at an increased risk of falls according to two studies. 57, 58 In a cross sectional survey among 3,654 community-dwelling older adults aged 49 or older in Australia, the frequency of falling was associated with posterior subcapsular cataract and use of nonmiotic glaucoma medication. Haymes et al. evaluated the frequency of falls (self-reported) during the year preceding the evaluation of 48 glaucoma patients when compared with 47 controls. After adjusting for age, gender, body mass index, polymedication, and better eye Humphrey Field Analyzer (HFA) MD, glaucoma patients had over 3 times the odds of falling (OR = 3.71; 95%CI = 1.14-12.05) at least once in the previous 12 months. 58 This very large odds ratio should be confirmed in further research.
More research is needed on how real-world mobility is impacted in people with glaucoma.
II.8.2. Age-Related Macular Degeneration and Mobility Loss
Similarly, few studies were found that examined the mobility of people with AMD.
A study by Wood investigated postural stability and gait characteristics of older adults with AMD and the visual parameters (binocular high-contrast visual acuity, contrast sensitivity, and visual field) associated with postural stability and gait. This study included 80 individuals older than 59 years with an AMD diagnosis as the unique cause of vision impairment. Postural stability was assessed by asking the participant to stay as still as possible for maximum 30 seconds on foam and firm surfaces. Information on anterior-posterior and mediolateral sway was assessed during this time. Gait was evaluated by measuring stride length, double-support time, step width, and walking velocity through a 12-m mobility course at a self-selected and comfortable pace. In the separate models, contrast sensitivity, visual acuity, and visual field loss were all significantly correlated with postural stability on the foam
surface; in the multivariate model only contrast sensitivity was statistically associated with postural stability on the foam surface. None of the vision variables were correlated with sway on the firm surface. 59 These findings agree with those of Waterloo Vision and Mobility study conducted by Spaulding et al. which examined specific gait characteristics of AMD-patients and concluded that these patients have shorter stride length and longer time for stride and stance. In this study, Spaulding recruited 20 AMD patients and 20 age-matched controls. Gait adaptation strategies were evaluated with a 6-m path with different texture of surface: compliant, uneven, or shiny. 60
A cross-sectional observational study of 166 adults conducted by Cruess et al. evaluated the burden of patients with neovascular AMD when compared with control subjects via telephone surveys. The authors used standardized questionnaires to assess general health and vision specific quality of life and also asked questions to determine the rate of accidents, falls, falls-related injuries, etc. Subjects with AMD had more than twice the need for assistance with activities of daily living (p = 0.013) and an almost three times higher rate of falls (p = 0.014) when compared with controls. 61 However, these results were not adjusted for age and since there was a very large difference in age between those with AMD and those without AMD, it is likely that these results are confounded.
Hassan et al. investigated how AMD affects mobility performance and which are the vision determinants of mobility among 21 subjects with AMD and 11 age-matched controls. Mobility was assessed by examining the walking speed on a 20-m straight, unobstructed course and then the number and type of obstacles contacted during a high-density indoor obstacle course. Vision was assessed through habitual visual acuity, contrast sensitivity, and binocular visual field. There was no difference between walking speed and obstacle contact on the mobility course between the two groups. 62 However, this study may have been underpowered to detect differences with such a small sample size.
Impaired vision is an important and independent risk factor for falls.63 Studies have evaluated the risk of falls among patients with AMD. For example, Szabo et al conducted a study in Vancouver among 545 community-dwelling women, between
70 and 92 years old, divided into three groups: a group of 115 people with exudative AMD and two control groups, 54 community-dwelling women without exudative AMD drawn from the same community (non-AMD cohort) and 341 community-dwelling Australian women (Australian normative cohort). They evaluated the risk of falls using the short-form Physiological Profile Assessment (PPA), which provides a fall risk index score and contains five items: vision, peripheral sensation, lower limb strength, reaction time and body sway. The mean fall-risk index score in the AMD cohort (3.20) was significantly greater than that of the non-AMD cohort. 64
II.8.3. Fuchs Corneal Dystrophy and Mobility Loss
There are no studies that we are aware of that have looked at mobility limitations among people with Fuchs corneal dystrophy.
CHAPTER III METHODS
The methods for this project are presented in detail in the manuscript in Chapter IV. Therefore, in this section, pilot data and the sample size calculations that were used to plan this study are presented.
III.1. Pilot Data
Because life space had rarely been studied in patients with eye disease, we collected limited pilot data in the fall of 2008 to determine the variability of the life space scores in patients with and without AMD. Over a 3-week period, pilot data were collected on life space scores from 16 patients with AMD and 22 similarly-aged patients who did not have AMD and who had good vision. Although this is a small sample of patients, we found evidence that the AMD group had substantially
decreased LS-C scores compared to the group without AMD (average difference = 8.5, SE = 7.4). We also saw good variability in LS-C scores in our study population (range 18-110).
III.2. Sample Size Calculation
We performed sample size calculations for the four outcomes of interest in order to achieve 80% power to detect associations of the following magnitudes. For the LS-C outcome, we required 64 people per group in order to detect a difference in LS-C scores of 10 assuming a SD of 20. For the TUG test, we required 64 people per group in order to detect a difference in times of 3 seconds between groups assuming a SD of 6. For the one-legged balance test, we required 49 people per group to detect a 2.6-fold difference in proportions of people with poor balance between groups (15% versus 40%). Finally, for falls, we required 58 people per group to detect a 2-fold difference in proportions of people who fell in the last year (25% versus 50%). These calculations all assume a 5% alpha and were made with the PS Power and Sample Size Program (Vanderbuilt, TN, USA). Data used for these calculations are based on reasonable assumptions based on our pilot data, other literature, and what we believed to be clinically significant differences.
CHAPTER IV RESULTS
Eye Disease and Mobility Limitations in Older Adults
Mihaela L. Popescu, MD 1, Hélène Boisjoly, MD, MPH 1,2, Heidi Schmaltz, MD 3, Marie-Jeanne Kergoat, MD 4, Jacqueline Rousseau, PhD 4, Solmaz Moghadaszadeh, BSc 1, Fawzia Djafari, MD, MSc 1,2, Ellen E. Freeman, PhD 1,2
1 Centre de Recherche, Hôpital Maisonneuve-Rosemont, Montréal, Canada; 2 Département d’ophtalmologie, Université de Montréal, Montréal, Canada; 3 Department of Geriatric Medicine, University of Calgary, Calgary, Canada; 4 Centre
de Recherche, Institut universitaire de gériatrie de Montréal, Montréal, Canada
Financial Support:
CNIB New Investigator Grant, Toronto, Canada
Canadian Institutes of Health Research Grant IAP-98996, Ottawa, Canada Fonds de Recherche en Santé du Québec salary award (Dr. Freeman) Fonds de recherche en ophtalmologie de l’Université de Montréal salary award
(Dr. Popescu)
The funding organizations had no role in the design or conduct of this research. No conflicting relationship exists for any author.
Running Head: Eye Disease and Mobility Limitations Reprint Address:
Ellen Freeman, PhD Hôpital Maisonneuve-Rosemont Recherche ophtalmologie, CSA, RC, F131
5415 boulevard de l’Assomption Montréal (QC) H1T 2M4
ABSTRACT
Objective: To examine the extent of mobility limitations in patients with age-related macular degeneration (AMD), glaucoma, or Fuchs corneal dystrophy as compared to a control group of older adults with good vision.
Design: Cross-sectional hospital-based study
Participants: 253 people (61 with AMD, 45 with Fuchs, 79 with glaucoma, and 68 controls)
Methods: Patients were recruited from the ophthalmology clinic of Maisonneuve-Rosemont Hospital (Montreal, Canada) from September 2009 until October 2010. Patients with AMD and Fuchs had to have visual acuity in the better eye of worse than 20/40 while patients with glaucoma had to have visual field deficit in their worse eye of at least -4dB. Control patients who had normal visual acuity and visual field were recruited from the same clinic. Questionnaire (life space and falls) and performance-based (one-legged balance test, timed Up and Go (TUG) test) mobility data were collected, visual acuity, contrast sensitivity, and visual field were assessed, and the medical record was reviewed. Linear and logistic regression were used. Main Outcome Measures: Life space, balance, TUG, falls
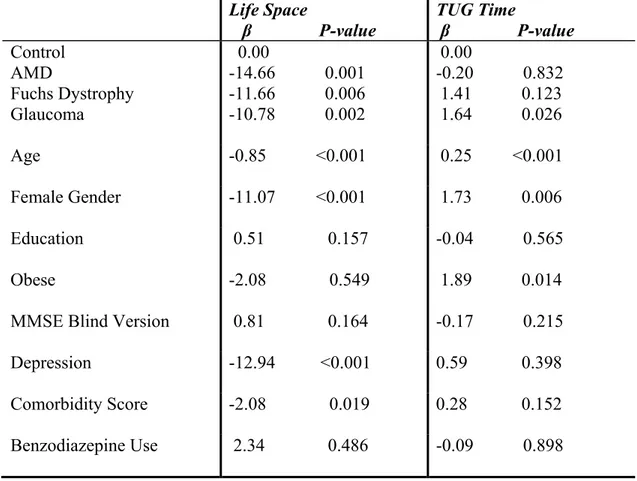
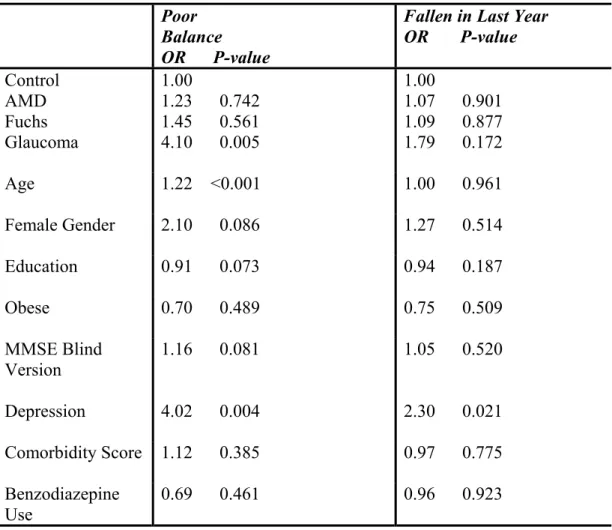
Results: The three eye diseases were associated with different patterns of mobility limitations. Patients with glaucoma had the most types of mobility limitations as they had reduced life space, had worse TUG scores, and were more likely to have poor balance than the control group (p < 0.05). Compared to controls, patients with AMD or Fuchs corneal dystrophy had reduced life space (p < 0.05). Falls were not related to eye disease in this study.
Conclusions: The results suggest that eye diseases, especially glaucoma, restrain the mobility of older people. It is important to further explore the impact of eye disease on mobility in this population in order to develop interventions that would help affected older adults maintain their independence.
INTRODUCTION
The impact of age-related eye disease on mobility is an important area of research given the aging of the population and the importance of mobility in the prevention of disability 10 and mortality 11. Yet, we are only beginning to understand the mobility limitations of people with eye disease. Friedman et al found that people with bilateral glaucoma were slower and bumped into more objects on a mobility course but the real-world implications of these findings are not known 54. Some small studies have been done on patients with age-related macular degeneration (AMD) and have mainly focused on falls and postural stability 59, 61, 62. We are unaware of any studies examining the mobility problems of people with Fuchs corneal dystrophy. More research is needed on how different eye diseases are associated with a range of mobility limitations.
The first objective was to comprehensively examine several measures of real-world mobility performance (such as life space, balance, timed Up and Go test (TUG), and falls) in people with one of three common age-related conditions (AMD, Fuchs corneal dystrophy, and glaucoma) compared to a control group. These three age-related diseases were chosen because they have very different profiles of vision loss that might impact mobility in different patterns. It was hypothesized was that all three eye diseases would be associated with the four mobility limitations but that diseases with a larger impact on central vision (AMD and Fuchs) would have bigger association with restricted life space whereas diseases with a larger impact on peripheral vision (glaucoma) would have bigger associations with falls, balance, and the TUG test. The second objective was to determine whether any relationships
between eye disease and mobility were primarily explained by visual acuity, contrast sensitivity, or visual field.
METHODS
Study Population
All participants were recruited from the ophthalmology clinics at Maisonneuve-Rosemont Hospital in Montreal, Canada, between September, 2009, and October, 2010. Three members of the research team (MP, SM, FD) reviewed patient files for eligibility each day.
All patients had to be 65 or older. Furthermore, the patients with a clinical diagnosis of AMD, Fuchs, or glaucoma had to have at least some vision loss. Specifically, the AMD and Fuchs patients had to have disease in both eyes and to have best corrected visual acuity worse than 20/40 in their better eye. Glaucoma patients had to have the disease in both eyes and had to have a visual field mean deviation worse than or equal to -4dB in their worse eye. All glaucoma types were recruited. The three groups with eye disease were allowed to have other eye diseases. Finally, the controls had to have best corrected visual acuity of 20/40 or better in the better eye and a visual field in the worse eye better than -4dB. Controls either had no current eye disease (63%) or they had non-visually impairing conditions such as early cataract (15%), early AMD (4%), ocular hypertension (5%), blepharitis (5%), or other (8%). People who had received eye surgery, laser, or an intra-vitreal injection in the last three months were enrolled after a 2-3 month delay so that their mobility would not be affected by their recovery. Patients also had to score 10 or better on the Mini-Mental State Exam Blind Version to optimize the
reliability of the collection of the self-reported data. The Blind version of the MMSE omits eight items that rely on vision and has been validated against the original version 65. A score of 10 on the Blind version corresponds to a score of 18 on the original version, which was used in previous vision research on older adults 66.
There were 420 patients who appeared to meet eligibility criteria from a review of the medical records. Of the 420 patients, 300 patients accepted our invitation to be in the study (71%), 101 refused (24%), and 19 (5%) were not capable of responding for themselves. Of the 300 who accepted, 253 people met final eligibility criteria including 61 with age-related macular degeneration (AMD), 79 with glaucoma, 45 with Fuchs corneal dystrophy, and 68 people without significant eye disease. Participants were paid $10 for their participation and signed a consent form. The project was approved by the Ethics Committee at the Hospital and the research conformed to the tenets of the Declaration of Helsinki.
Data Collection:
Data were collected in a 1-1.5 hour session by one of three trained research personnel. Participants first answered questions on demographics (age, gender, education), mobility, and health. Then they performed brief mobility, clinical, and vision tests. The medical chart was also reviewed.
Mobility
Questionnaires and performance-based tasks were performed to assess four different mobility outcomes. The Life Space Assessment (LSA) was used to measure the spatial extent of participants in a given month 20, 22. The LSA takes into account the
frequency of going to different life space levels (bedroom, driveway, within neighborhood, outside neighborhood but within town, out of town) and whether assistance was required to get to those levels. A composite score (LS-C, range 0-120) is calculated which combines information on the life space level, the degree of independence, and the frequency. The reliability and construct/criterion validity of this questionnaire have been published 20. People were asked if they had fallen in the last year, a fall being defined as unintentionally coming to rest on the ground or on some other level. Balance was assessed using the one-legged balance test in which the person is asked to stand on the leg of choice with eyes open for up to 30 seconds 29. People who cannot stand for 5 seconds on one leg are at an increased risk of having an injurious fall 29. Finally, the timed “Up and Go” (TUG) test was performed in which a person is asked to rise from a seated position, walk 3 meters, and return to the seat while being timed 25. On previous research studies, the TUG test was found to have good reliability and was correlated with gait speed, activities of daily living limitations, and balance 25. Reasons for not doing either the balance test or the TUG test were noted (e.g. safety concern of participant or researcher, refusal for non-safety reasons such as pain).
Health and Anthropometric Measures
Participants were asked to self-report a physician diagnosis of 13 chronic comorbid conditions (e.g. stroke, Parkinson’s, heart disease, diabetes) and whether they were currently taking benzodiazepines, a potential falls risk factor 67-69. A sum of the total number of chronic conditions was used to indicate comorbidity, as has been done in previous research 54. Depression was assessed using the Geriatric Depression
15-item Scale 70,71. A score of 5 or greater was used to indicate depression 72. Cognitive status, as mentioned previously, was measured using the Mini-Mental State Exam Blind Version which excludes eight items that rely heavily on vision for a total maximum score of 22 65. Height and weight were measured without shoes using a Detecto balance scale with height rod (Detecto Medic, Brooklyn, NY). Body mass index was calculated as kg/m2. Obesity was defined as a body mass index of 30 kg/m2 or greater.
Vision and Eye Disease
Binocular habitual visual acuity was measured using the ETDRS chart with illuminated light box at 2 meters or at 1 meter if the participant could not read any letters at 2 meters 73, 74. Letter by letter scoring was performed with scores at 2 meters converted to scores at 1 meter by adding 15. Contrast sensitivity was measured using the Pelli-Robson chart at 1 meter for each eye 75. Visual field was measured using the Humphrey FDT test for each eye 76. The medical record was reviewed and information on severity of eye disease and coexisting eye disease was recorded. Those who could not perform the FDT test because of advanced eye disease had their last visual field exam results taken from the medical record.
Outcomes
The LS-C and TUG scores were examined as continuous variables given the approximately normal distribution of their scores. The other outcomes were dichotomized. The balance time was dichotomized at 5 seconds due to the truncated nature of the measurement at 30 seconds and due to the previous finding that a time
of 5 seconds or less was indicative of a recent fall 29. Falls were examined as having reported a fall in the last year or not.
Statistical Analyses
Descriptive statistics were calculated including means, standard deviations, and percentages. Vision, demographic, health, and mobility variables were compared for the three eye disease groups and the control group using ANOVA or chi-square tests. Next, to determine if eye disease was independently associated with any of the mobility outcomes, regression was used to adjust for potential confounding. The different disease groups (AMD, glaucoma, and Fuchs dystrophy) were entered as indicator variables in the regression model with the control group as the reference. Linear regression was used to determine if LS-C or TUG scores differed for any of the eye disease groups compared to the control group after adjustment for demographic and health variables including age, gender, education, body mass index, depression, number of comorbidities, benzodiazepine use, and cognitive status. Race was not included in the regression models due to the absence of non-white patients in certain eye disease groups. The relationship between eye disease and the dichotomous outcomes (falls, balance) were examined using logistic regression.
To determine the measures of visual function primarily explaining the relationships between eye disease and mobility, the five measures of visual function (binocular visual acuity, contrast sensitivity in the better or worse eye, visual field in the better or worse eye) were entered one at a time into the model with the eye disease variable, and the visual function variable causing the maximal change in the regression
coefficients for the eye disease variables was noted. Analyses were done in Stata Version 11.0 (College Station, Texas).
RESULTS
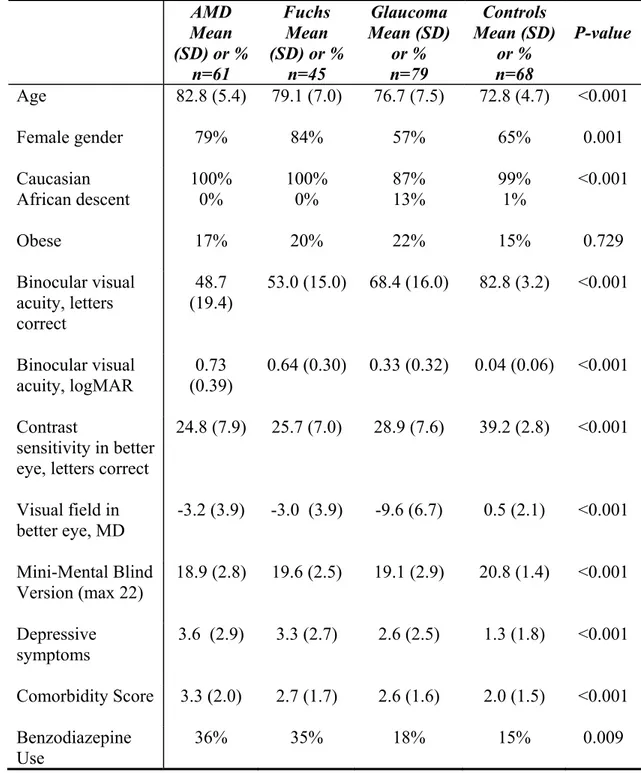
Two hundred fifty-three patients who resided in the community (81%), in assisted living (10%) or in a retirement home (9%) were recruited into the study. In Table 1, the demographic, visual, and health characteristics of the four groups are compared. The groups with eye disease were older than the control group (p < 0.001). The AMD and Fuchs groups had a higher percentage of women than the glaucoma or control groups (p = 0.001). The glaucoma group had a greater percentage of patients of African descent than the other groups, which had none to one patient of African descent. The groups with eye disease had worse cognitive, depression, and comorbidity scores (p < 0.001) while there was no significant difference in obesity between the groups.
As expected, visual acuity and contrast sensitivity were worst in the AMD and Fuchs groups while visual field was worst in the glaucoma group (p < 0.001) (Table 1). The binocular visual acuity in the AMD group was 0.73 logMAR (~20/90 Snellen), in the Fuchs group was 0.64 logMAR (~20/80 Snellen), in the glaucoma group was 0.33 logMAR (~20/45 Snellen), and in the control group was 0.04 logMAR (~20/20 Snellen). The glaucoma patients mainly had primary open-angle glaucoma (79%), 8% had normal tension glaucoma, 5% had secondary glaucoma, while the rest had other forms or the medical record did not specify (8%). The mean pachymetry value in the worse eye of the Fuchs patients was 691 μm (SD = 109).