HAL Id: hal-01420175
https://hal-lara.archives-ouvertes.fr/hal-01420175
Submitted on 20 Dec 2016
HAL is a multi-disciplinary open access
archive for the deposit and dissemination of sci-entific research documents, whether they are pub-lished or not. The documents may come from teaching and research institutions in France or abroad, or from public or private research centers.
L’archive ouverte pluridisciplinaire HAL, est destinée au dépôt et à la diffusion de documents scientifiques de niveau recherche, publiés ou non, émanant des établissements d’enseignement et de recherche français ou étrangers, des laboratoires publics ou privés.
Construction et validation de nouveaux indices pour les
tests psychométriques en épidémiologie
neurotoxicologique.
D. Chouaniere, J.M. Fontana, M.A. Boillat, H. Herrera, P. Wild
To cite this version:
D. Chouaniere, J.M. Fontana, M.A. Boillat, H. Herrera, P. Wild. Construction et validation de nouveaux indices pour les tests psychométriques en épidémiologie neurotoxicologique.. [Rapport de recherche] Notes scientifiques et techniques de l’INRS NS 208, Institut National de Recherche et de Sécurité (INRS). 2001, 30 p., ill., bibliogr. �hal-01420175�
Novembre 2001
№ ISSN 0397 - 4 5 2 9208
C o n s t r u c t i o n e t v a l i d a t i o n d e
n o u v e a u x i n d i c e s p o u r
l e s t e s t s p s y c h o m é t r i q u e s e n
e p i d e m i o l o g i c
n e u r o t o x i c o l o g i q u e
Dominique Chouanière, Jean Marc Fontana,
Marcel-André Boillat, Horacio Herrera
et Pascal Wild
1INSTITUT NATIONAL DE RECHERCHE ET DE SECURITE SIEGE SOCIAL : 30, RUE OLIVIER-NOYER, 75680 PARIS CEDEX 14 CENTRE DE LORRAINE : AVENUE DE BOURGOGNE, 54501 VANDOEUVRE CEDEX
Construction et validation de nouveaux indices
pour les tests psychométriques en
epidemiologie
neurotoxicologique
D o m i n i q u e C h o u a n i è r e
1, J e a n - M a r c F o n t a n a
1,
M a r c e l - A n d r é B o i l l a t
2, H o r a c i o H e r r e r a
2et P a s c a l W i l d
1.
1 Département d'épidémiologie, Institut National de Recherche et de Sécurité pour la
prévention des accidents du travail et des maladies professionnelles, Vandoeuvre, France.
2 Institut Universitaire Romand de Santé au Travail, Lausanne, Suisse.
Exemplaire disponible auprès de : Dominique Chouanière
Département d'Epidemiologie en Entreprises, INRS, BP 27, F-54501 Vandoeuvre Cedex - France, téléphone : + (33) 3 83 50 21 22, fax : + (33) 3 83 50 20 15, email : chouaniere@inrs.fr
R E S U M E
R E S U L T A T S
Pour trois des tests, le "Finger Tapping", le "Digit Span" et "F Associated Learning", les indices standards restent inchangés. Pour l'un d'entre eux, le "Finger Tapping" une nouvelle procédure de vérification de la validité des données brutes a pu être développée. Les nouveaux indices construits pour le test "Pattern Memory" n'apportent pas d'améliorations majeures. Pour le test "Symbol Digit Substitution", les nouveaux indices se révèlent plus spécifiques. Enfin, pour le test "Simple Reaction Time", les nouveaux indices sont plus interprétables, ont de meilleures propriétés statistiques et semblent plus sensibles au changement.
C O N C L U S I O N
Pour quelques uns des tests de la batterie NES, nous avons pu construire de nouveaux indices qui apportent des améliorations par rapport aux indices standards dans le cadre d'une utilisation en épidémiologie. Pour d'autres, les limitations des tests eux-mêmes n'ont pas permis d'améliorer les indices existants.
M O T S C L E S : NES, indices psychométriques, tests neuro-comportementaux, Simple Reaction
Time test, Symbol Digit test, Pattern Memory test.
Les test psychométriques sont souvent utilisés en recherche et particulièrement en épidémiologie professionnelle pour l'étude des effets neurotoxiques. Ces tests ont recours habituellement à des tâches répétées qui peuvent donner lieu à plusieurs données, chacune des données correspondant à une tâche. Pou être utilisées, ces données doivent être synthétisées sous forme d'indices résumés qui doivent répondre aux besoins de la recherche épidémiologique.
M E T H O D E S
Six tests issus de la batterie NES (Neurobehavioral Evaluation System) ont été utilisés dans plusieurs études épidémiologiques de neurotoxicologie. Celles-ci ont mis en évidence que les indices synthétiques standards proposés par la batterie NES présentaient des insuffisances qui ont conduit à en construire des nouveaux. Des données récentes issues d'une population de référence ont permis de valider ces nouveaux indices sur les critères usuels de l'épidémiologie : interprétabilité, sensibilité au changement et sur leurs propriétés statistiques comme l'indépendance des indices issus d'un même test et la normalité de leur distribution.
A B S T R A C T
M E T H O D S
Six tests from the NES (Neurobehavioral Evaluation System) battery have been used in epidemiological studies. Our experience with these data highlighted some problems with the standard summary indices proposed by the system, which in turn led us to propose new indices. New data from a reference population were obtained to validate these new indices in term of interpretability, sensitivity to external factors and statistical properties like independence and normality.
R E S U L T S
For three tests, Finger Tapping, Digit Span and Associated Learning, the standard indices were unchanged. Among those a validity check could be developed for the Finger Tapping test. The newly developed indices did not offer major improvements for the Pattern Memory test. For the Symbol Digit Substitution test, a possible improvement was the specificity of the new indices. Finally for the Simple Reaction Time test, our new indices were more interpretable, had better statistical properties and seemed more sensitive to the external factors.
C O N C L U S I O N
For some tests, we could develop indices which seem to perform better than the standard indices. For others, the limitations of the tests themselves did not allow any improvement.
K E Y W O R D S : NES, psychometric indices, neurobehavioral tests, Simple Reaction Time test,
Symbol Digit test, Pattern Memory test.
Psychometric tests are often used in research, especially in occupational epidemiology focused on neurotoxicological disorders. They imply usually a series of repeated tasks each of which generate one or more data items. To be used, these data must be synthesized in a few summary indices, which must meet the researcher aims.
S O M M A I R E
M E T H O D S
1. Hypotheses on the effects of neurotoxic substances and implications for the design of new indices
2. Construction of the new indices 2.1. Simple Reaction Time 2.2. Symbol Digit
2.3. Pattern Memory 2.4. Digit Span
2.5. Associate Learning and Learning Recall 2.6. Finger Tapping
3. Validation of the indices with respect to criteria R E S U L T S
1. Simple Reaction Time test 2. Symbol Digit Substitution test 3. Pattern Memory test
4. Conclusions on the results D I S C U S S I O N C O N C L U S I O N A C K N O W L E D G E M E N T S R E F E R E N C E S A N N E X E I A N N E X E I I T A B L E S 1 t o 5 page 7 page 7 page 9 page 10 page 10 page 11 page 11 page 12 page 12 page 12 page 12 page 14 page 14 page 15 page 15 page 16 page 18 page 19 page 20 page 22 page 24 page 25 M A T E R I A L S
1. Description of the NES tests 2. Presentation of the studies
2.1. Experimental study for the Simple Reaction Time Test 2.2. The cohort of apprentice building workers
2.3. Study in a reference population
3. Population and materials for the development of variables 3.1. Study groups
I N T R O D U C T I O N
Psychometric tests are widely used in research, whether experimental or in the field. They are in common use in experimental psychology for the purpose of validating hypotheses on mental function, a discipline for which they were often initially designed. They are also in widespread use in epidemiology studies to assess impairments in mental function, for instance due to ageing, or after exposure to chemical substances. It is in the field of neurotoxic epidemiology in occupational environments that the work presented here was carried out. In this context, the aim is to study the relationship between exposure to chemical substances and premature impairments of certain mental functions, which show up in poor performances in tests [10,32].
The psychometric tests used take the form of repeated tasks providing a large amount of data for each test. To exploit these data, synthetic indices summing up the information contained in them are required [16].
For experimental research, the construction of such indices is based on the understanding of psychological processes involved; the indices then describe, as accurately as possible, the mental processes involved in completion of the tests.
The concerns of the epidemiologist are different from those of the experimenter. Epidemiologists also design synthetic indices, but the purpose is to model the mechanisms of the potential action of neurotoxic agents rather than the actual mental processes in play [2, 24, 25, 31].
Indices need to be able to test hypotheses on neurotoxic mechanisms and they should therefore possess the following qualities:
- they should be easily interpretable: they should be relevant with respect to the hypotheses,
- different indices derived from a single test should be independent to distinguish between separate aspects explored by the test,
- they should be sensitive to minor disturbances of the Central Nervous System (CNS), in particular to the chronic effects of neurotoxic substances,
- they should be as stable as possible: if indices are too variable or too sensitive to the circumstances in which the test was administered, minor neurotoxic effects cannot be detected,
- they should possess statistical properties enabling adjustment on possible confounders in multiple regression models, the main property being a statistical distribution not too far from a Gaussian distribution.
Over the last fifteen years, the epidemiological needs in reliability have led to computerize psychometric tests. Test administration in this way has achieved greater standardization, which has decreased measurement error [20].
Tests have been grouped into computerized batteries, designed in a flexible manner so as to specifically suit test design to the purpose of a given study. These batteries generally include computer software for data analysis that offers one or more indices for each test [16].
To design new indices, other than those offered by existing software, raw data must be available (one data input per trial or item) for each test. This is the reason for the choice made here of the NES battery (Neurobehavioral Evaluation System) [16]. Nevertheless, the results of this work can be generalized to other computerized batteries, if raw data are provided.
Thus, we have developed from reference populations, in addition to the standard indices offered by NES, new indices meeting the epidemiological requirements set out above. We attempted to generate from the NES tests used in these studies, two types of indices, those reflecting performance and those describing the performance variability in the course of a test [26]. The intrinsic qualities of these indices (normality, sensitivity, and independence between indices derived from a given test) were examined and compared with those derived from NES.
M A T E R I A L S
Before describing the test variables (the NES and the new variables), the NES battery itself, that was used in the different studies and the different data sets, will be presented.
1. Description of the NES tests
NES is a computer program developed in 1985 by E.L. Baker and R. Letz [16] for standard microcomputers. As it was designed for the computer processors in existence at the time, it was subsequently adapted to upgraded processor; so there are two NES versions, 4.25 and 4.63, corresponding to two generations of processors.
For some tests additional devices are required: a joystick for the Simple Reaction Time and the Tapping tests (described in Annexe I), with the appropriate interface card. The joysticks used in our study are all equipped with the same contactors, while there are two different interface card types. NES offers the best-suited tests for neurotoxic epidemiology. Indeed, these tests, mainly derived from the Halstead-Reitan reference battery used in neuropsychology for clinical purpose in patients with cerebral lesions, were chosen because they have proved sensitive to neurotoxic effects [10,16]. NES provides 17 different tests belonging to three main functional domains [16]:
- psychomotor
- memory and learning - cognitive.
For each study, NES allows to choose the tests best suited to the hypotheses, but also to decide on the order in which they are administered and to fix a certain number of parameters for each test. For instance, the reaction time can be parameterized for size, duration or color of the stimulus, for the inter-stimulus interval timing, etc.
In the present studies, 7 of the 17 tests provided were used. These tests are described in detail in Annexe I.
2. Presentation of the studies
The data used here come from:
- an experimental survey on the Simple Reaction Time (SRT) test, designed in our department in order to test specific hypotheses,
- a cohort study conducted in close collaboration with the "Institut universitaire Romand de Sante
au Travail", Lausanne
2.1. Experimental study for the Simple Reaction Time test
A single volunteer underwent a randomized balanced experimental design study to test the effect of several factors on the SRT variables:
- the version of NES used (4.25 or 4.63) - the joystick interface card (types X and Y).
Other factors that are not relevant for this work were also tested, such as the orientation of the screen in relation to the daylight source. None proved to be related to the reaction time performance. The subject repeated the SRT 140 times with 30 trials per test over a period of one week.
2.2. The cohort of apprentice building workers
In order to study premature cognitive impairments related to occupational exposure to solvents present in paints, a closed cohort was set up.
This cohort have comprised apprentices in building professions, painters and non-painters (builders, electricians, metal-workers, plumbers), enrolled in apprenticeship courses in Geneva (Switzerland) and in a region of North-east France, Lorraine [4, 9].
At the start of apprenticeship, before any significant exposure to solvents, apprentice painters and non-painters were informed of the study. Only volunteers were included in the cohort and then, were followed up over two consecutive school years.
The Geneva cohort was recruited in September 1991 and 1992, and the Lorraine cohort at the start of the 1993-4 and 1994-5 school years.
In Geneva, the study was conducted in the only existing vocational training establishment, while in Lorraine six different establishments were involved.
The same protocol was applied in the two groups.
2.3. Study in a reference population
To establish the effects of confounders (gender, age, etc) on performances in the tests, a reference population (REF) was approached.
The French social insurance system allows individuals affiliated to the "Régime GénéraV (mainly salaried workers in the industrial sector, representing 80% of the general population) to undergo a free general health check-up every 5 years, to screen for risk factors and pre-morbid indicators. These check-ups take place in regional health examination centers. For eastern France, the center that performs these check-ups is the "Centre de Médecine Préventive", which has the particularity to offer these general check-ups not to individuals alone but also to all the members of a given family. Its volume of activity is particularly large, with the number of examinations reaching 30 000 per year. All heads of families depending on the "Régime Général" receive an invitation for the check up by post. The check-up takes place over two half days, the first being devoted to various
examinations and tests and the second two week later involving a medical check-up in the course of which the results of the different examinations are given and preventive measures suggested.
Undergoing this examination is of a voluntary nature and requires the person to travel to the "Centre
de Medecine Preventive ". We asked to the subjects, present in this "Centre*\ for their first or
second visit, if they would agree to carry out 6 NES tests. Since the subject's sample selected in this way was not representative of the general population, we planned a design in order to obtain groups of 100 individuals (50 men and 50 women) for each 10-years between 20 and 60. Only those individuals employed in the industrial sector not exposed to neurotoxic substances, and without medical history likely to affect the test results were included in the study.
Finally, 413 individuals in consultation at the "Centre" volunteered to take part, comprising 210 men and 203 women.
3 . Population and materials available for the development of variables 3.1. Study groups
The indices were developed from the following:
- the male apprentice population or APP (N = 585), which was homogeneous with respect to age (mean age = 1 7 years ± 2),
- the referent population or REF (N = 413, mean age 40 years ± 1 1 ) , subdivided into two (men and women).
3.2. Materials
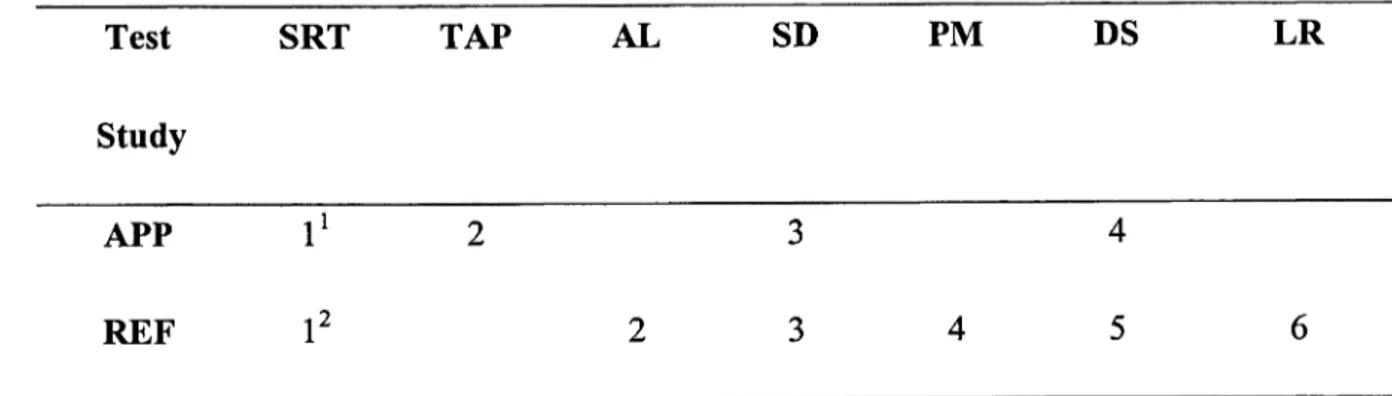
Table 1 recapitulates the tests selected for the two studies and the order in which they were administered.
The test parameters were identical in the two studies except for the SRT test (see table 1).
As recommended by Letz, [16], a synonym test (developed in French by Binois and Pichot [3]) was systematically added to the NES battery even if the relevance of such test had been discussed by some authors [19]. The score derived from this test is intended to reflect the socio-cultural status of subjects which is a classic confounder. The number of target words provided was adapted to the presumed educational level of the population under study. It was restricted to 25 for the APP study and issued in its full version (34 target words) to the REF population.
Two versions of the NES program were used for data collection: versions 4.25 and 4.63 in the APP group, version 4.63 only for the REF population. The differences arising from the use of the two versions were taken into account (see Annexe II).
M E T H O D S
1. H y p o t h e s e s on t h e effects of n e u r o t o x i c s u b s t a n c e s a n d i m p l i c a t i o n s t o d e s i g n n e w i n d i c e s Damage to the CNS after exposure to toxic chemical substances is expected to start with a decrease in performance in basic mental functions such as reaction speed, short term memory or attention span, with a delayed effect on higher functions such as logical reasoning, mental calculation etc. [10]. Thus, in the clinical evolution of the psycho-organic syndrome towards chronic toxic encephalopathy, defined in the Raleigh or WHO classifications [8, 33], performances in short term memory and attention are reduced (stage 1) but that can be measured only at stage 2. There is deterioration over time, complex cognitive functions being affected only in the last stage (stage 3). We assumed that in the sub-clinical stage, the neurotoxic process can affect the maintenance of performance in the course of the test, whatever the task (motor, memorization, etc), impairment of performance itself only appearing later.
This hypothesis is based on the attention model provided by Laberge [14] which defines attention as being the general supervisor of activities, acting by increasing the recruitment of neurons for a given task and reducing the refractory period in these neurons. Laberge, quoted by Camus [6] considers that different prefrontal structures are involved in attention process, the frontal structures having been seen to be altered in patients with toxic encephalopathy via SPECT brain scans [5].
To validate this hypothesis, two different types of indices are required, those reflecting performance for a given task, and those reflecting the ability to maintain this performance over time. In addition, the indices derived from the same test should be as "pure" as possible with respect to the mental functions represented, which must lead to their statistical independence one from the other. The indices must also be simple with respect to clinical inteipretation, and the mathematical conversions need to reflect this: a decrease in a performance variable has to be easily related to a damage of the function.
2. C o n s t r u c t i o n of t h e n e w i n d i c e s
2.1. Simple Reaction Time (SRT)
NES first removes the values <100 ms or >1000 ms, then calculates a first mean and standard deviation for the remaining values, then removes again the values above the mean plus three standard deviations, and calculates the final mean ( R T N E S ) and standard deviation ( S R T N E S ) on the selected values.
The interpretation of the S R T N E S as a dispersion variable is problematic, because it is strongly correlated with RT_NES. This correlation is due to the weight of long reaction times, which have a considerable influence on the two parameters despite the removal of extreme values.
The percentiles of the distribution do not have this disadvantage, and do not require removal of these values.
The results of the experimental study confirmed the usual phenomenon that the best performance (the lowest value on the fifty trials) had a higher dispersion than the 10% percentile. This percentile is furthermore less dispersed than the median and the mean owing to the skewness of its distribution. Then we proposed this index, which is referred to as RTPERF, as an indicator of best performance. To achieve concordance, the ratio between the 90% percentile and the 10% percentile is proposed as dispersion measure (RTDISP).
2.2. Symbol Digit (SD)
NES offers a single index ( S D N E S ) which is the mean of the two lowest set scores (score for each set = total time for the set / 8 - number of errors). Correcting the index by subtracting the number of errors appeared questionable. This correction does increase the scores of subjects who have made errors in an arbitrary manner. Then the synthetic index combines two aspects, slowness and distraction. In fact, we think that a time of a set with errors and a time of a set without errors are not comparable.
More generally, non-compliance with test instructions makes the test impossible to interpret. We have chosen therefore to put emphasis on compliance with instructions, and not to consider correction for the number of errors.
We retained only the sets without errors, and therefore selected only subjects completing at least two sets without errors.
We checked on the sets without errors that the second part of the instructions was observed: dealing with one box at a time and not memorizing several consecutive boxes. It was possible to take this into account by removing, among the sets comprising no errors, those where:
- the series of 8 time measures included more than one time measure <1 second
- or the difference between the mean of the 8 time measures and their standard deviation that was < 1 second.
The set chosen among those remaining after these two procedures was the one with the lowest overall time. Then 4 indices were calculated on this set corresponding to two mean performance indicators and two dispersion indicators:
- arithmetic mean and standard deviation (SD_M, SD_Sd) - geometric mean and standard deviation (SD_GM, SD_GSd).
2.3. Pattern Memory (PM)
Three variables are recommended by NES: - the number of trials answered correctly,
- average latency (in seconds) on correct trials (dropping the first trial) - average latency (in seconds) on incorrect trials.
We have not taken into account the average latency on incorrect trials, which seemed more likely to reflect the subject's hesitation when there is no recognition, rather than actual mnemonic ability. To provide a stability variable, the standard deviation of the latencies on correct trials was calculated. We also considered the geometric mean and standard deviation were also taken into account.
For this test, 5 indices are available:
- number of trials answered correctly (PM_N),
- arithmetic mean and standard deviation of latencies on correct trials (PM_M, PM_Sd), - geometric mean and standard deviation of latencies on correct trials (PM_GM, PM_GSd).
2.4. Digit Span (DS)
The measures recommended by NES are the longest spanlength answered correctly, forward and backward, and the difference between them. The design of this test, which increments by one figure for each successful trial and stops after two errors, predetermines the performance variables. It was not possible to suggest any new variable for this test.
2.5. Associate Learning (AL) and Learning Recall (LR)
For the AL test, the recommended measures are the number of correct responses in each trial. As it could be thought that a maximum performance achieved in the first trial reflects more efficient learning, an attempt was made to design a score combining performance and rank. But it is not valid for all subjects, since some maximum performances in the first trial subsequently deteriorate. Finally the maximum number of pairs given whatever the rank of the series was chosen.
The recall test does not afford the possibility of developing other indices, as it only comprises one trial.
2.6. Finger Tapping (TAP)
The NES system indices are the number of taps with the dominant hand, the number of taps with the non-dominant hand, and the number of taps alternating the hands, as well as the number of errors in alternating tapping.
On the tests overall, a dysfunction of the joystick buttons was observed in several instances because of a faulty contactor. This fault was detected after the fact because a high standard deviation was associated with a high mean on one individual data. It was however possible to take this into account by removing the data if ( 1s t max - 2n d max) > 10 or ( 1s t max / 2n d max) > 1.3. This rule was
defined empirically from observation of the available data.
3 . Validation of the indices with respect to criteria
The normality of the statistical distributions was assessed using the Shapiro-Wilk's W test. This test is the ratio of two estimates of the variance, one under the hypothesis of a normal distribution and the other an empirical, non-parametric estimate. The ratio is always lower than one, and the closer it is to unity, the closer to normal is the distribution.
The normality of the intra-individual distribution was examined in the whole set of repeated measures for one and the same subject. Inter-individual normality, which is more important in epidemiology, was examined in the REF population.
The independence of two variables from a single test is assessed using Pearson's linear correlation coefficient, the value zero indicating absence of any correlation.
Finally, responsiveness to change via the study of the effect of age and the vocabulary test was assessed using linear regressions. The effect of age was studied in the REF population at the same time as the vocabulary effect in both men and women [1, 11, 15, 17, 30]. Since the apprentices are more or less all the same age they form an ideal population for studying the vocabulary effect on its own.
Age is given in years, and the score for the vocabulary test is given in numbers of words. In the regression tables the percentage of variance explained by the model is presented for each of the two models (coefficient R2 expressed in %) and the coefficients divided by their standard deviation for
each of the variables in the model. The percentage of explained variance depends on the distribution of explicative factors (independent variables) and cannot therefore be extrapolated from one population to another, but does enable comparison of the explicative value of factors for each dependent variable.
All the analyses were performed on the raw variables and on variables after logarithmic conversion. All statistical analyses were performed using the SAS software [22].
R E S U L T S
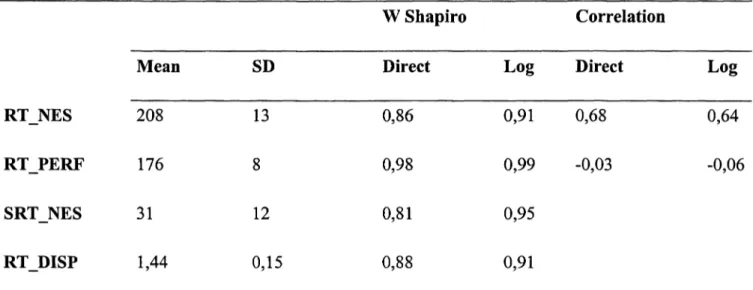
Table 2 shows the descriptive results for the controlled individual reaction time experiment. Tables 3 to 5 respectively show all the results in the three non-exposed populations, APP, REF-male and REF-female for the different indices derived: the Simple Reaction Time test (table 3), the Symbol Digit Substitution test (table 4) and the Pattern Memory test (table 5).
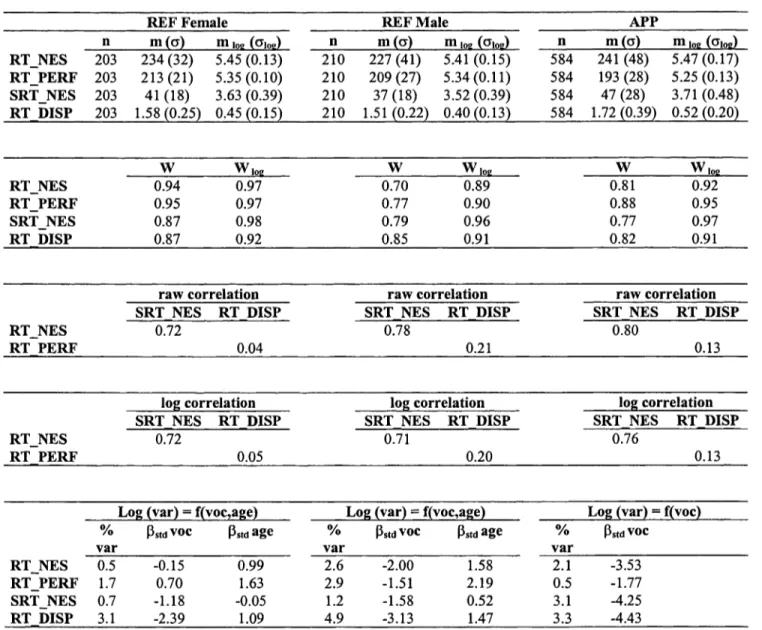
1. S i m p l e R e a c t i o n T i m e t e s t
For the indices derived from the simple reaction time test (RT), the mean of the proposed performance index (RT_PERF) is lower than the NES mean, as it does only depend on the best trials. Both R T N E S and RTJPERF have a distribution, which is closer to the Gaussian distribution when log-transformed (the Shapiro-Wilks W test is closer to one). The same is true for the dispersion variables (SRT__NES and RT_DISP). It is noteworthy that R T N E S and SRT_NES are closely correlated (correlation between 0.72 and 0.80), which means that R T N E S has a variability component and SRTJNTES a performance component. In this respect RT_PERF and RT_DISP behave better, as they are virtually uncorrelated (R between 0.04 and 0.21). These features can be noted in the three populations but also in the experimental population within individual data. The comparison between the populations shows that the male REF population has the lowest value for mean performances (mean RT_NES = 227), its mean stability indices are also lower, reflecting perhaps the quieter circumstances in which the data was collected or reflecting the self-selection of this reference population. However, the performance as measured by RT_PERF is lower among the apprentices than in the reference population and this difference is highly significant. Thus the lower SRT mean (SRT_NES) in the reference population is simply a lesser dispersion, the actual performance being lower in the population of apprentices. The difference between the male and the female reference populations is small. The dispersion among females is slightly higher (as measured by log RT_DISP) than among males, resulting in slightly higher RT_NES, but RTJPERF is not significantly different between the genders.
Concerning the effect of the independent variables, one can note that no RT variable is strongly related to age, with the exception of RT_PERF in the male reference population. As this population was stratified on age and has the widest age range, it is best suited to show such an effect. On the other hand, RT_PERF is not related to the vocabulary test (-1.51 in the male REF, +0.70 in the female REF and -1.77 in APP). This contrasts with the dispersion variables, especially RT_DISP (-3.13 in male REF-2.39 in female REF and -4.43 in APP), which are strongly correlated with the vocabulary test. The observed effect of the vocabulary test on RT_NES (0.15 in female REF, -2.00 in male REF and -3.53 in APP) seems therefore to be attributable to its dispersion component.
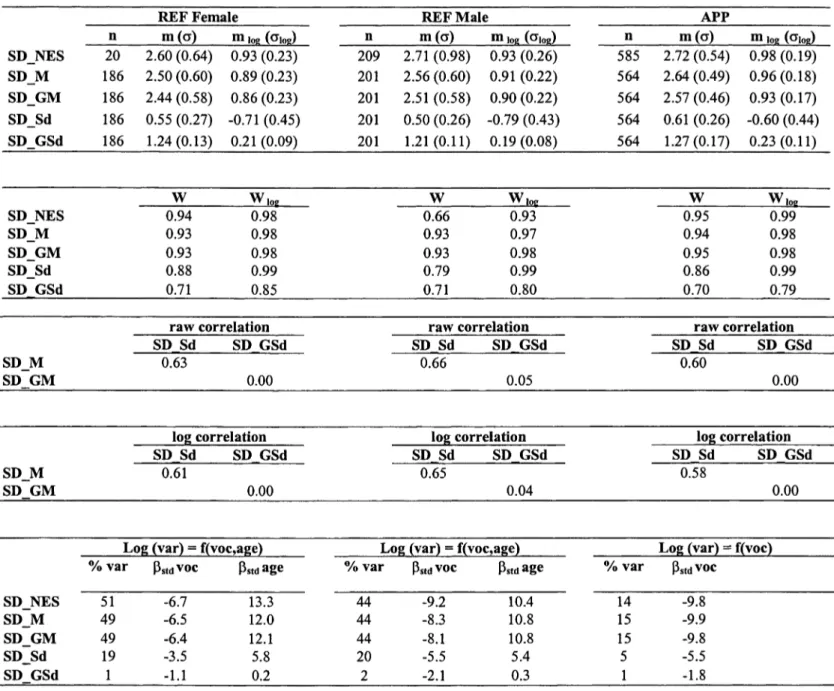
2 . S y m b o l Digit S u b s t i t u t i o n t e s t
For the Symbol Digit test (SD), the distribution of all log-transformed variables except SD_GSD seems reasonably Gaussian.
Again it can be noticed that SD_M and SD_Sd are highly correlated (from 0.60 to 0.66 according to the population). This contrasts with the absence of correlation between S D G M and SD_GSD
(from 0.00 to 0.04). Again the performance indices are slightly lower in REF than in APP which has higher dispersion variables (SDJSd or SD_GSd).
The regression analyses show a very strong relationship between age and all performance variables (standardized coefficients > 10 in male REF and >12 in female REF) and as a consequence a somewhat less pronounced relationship with SD_Sd, given the high correlation between SD_M and SD_Sd shown earlier. The strong relationship between all indices and the scores of the vocabulary test must also be noted. The statistical significance of these relationships does not seem to depend on which index is used. None of the variables show any significant difference between males and females.
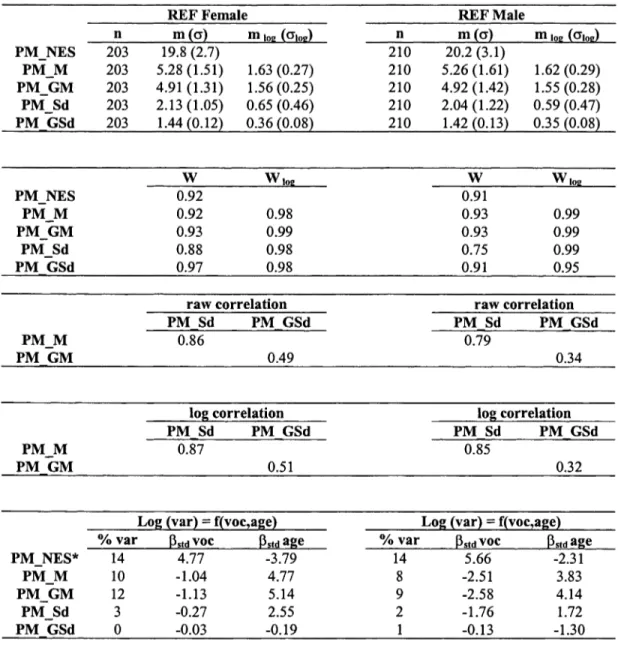
3 . Pattern Memory test
In the same way as for the variables from the Simple Reaction Time and the Symbol Digit tests, the variables from the Pattern Memory test (PM) are more or less Gaussian after log-transformation. However, the high correlation between PM_M and PM_GM does not entirely disappear with geometric statistics PM_GM and P M G S D which are still correlated, although less than with the arithmetic statistics. Again the REF population is best in terms both of numbers of correct answers and of the time variables, although the differences are small and non-significant.
For this test, the number of correct answers seems to be the most sensitive variable, as it is related to age and the vocabulary score. The time performance variables (PM_M and P M G M ) have similar patterns with an age effect and a somewhat less distinct vocabulary effect.
4 . Conclusion on the results
In conclusion, the SRT test is best summarized by RT_PERF and RT_DISP and must be log-transformed in the multiple regression analysis. For SD and PM, the statistical descriptions show only one improvement from using the new indices for the independence between SD_GM and SD_GSd. As for the SRT, the use of multiple regression requires prior log transformations.
D I S C U S S I O N
The objectives set out at the beginning of this work have been reached, although there are some limitations.
These relate to, first of all, the quality of the data available and the suitability in respect to the issue in hand.
The experimental study was implemented on a single subject, which limits the scope of results, but these results served mainly to generate indices. None of the results of this work are based on this data.
The results could be questioned because of the use of two different versions of the NES tests but the problems encountered were solved in the various ways described in Annexe II.
Access to raw data, made feasible with the NES, enabled redefinition of a certain number of indices for testing hypotheses formulated on the action of neurotoxic substances. Because of the epidemiological criteria (normal distribution, independence of indices derived from the same test, responsiveness to change), and the design of some of the tests, it was not possible to define or to accept new indices for all the tests selected for this work.
The DS test design entails limitations, since recording is terminated after two failed trials. This test appears not solely to measure mnemonic performance. Lack of attention or non-comprehension of the test could also explain performance.
The variable that was finally selected for the AL test, the best performance among three trials does not enable discrimination between subjects with good memory capacity from those with a strong learning ability. The variable does not account for the three types of performance observed on the data (obtaining maximum performance in the first trial subsequently maintained or not, or performance improving during the course of the test).
The validation of the Finger Tapping test had the advantage of identifying an artefact that could occur if there is a joystick contact defect. We developed a validation procedure to detect this type of malfunction and correct faulty data in retrospect.
For the Symbol Digit test, the main change with respect to the original variables proposed by NES was to abandon the correction for the number of errors in the mean time taken for the coding, and to keep this time variable completely separate from the number of errors. This has the advantage of removing the subjects whose time is contaminated by these errors. This yields a variable, which is more specific to the mental function considered. This, however, has the disadvantage of dropping from the data set all subjects (45 out of 997) with a coding error and thus potentially reducing the statistical power to detect an exposure effect. This does not seem to be the case in our regression analyses if we consider the effect of age or a low vocabulary test result. Despite lower numbers, the significance (as diagnosed by the standardized regression coefficients) is about the same for SD_M, SD_GM and SDJMES. If, however, an exposure effect is reflected by an increase in the number of errors, this could still be studied. The original NES variable would not be capable of detecting an effect of this sort, as the time is shortened for subjects with errors. However, at exposure levels in which epidemiological studies are carried out, such an effect is unlikely.
The construction of a variable characterizing the dispersion of the performance, which would be independent from the performance index, is achieved when S D G M is taken as a performance indicator and SD_GSd as a variability indicator. However, the latter indicator is related neither to age nor to the vocabulary test. It is therefore doubtful that it would be sensitive to an exposure to low levels of solvents. Conceptually, this test does not seem to enable an adequate measure of the variability of the coding speed.
We can conclude that while SD_M or SD_GM can be recommended as the performance variables to use in epidemiology, although we must also acknowledge that the original SDJMES variable is not very different. As for all other variables, a log transformation is required for use in regression analyses. The variability variables tested do not seem worth keeping.
It is for the Simple Reaction Time test that the conversion of raw data in new indices meeting the epidemiological criteria is the most efficient. The definition of two new parameters (RT_PERF and RT_DISP) made it possible to remove the link between the performance indices and the variability indices as it appears in the NES variables. This provides two indices that are independent and therefore interpretable.
The relationships between performance in the vocabulary test and the SRT indices are also more readily interpretable. RT_PERF is not linked to vocabulary, unlike RT_NES. However, RT_DISP is related to vocabulary score. This appears more coherent, because there is no reason for a speed of reaction performance to be linked to socio-cultural status. But stability in reaction speed is more likely related to compliance with "school" type exercises, which is involved in performing the best in the course of tests. This compliance with "school" type exercises is also involved in the process of learning new vocabulary. Then this compliance could explain both of the stability of a performance whatever the task and of the vocabulary performance.
In addition, the new indices developed for the Simple Reaction Time test are easy to understand, intuitive and free from correcting factors. The reference values are based, to date, on a population of about 1000 subjects, even if they are split into three groups.
Other approaches based on statistical models [12, 13, 26] have been attempted, but proved unsatisfactory because these theoretical distributions do not fit in 25% of cases with the empirical distribution.
For all variables from the three psychometric tests (PM, SD and SRT) presented in more detail in this paper, a common feature is that a logarithmic transformation yields a statistical distribution which is closer to the Gaussian distribution and therefore stabilizes the standard deviations. A second common feature is that the mean values of almost all indices are nearly identical between males and females. The somewhat higher dispersion of the SRT among females is difficult to interpret but correlates a similar finding for S D G S d , which measures the dispersion for the SD.
C O N C L U S I O N
This work has provided indices that meet the epidemiological criteria defined at the outset, whether they are derived from the NES or newly designed. They have shown their responsiveness to change for classic factors such as age and performance in the vocabulary test. They now need to show their responsiveness to change in the case of exposure to neurotoxic substances.
A C K N O W L E D G M E N T S
We would like to express our warm thanks to the apprentices and to the volunteers who agreed to participate in the referent study.
We would also like to thank the educational and apprenticeship establishments that enabled us to meet the apprentices, the "Centre de Médecine Préventive " in Vandoeuvre-lès-Nancy who agreed to the population study being conducted on its premises, and all other individuals who contributed to the implementation of this study.
We would like to thank our translators warmly, Angela Verdier and particularly Hilary Knight who has worked hard with patience and good humor.
Financial aid from the Swiss Fund for Scientific Research is gratefully acknowledged (grant 32-30203.90).
R E F E R E N C E S
W.K. Anger, OJ. Sizemore, SJ. Grossmann, J.A. Glasser, R. Letz, R. Bowler, Human neurobehavioral research methods: impact of subject variables, Environ Res 73 (1997) 18-41.
J.M. Balbus, W. Stewart, K.I. Bolla, B.S. Schwartz, Simple visual reaction time in organolead manufacturing workers: comparison of different methods of modeling lead exposure and reaction time, Am J Ind Med 32 (1997) 544-549.
R. Binois, P. Pichot, Test de vocabulaire, Paris, Editions du Centre de Psychologie Appliquée, 245, 1959, 4 p.
L. Bolle, H. Herrera, E. Lorétan, M.A. Boillat, Neurobehavioral test performance among apprentice painters: baseline data, Am J Ind Med 29 (1996) 539-546.
T.J. Callender, L. Morrow, K. Subramanian, Three-dimensional brain metabolic imaging in patients with toxic encephalopathy, Environ Research 60 (1993) 295-319.
J.F. Camus, La psychologie cognitive de l'attention, Paris, Masson & Armand Colin, 1996, 217 p.
D. Chouanière, P. Wild, J.M. Fontana, M. Héry, M. Foumier, V. Baudin, I. Subra, D. Rousselle, J.P. Toamain, S. Saurin, M.R. Ardiot, Neurobehavioral disturbances arising from occupational toluene exposure, Am J Ind Med, 2001, accepted for publication.
J. Cranmer, L. Goldberg, Report of a workshop - the neurobehavioral effects of solvents, Neurotoxicology 7 (1986).
J.F. Holtz, M.A. Boillat, Health and health-related problems in a cohort of apprentices in Switzerland, J Soc Occup Med 41 (1991) 23-28.
B.L. Johnson, Prevention of neurotoxic illness in working populations, Chichester, John Wiley & Sons, 1987, 217-241.
E. Kiesswetter, B. Sietmann, M. Zupanic, A. Seeber, Neurobehavioral study on the interactive effects of age and solvent exposure, Neurotoxicology 21 (2000) 685-696.
D. Kornbrot, Complexities in "simple" reaction times: the role of voluntary decision criteria, 1999.
E.F. Krieg, D.W. Chrislip, J.M. Russo, A mathematical model of performance on a simple reaction time test, Neurotoxicol Teratol 18 (1996) 587-593.
D. Laberge, Attentional Processing, Cambridge, Mass., Harvard University Press, 1995. R. Letz, Covariates of computerized neurobehavioral test performance in epidemiologic
investigations, Environ Research 61 (1993) 124-132.
R. Letz, Nes2 User's manual. Version 4.6, Winchester, Neurobehavioral Systems Inc, 1994, 58 p. and appendices.
R. Letz, W.A. Pieper, R.D. Morris, NES test performance in a large US Army veteran sample: Relationships with both demographic factors and traditional neuropsychological measures, Neurotoxicol Teratol 18 (1996) 381-390.
M.D. Lezak, Neuropsychological assessment, New York, Oxford University Press, 1983, 768 p.
H. Michelsen, I. Lundberg, Neuropsychological verbal tests may lack "hold" properties in occupational studies of neurotoxic effects, Occup Environ Med 53 (1996) 478-483.
S.P. Proctor, R. Letz, R.F. White, Validity of a computer-assisted neurobehavioral test battery in toxicant encephalopathy, Neurotoxicology 21 (2000) 703-714.
T.A. Salthouse, What do adult age differences in the Digit Symbol Substitution test reflect ? J Gerontol 47 (1992) 121-128.
SAS Institute inc., SAS/STAT User's Guide. Version 6, Fourth Edition, vol. 1, Cary: SAS Institute Inc, 1990, 943 p.
R. Stephens, Feasibility of the use of eye movement data in the analysis of neurobehavioral test performance, Environ Res 1 (1985) 53-57.
B.T. Stollery, Cognitive neurotoxicology. A luxury or necessity? Neurotoxicol Teratol 18 (1996)359-364.
B.T. Stollery, Reaction time changes in workers exposed to lead, Neurotoxicol Teratol 18 (1996) 477-483.
G.J. Van Breukelen, E.E. Roskam, P.A. Eling, R.W Jansen, D.A. Souren, J.G. Ickenroth, A model and diagnostic measures for response time series on tests of concentration: historical background, conceptual framework, and some applications, Brain Cogn 27 (1995) 147-179. E.K. Warrington, M. James, Disorders of visual perceptions in patients with localized
cerebral lesions, Neuropsychologia 5 (1967) 253-266.
D. Wechsler, Wechsler adult intelligence scale manual. Psychological corporation, New-York, 1955.
D. Wechsler, A standardized memory scale for clinical use, J Psychol 19 (1945) 87-95. A.T. Welford, Reaction time, speed of performance, and age, Ann N Y Acad Sci 515 (1988)
1-17.
R.F. White, R. Diamond, M. Krengel, K. Lindem, R.G. Feldman, R. Letz, E. Eisen, D. Wegman, Validation of the NES2 in patients with neurologic disorders, Neurotoxicol Teratol 18(1996) 441-448.
A.M. Williamson, Historical overview of computerized behavioral testing of humans in neurotoxicology, Neurotoxicol Teratol 18 (1996) 351-358.
World Health Organization, Regional Office for Europe. Report of working group on chronic effects of organic solvents on central nervous system and diagnostic criteria, Copenhagen: World Health Organization, 1986.
A n n e x e I: Description of the N E S tests used
The NES program checks that a person is performing tests correctly: for instance if there are non-responses or long non-responses compared to the threshold number, a error message appears on the screen and the interviewer is called to instruct the subject verbally. Thus, even if the test battery is computerized, an interviewer supervises the correct completion of the tests.
1. Simple Reaction Time test (SRT)
This test is supposed to explore visuo-motor speed.
The subject is asked to press a button on the joystick as quickly as possible when a large square appears on the screen. The inter-trial interval is varied randomly to reduce effects of stimulus anticipation. The test was performed in our studies with the preferred hand. If there is no response within a pre-set stimulus interval (default = 1 sec.) the stimulus is cleared and a new trial begins. The whole measurement chain is checked before each campaign on each computer using a specifically designed external automaton.
2 . Symbol Digit Substitution task (SD)
This test is the Digit Substitution Test from the Wechsler Adult Intelligence Scale [28] modified mainly because of computerization. In its paper version it is intended to explore coding speed involving several mental functions: motor persistence, sustained attention, response speed and visuo-motor coordination [18]. We could not exclude the possibility that, in the computerized version, this test might explore additional functions such as the short-term memory [21, 23].
Nine symbols and nine digits are paired (in a "key") at the top of the screen, and the subject is required to press the digits on the keyboard corresponding to a test set of the nine symbols presented in scrambled order. Five sets of nine symbol-digit pairs are presented in succession (the first is a practice set). Errors are not allowed to be entered on the practice trial, and errors on other trials above a certain threshold number result in a message stressing that there should be no errors. The pairing of symbols and digits between sets varies to avoid incidental learning effects. Assignment of symbols is random, subject to the restriction that a symbol should not appear in the stimulus column directly below where it appears in the key.
3 . Associate Learning test (AL)
This is similar to the paired-Associate Learning test used in the Wechsler Memory Scale [29], which is intended to explore learning. A list of given names (between four and six letters) is paired with occupations. The stimuli are presented visually, and responding consists of manual selection from alternative answers.
5 . Visual Digit Span test (PS)
This is similar to the Digit Span sub-test of the Wechsler Memory Scale [29], which is intended to evaluate short-term memory. A sequence of digits is presented to the subject one at a time at the center of the screen, and after the whole sequence has been presented, the subject is required to enter the sequence on the computer keyboard. Increasingly longer spans of digits are presented until the subject makes 2 errors at a span length. After these 2 errors, a second testing condition is initiated in which the subject must respond with the order of the digits reversed (backward).
6. Pattern Memory test (PM)
This non verbal memory test is an elaboration of a manually administered test, the visual retention test used by Warrington and James [27] to test patients with localized cerebral lesions. It proposes a task, theoretically free from cultural background, not based on recall like the Digit Span test but on a multiple-choice recognition. It is also intended to explore short-term memory.
As shown on the figure 2, a single stimulus array made up of 100 small blocks is presented for a brief period and then the screen is blanked. Each block of the array is either light or dark. The pattern of light and dark blocks is chosen pseudo-randomly. After a short retention interval, 3 block arrays are presented together side by side on the screen. One of these is the original array and the other 2 have a small number of array blocks changed. For each trial the subject must choose which of the 3 arrays is the same as the first array presented alone.
In our studies the number of practice trials is one and the number of trials is 25.
7. Finger Tapping test (TAP)
This is a test of motor speed and accuracy. The subject is asked to press a button on the joystick as many times as possible within a specified interval. All trials with the preferred hand pressing one button are administered first, followed by all trials with the non-preferred hand, and then all trials with both hands alternately tapping 2 buttons. The program checks that the number of taps performed during each trial is greater than a specified minimum, and if not, the interviewer is called to give additional verbal instructions to the subject.
A single recall trial of the names and occupations used in the preceding test is proposed at the end of the testing session. If the delay between the encoding and the recall is 30 minutes approximately then this intermediate recall test explores "intermediate memory".
ANNEXE II: Management of differences between NES versions (4.25 and 4. 63)
1. Simple Reaction Time test
Following the development of a computer timer device, it was possible to compare the different computers and standardize the results for the simple reaction test.
Indeed, the measurement of reaction time is different according to the version used. Version 4.25 records a reaction time that is 14 milliseconds below version 4.63. For this reason, the computers were standardized using a computer timer device enabling conversion of the reaction time derived from each computer into the same reference unit, that used by the automate.
2 . Other tests
In the framework of the APP cohort study, at the start of their apprenticeship, some apprentices were tested using NES version 4.25 (processors 286 and 386) and others using NES version 4.63 (processors 486).
As this is a large population (N = 408), very homogeneous for age and free from any neurotoxic exposure, it can be considered as a reference to study the effect of the version used. No difference was observed between the computer models for the SD and DSF variables. As time measurements for PM are in the same scale as SD, it was possible to infer that PM variables are independent from the computer models. Nevertheless, a difference was observed between the models for DSB performance in the range of 1/2 digit: the low power processors gave better performances.
To account for this difference, in another study on the neurotoxic effects of toluene [7], we normalized DSF and DSB performances by reducing performances of 1/2 digit when the tests were performed on the older computers.
The results were unchanged after this correction: the adjusted slope for 100 ppm of present toluene exposure is - 2 . 7 for DSF performance with correction (instead of -2.8) and -3.1 for DSB performance (instead of-3.9).
Table 1: Tests and order of administration in the two studies
Test SRT TAP AL SD PM DS LR Study APP l1 2 3 4RE F
l2 2 3 4 5 6 1 50 trials 2 60 trialsSRT: Simple Reaction Time test TAP: Finger Tapping test AL: Associate Learning test SD: Symbol Digit test PM: Pattern Memory test DS: Digit Span test LR: Learning Recall test
Table
2:
Gaussian distribution test and independence
between indices on experimental data
W Shapiro Correlation
Mean SD Direct Log Direct Log
208 13 0,86 0,91 0,68 0,64 176 8 0,98 0,99 -0,03 -0,06 31 12 0,81 0,95 1,44 0,15 0,88 0,91 R T N E S RTJPERF S R T N E S R T D I S P
Table
3:
Simple Reaction Time test indices
REF Female REF Male APP n m (a) " I 102 (aim.) n m (a)
m mg (CT102)
n m (a) m loa (<*loe)RT NES 203 234 (32) 5.45 (0.13) 210 227 (41) 5.41 (0.15) 584 241 (48) 5.47 (0.17) R T P E R F 203 2 1 3 ( 2 1 ) 5.35(0.10) 210 209 (27) 5.34(0.11) 584 193 (28) 5.25 (0.13) SRT_NES 203 4 1 ( 1 8 ) 3.63 (0.39) 210 3 7 ( 1 8 ) 3.52 (0.39) 584 47 (28) 3.71 (0.48) RT DISP 203 1.58 (0.25) 0.45 (0.15) 210 1.51 (0.22) 0.40 (0.13) 584 1.72 (0.39) 0.52 (0.20) W
W
,„2
W wl 0 B Ww
l 0 2 RT NES 0.94 0.97 0.70 0.89 0.81 0.92 RT PERF 0.95 0.97 0.77 0.90 0.88 0.95 SRT NES 0.87 0.98 0.79 0.96 0.77 0.97 RT DISP 0.87 0.92 0.85 0.91 0.82 0.91 raw correlation SRT NES RT DISP raw correlation SRT NES RT DISP raw correlation SRT NES RT DISP RT_NES RT PERF 0.72 0.78 0.80 0.04 0.21 0.13 log correlation SRT NES RT DISP log correlation SRT NES RT DISP log correlation SRT NES RT DISP RT_NES RT PERF 0.72 0.71 0.76 0.05 0.20 0.13Log (var) = f(voc,age) Log (var) = f(voc,age) Log (var) = f(voc)
%
ßstdVOC
ßstdage
%ßstdVOC
ßstdage
%ßstdVOC
var var var
RT_NES 0.5 -0.15 0.99 2.6 -2.00 1.58 2.1 -3.53 RT PERF 1.7 0.70 1.63 2.9 -1.51 2.19 0.5 -1.77 SRT_NES 0.7 -1.18 -0.05 1.2 -1.58 0.52 3.1 -4.25 RT DISP 3.1 -2.39 1.09 4.9 -3.13 1.47 3.3 -4.43
Table
4:
Symbol Digit test indices
REF Female REF Male APP
n m ( a ) m Ire fata») n m(or) m IOE (CTloe) n m(cj) m loa faoff)
SD_NES 20 2.60 (0.64) 0.93 (0.23) 209 2.71 (0.98) 0.93 (0.26) 585 2.72 (0.54) 0.98 (0.19) SD M 186 2.50 (0.60) 0.89 (0.23) 201 2.56 (0.60) 0.91 (0.22) 564 2.64 (0.49) 0.96 (0.18) SD G M 186 2.44 (0.58) 0.86 (0.23) 201 2.51 (0.58) 0.90 (0.22) 564 2.57 (0.46) 0.93 (0.17) SD_Sd 186 0.55 (0.27) -0.71 (0.45) 201 0.50 (0.26) -0.79 (0.43) 564 0.61 (0.26) -0.60 (0.44) SD_GSd 186 1.24(0.13) 0.21 (0.09) 201 1.21 (0.11) 0.19(0.08) 564 1.27 (0.17) 0.23 (0.11) W
w
l 0 B Ww
l o g \Vw
l 0 P SD NES 0.94 0.98 0.66 0.93 0.95 0.99 SD_M 0.93 0.98 0.93 0.97 0.94 0.98 SD G M 0.93 0.98 0.93 0.98 0.95 0.98 SD_Sd 0.88 0.99 0.79 0.99 0.86 0.99 SD GSd 0.71 0.85 0.71 0.80 0.70 0.79raw correlation raw correlation raw correlation
SD Sd SD GSd SD Sd SD GSd SD Sd SD GSd
SD M 0.63 0.66 0.60
SD_GM 0.00 0.05 0.00
log correlation log correlation log correlation
SD Sd SD GSd SD Sd SD GSd SD Sd SD GSd
SD_M 0.61 0.65 0.58
SD GM 0.00 0.04 0.00
Log (var) = f(voc,age) Log (var) = f(voc,age) Log (var) = f(voc) % var ß s t d V O C ß s t d a g e % var ß s t d V O C ß s t d a g e % var ß s t d V O C
SD NES 51 -6.7 13.3 44 -9.2 10.4 14 -9.8
SD_M 49 -6.5 12.0 44 -8.3 10.8 15 -9.9
SD G M 49 -6.4 12.1 44 -8.1 10.8 15 -9.8
SD_Sd 19 -3.5 5.8 20 -5.5 5.4 5 -5.5
Table
5:
Pattern Memory test indices
REF Female R E F Male
n m ( a ) m loe fore) n m ( a ) HI loe (<*loe) PM NES 203 19.8 (2.7) 210 20.2 (3.1) P M _ M 203 5.28(1.51) 1.63 (0.27) 210 5.26(1.61) 1.62(0.29) PM GM 203 4.91 (1.31) 1.56 (0.25) 210 4.92(1.42) 1.55 (0.28) PM_Sd 203 2.13(1.05) 0.65 (0.46) 210 2.04(1.22) 0.59 (0.47) P M GSd 203 1.44(0.12) 0.36 (0.08) 210 1.42 (0.13) 0.35 (0.08)
w
w
PM NES P M _ M P M _ G M PM_Sd P M GSd logw
w
log 0.92 0.92 0.93 0.88 0.97 0.98 0.99 0.98 0.98 0.91 0.93 0.93 0.75 0.91 0.99 0.99 0.99 0.95raw correlation raw correlation PM Sd P M GSd P M Sd PM GSd
P M _ M 0.86 0.79
PM G M 0.49 0.34
log correlation log correlation PM Sd PM GSd P M Sd P M GSd
P M _ M 0.87 0.85
P M G M 0.51 0.32
Log (var) = f(voc,age) Log (var) = f(voc,age) % var ßstdVOC ßstdage % var ßstdVOC ßstdage
PM_NES* 14 4.77 -3.79 14 5.66 -2.31
PM M 10 -1.04 4.77 8 -2.51 3.83
P M _ G M 12 -1.13 5.14 9 -2.58 4.14
P M Sd 3 -0.27 2.55 2 -1.76 1.72
P M GSd 0 -0.03 -0.19 1 -0.13 -1.30