P
ROGRESSIVE RESISTANCE TRAINING PREVENTS LOSS
OF MUSCLE MASS AND STRENGTH IN BILE DUCT
LIGATED RATS
Luise Aamann
1, Rafael Ochoa
‐Sanchez
2, Mariana Oliveira
2, Mélanie
Tremblay
2, Chantal Bémeur
2,3, Gitte Dam
1, Hendrik Vilstrup
1, Niels
Kristian Aagaard
1, Christopher F. Rose
21Department of Hepatology and Gastroenterology,Aarhus University Hospital, Aarhus, Denmark 2Hepato‐Neuro Laboratory, CRCHUM,Université de Montréal, Montréal, Québec, Canada 3Department of Nutrition,Université de Montréal, Montréal, Québec, Canada
Correspondence: Luise Aamann, MD, Department of Hepatology and Gastroenterology, Aarhus University Hospital, Aarhus, Denmark.Email: luise.aamann@gmail.com
Funding information International Society for Hepatic Encephalopathy and Nitrogen Metabolism (ISHEN) Translational Research Travel Fellowship 2015—5.000EUR; A.P. Moeller and Wife Chastine Mc‐Kinney Moeller’s Fund for General Purposes (Almene Formaal)—30.000DKK; SEB Pensions Travel Fellowship for Danish doctors—15.000DKK
A
BSTRACTBackground Loss of muscle mass and strength is common in cirrhosis and increases the risk of hyperammonaemia and hepatic encephalopathy. Resistance training optimizes muscle mass and strength in several chronic diseases. However, the beneficial effects of resistance training in cirrhosis remain to be investigated. Bile duct‐ligated (BDL) rats develop chronic liver disease, hyperammonaemia, reduced muscle mass and strength. Our aim was to test the effects of resistance training on muscle mass, function and ammonia metabolism in BDL‐rats. Methods A group of BDL‐rats underwent a progressive resistance training programme and a group of non‐exercise BDL‐rats served as controls. Resistance training comprised of ladder climbing with a progressive increase in carrying weights attached to the tail. Training was performed 5 days a week during 4 weeks. Muscle strength and body composition were assessed using grip strength and EchoMRI. Weight and circumference of the gastrocnemius muscle (normalized to bodyweight), plasma ammonia and glutamine synthetase protein expression and activity were assessed. Results BDL + exercise rats had significantly larger gastrocnemius circumference compared to non‐exercise BDL‐rats: ratio 0.082 vs 0.075 (P < 0.05). Gastrocnemius muscle weight was higher in exercisers than controls: 0.006 vs 0.005 (P < 0.05). A tendency towards a lower plasma ammonia in the exercise group compared to controls was observed (P = 0.10). There were no differences in lean body mass, GS protein expression and activity between the groups. Conclusion Resistance training in rats with chronic liver disease beneficially effects muscle mass and strength. The effects were followed by non‐significant reduction in blood ammonia; however, a tendency was observed.
ABBREVIATIONS
BDL bile duct ligation BDL‐rat bile duct‐ligated rat
GS glutamine synthetase HE hepatic encephalopathy TCA tricarboxylic acid
INTRODUCTION
Diminished skeletal muscle mass and strength are frequent complications in cirrhosis, and adversely influence clinical outcomes. Loss of muscle mass is an independent risk factor for complications and mortality in chronic liver disease.1, 2
Glutamine synthetase (GS) is an ammonia‐utilizing enzyme that catalyzes the synthesis of glutamine from glutamate. The activity of GS is low in muscle tissue but being the largest organ in the body, it plays a substantial compensatory role when ammonia detoxification in the liver is significantly reduced.3 Hence, in relation to complications and especially the treatment of hepatic encephalopathy (HE), optimizing skeletal muscle mass may be an important target.4
Physical activity, especially resistance training, can be beneficial in optimizing skeletal muscle mass. To date, only few studies have investigated the beneficial effects of exercise on skeletal muscle in cirrhotic patients.5 In addition, these studies focused solely on aerobic exercise. It was observed that aerobic exercise had a positive effect on endurance and on muscle mass.6-8
Resistance training is superior for muscle‐building and ‐strengthening when compared to other types of exercise.9 Resistance training accelerates protein synthesis, induces muscle hypertrophy and increases strength in healthy individuals.10 Currently, no studies have investigated the effects of resistance training on muscle mass or strength in cirrhosis (both animal models and patients). Since the loss of muscle mass remains a highly prevalent complication in cirrhosis, intervention strategies including resistance exercise programmes to help optimize skeletal muscle during chronic liver disease are highly warranted.
Chronic liver disease following bile duct ligation (BDL) in the rat is a well‐characterized model which leads to complications such as jaundice, ascites, portal hypertension, hyperammonaemia and HE. Additionally, BDL‐rats develop muscle abnormalities with loss of muscle mass and reduction in force.11, 12 Previous animal studies suggest that hyperammonaemia may play an important part in the pathogenesis that lies behind the development of muscle abnormalities.11-14
The aim of this study was to evaluate the effect of 4 weeks of progressive resistance training on optimizing skeletal muscle mass and strength in BDL‐rats. In addition, we tested the effects of resistance exercise on ammonia metabolism.
METHODS
Bile duct ligation (BDL) was performed to induce chronic liver disease in male Sprague‐Dawley rats (175‐200 g; Charles River, QC, Canada). The rats were anesthetized by isoflurane. During laparotomy, the common bile duct was located, ligated and resected under a dissecting microscope.11 All rats resided in controlled conditions (22°C, 12 hours:12 hours dark‐light cycle) with free access to food and water.
Twenty‐six rats were bile duct‐ligated. One BDL‐rat died during the week of convalescence. The remaining BDL‐rats were randomly split into two groups before the habituation period and referred to as; BDL‐exercisers (n = 13) and BDL‐controls (n = 12). BDL‐exercisers performed resistance training for 4 weeks while BDL‐controls did not undergo resistance training (non‐exercisers). All rats were sacrificed 5 weeks post‐surgery.
All experiments were conducted following the guidelines of the Canadian Council on Animal Care and were approved by the Animal Protection Committee of the Centre de Recherche du Centre Hospitalier de l'Université de Montréal (CRCHUM).
EXERCISE PROTOCOL
The resistance training equipment (a ladder) for rodents was previously described by Hornberger et al. The ladder measured 110 cm in height with 80‐85° of inclination and had a housing chamber placed on the top.15, 16 Instead of steps, our ladder consisted of a wire mesh.
One week after surgery, a 2‐day habituation period with equipment familiarization was introduced to BDL‐exercisers. Day one of habituation; for the first climb, the rats were placed on the ladder 10 cm from the top (housing chamber), for the 2nd climb in the middle of the ladder and at the bottom of the ladder for 3rd‐8th climb. During the 6th‐8th climb, an empty plastic tube was attached to the tail with medical tape. Between each climb, rats rested for 2 minutes in the housing chamber. Day two of habituation was a repeat of day one except weights were inserted into the plastic tubes bound to the tail for the 3rd‐8th climb. The maximal carrying load was determined by adding 30 g to each subsequent climb following the established baseline (50% of bodyweight) until exhaustion (when the rats could not complete the climb).
After the 2‐day habituation period, 18 exercise sessions were performed 5 days per week until sacrifice. All rats were well qualified to perform resistance training after a 2‐day habituation period. Each session consisted of climbing the ladder with a carrying a load and that every second climb increased
progressively from 50%, 75%, 90% to 100% of the maximal load. If all eight climbs were successfully completed, an extra 40 g were added to the 9th climb ‐setting a new maximal load. Each animal performed 8‐12 dynamic movements/repetitions per climb.17
All BDL‐exercisers successfully completed the resistance training programme without injuries or death. There was a whole day's rest between last exercise session and sacrifice.
Body weight and food intake were measured weekly. Standard rodent chow (TD.2819, 18% protein, Envigo, Madison, WI, USA) and water were offered ad libitum. Rats were housed two rats per cage, and food consumption was measured as a mean per week for each rat.
MUSCLE STRENGTH
Muscle strength was measured by a grip strength metre using a digital force gauge (Chatillon® DFE‐ 010; AMETEK TCI Division, Largo, FL, USA) with mesh pull bars. The peak strength applied to the gauge was recorded in series of four and the mean value was calculated. The hindlimb strength was measured placing the mesh pull bar of the gauge in a 45‐degree angle and facing the rat away from the gauge. While gently supported at the thorax and base of the tail, the rat was lowered to the gauge, grapping the bar firmly with both hind paws and then slowly pulled backwards until releasing the bar. The forelimb strength was measured positioning the gauge horizontally, both front paws were placed on the pull bar and the rat was gently pulled in a straight direction away from the bar until releasing it.18
GASTROCNEMIUS MUSCLE WEIGHT AND CIRCUMFERENCE
After sacrifice the right‐sided gastrocnemius muscle was carefully exposed. Circumference of the muscle was measured by a scaled thread, while the muscle was still attached to the leg and after dissection the wet weight was measured using an electronic scale.
BODY COMPOSITION
Whole body composition was estimated before sacrifice by EchoMRi 700® Body Composition Analyzer (R & D EchoMRi LLC, Houston, TX, USA) ‐a nuclear magnetic resonance (NMR) system. The non‐sedated rats were placed in a plastic tube for 3‐4 minutes. Whole body mass measures of fat, lean, total water and free water were measured.19
BLOOD SAMPLES
At sacrifice, arterial plasma drawn from the heart was snap frozen and stored at −80°C. Blood samples were measured by the biochemistry department at CRCHUM, Montréal, Canada. Plasma ammonia μmol/L was measured using enzyme glutamate dehydrogenase (Randox Laboratories Ltd, Crumlin, UK) as a mean of three measurements.20
GLUTAMINE SYNTHETASE PROTEIN EXPRESSION
Western blot assays were performed to assess GS protein levels. Briefly, after protein quantification using Bio‐Rad DC protein assay kit (Bio‐Rad Laboratories, Irvine, CA, USA), 5 µg of muscle lysates were mixed in Laemmli buffer, heated for 5 minutes at 100°C and loaded into 9% sodium dodecyl‐ sulphate polyacrylamide gels (SDS‐PAGE resolving gel: 0.375 mol/L Tris pH 8.8; 0.1% sodium dodecyl sulphate; 9% acrylamide). After electrophoresis, proteins were transferred to a nitrocellulose
membrane (Bio‐Rad Laboratories) and blocked for 1 hour in a solution of Tris‐buffered saline + Tween
20 (TBST)‐Milk (1 mmol/L Tris; 10 mmol/L NaCl; 0.5% Tween‐20; 5% skimmed milk). Mouse anti‐
GS antibody (BD Biosciences, Billerica, ME, USA) was diluted to 1/2000 in TBST‐Milk and incubated for 1 hour. The membranes were washed with TBST solution for five times of 5 minutes and then incubated with horseradish peroxidase (HRP) conjugated secondary antibody (anti‐mouse IgG, Jackson ImmunoResearch, West Grove, PA, USA). After further washes, the membranes were exposed to an antibody detection reagent (Clarity Western ECL substrate, Bio‐Rad Laboratories) and imaged using the ChemiDoc imaging system using the ―chemiluminescent blot‖ setting (Bio‐Rad Laboratories). The GS expression was normalized by total protein staining as described by Ladner et al.21 Briefly, 0.5% trichloroethanol was added to all SDS‐PAGE gels. After electrophoresis, gels were exposed to UV light for 45 seconds for activation, using the stain free gel setting of the ChemiDoc imaging system. Immediately after transfer, the nitrocellulose membrane was imaged for the total protein using the ―stain free blot‖ setting of the ChemiDoc imaging system. Finally, we quantified the total protein as well as the GS protein using the Image Lab software (Bio‐Rad Laboratories).
GLUTAMINE SYNTHETASE ACTIVITY
Glutamine synthetase activity was determined in gastrocnemius muscle based on the formation of a γ‐ glutamylhydroxamate ferric chloride complex. Briefly, after protein quantification using Bio‐Rad DC protein assay kit (Bio‐Rad Laboratories), muscle lysates (30 µL) were incubated with reaction mix
(100 mmol/L Imidazole; 50 mmol/L sodium l‐glutamate; 10 mmol/L β‐mercaptoethanol; 20 mmol/L
disodium ATP; 40 mmol/L magnesium chloride and 100 mmol/L hydroxylamine) for 1 hour at 37°C. The reaction was terminated by adding the stop solution (0.37 mol/L ferric chloride; 0.67 mol/L hydrochloric acid and 0.2 mol/L trichloroacetic acid). After 30 minutes at 4°C, absorbance was measured at 530 nm. Results are expressed as activity by µg of protein.22
BRAIN WATER CONTENT
Brain water content was measured using the sensitive densitometry technique. After the animal was sacrificed, the frontal cortex was freshly dissected at 4°C and cut into 2‐mm3 pieces. Tissue pieces were placed in density gradient columns, and the equilibrium point was recorded after 2 minutes. Columns were made with different kerosene and bromobenzene mixtures and precalibrated with K2SO4
solutions of known densities. Eight sample measurements were averaged in each rat. Water content was calculated based on tissue density.23
THE OPEN FIELD TEST
The open field test is an indicator of exploratory behaviour, activity and anxiety. The open field test (software SMART® version 2.5, Panlab, Spain) consisted of an open black box (90 × 90 × 40 cm) placed in a quiet, dimly lit room and with a video camera equipped with an automatic movement tracking system connected to a computer and placed above the box. The open field area was divided in a central zone (45 × 45 cm) and a peripheral zone. The rat was placed in the room 30 minutes prior to
testing, and at the start of the test placed in the periphery of the open field for 1 minute. Behaviour was recorded for the subsequent 5 minutes.
The total length of each tracked trail was measured. Time spent in central zone as well as the number of entries into the central zone were indicators of natural exploratory behaviour and anxiety.24
STATISTICAL ANALYSIS
Data are expressed as mean ± standard error of the mean (SEM) or median with interquartile ranges (IQR). Significance of difference between the BDL‐exercise and BDL‐control groups was tested with unpaired t test or Wilcoxon Mann‐Whitney test when appropriate. Correlation was assessed using Pearson's correlation. All tests were run using GraphPad Prism 6 (La Jolla, CA, USA). P‐values < 0.05
were considered statistically significant.
RESULTS
EXERCISE
All BDL‐exercisers completed the protocol. The average maximal carrying load progressed throughout 18 sessions without any decrease the last week from session 1:280 ± 6 g to session 18:760 ± 9 g.
BODY WEIGHT AND FOOD CONSUMPTION
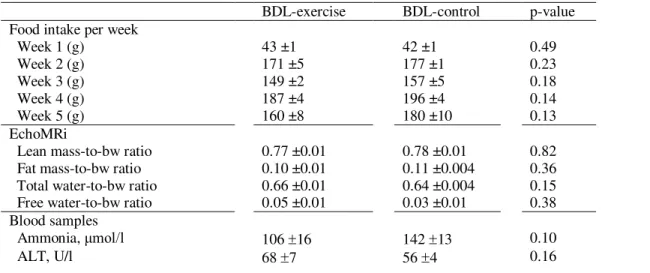
Both at baseline and at week one (start of resistance training), body weight was similar between groups. Both groups consumed an equivalent amount of food (isocaloric and isonitrogenous diet) every week (see Table 1 for details). The BDL‐exercisers had a significant lower body weight compared to the BDL‐controls during the last 2 weeks. Week 4:352 ± 8 g vs 381 ± 11 g (P = 0.05) and week 5:364 ± 10 g vs 402 ± 11 g (P = 0.02).
Table 1. Results
BDL-exercise BDL-control p-value
Food intake per week
Week 1 (g) 43 ±1 42 ±1 0.49 Week 2 (g) 171 ±5 177 ±1 0.23 Week 3 (g) 149 ±2 157 ±5 0.18 Week 4 (g) 187 ±4 196 ±4 0.14 Week 5 (g) 160 ±8 180 ±10 0.13 EchoMRi
Lean mass-to-bw ratio 0.77 ±0.01 0.78 ±0.01 0.82
Fat mass-to-bw ratio 0.10 ±0.01 0.11 ±0.004 0.36
Total water-to-bw ratio 0.66 ±0.01 0.64 ±0.004 0.15
Free water-to-bw ratio 0.05 ±0.01 0.03 ±0.01 0.38
Blood samples
Ammonia, μmol/l 106 16 142 13 0.10
AST, U/l 297 32 256 17 0.27 ALP, U/l 455 ±48 548 ±79 0.32 GGT, U/l 23 3 21 1 0.53 Bilirubin, μmol/l 161 2 175 8 0.46 Albumin, g/L 20 1 21 1 0.50 GS
Activity, unit/ug protein 0.18 0.004 0.18 0.004 0.49
Relative protein expression, GS band intensity/total band intensity
2.20 ±0.18 1.98 ±0.21 0.37
Brain water % 80.2 0.5 79.7 0.6 0.55
Values are given as mean ± SEM. Bw bodyweight; ALP alkaline phosphatase; ALT alanine aminotransferase; GGT gamma-glutamyl transferase; AST aspartate transami-nase; GS glutamine synthetase
Values are given as mean ± SEM.
ALP, alkaline phosphatase; ALT, alanine aminotransferase; AST, aspartate transami‐nase; BW, bodyweight; GGT, gamma‐glutamyl transferase; GS, glutamine synthetase.
3.3MUSCLE SIZE AND GRIP STRENGTH
The BDL‐exercisers had a significantly larger gastrocnemius circumference (mm) normalized to bodyweight (g) compared to controls: ratio 0.082 ± 0.001 vs 0.075 ± 0.002 (P = 0.01; Figure 1A). The weight of the gastrocnemius normalized to bodyweight (g) was also significantly higher in exercisers compared to controls: 0.0060 ± 0.0003 vs 0.0053 ± 0.0001 (P = 0.04; Figure 1B). A correlation was found between the gastrocnemius muscle weight and circumference; r = 0.61 (P = 0.001).
Figure 1 A, Gastrocnemius circumference by bodyweight, B, Gastrocnemius weight by bodyweight, C, Strength in hindlimbs all presented as mean ± SEM. Unpaired t test compared BDL‐exercisers to BDL‐controls, results shown as *P < 0.05. D, Pearson's correlation tested gastrocnemius circumference and hindlimb strength, both normalized to bodyweight (BW)
Grip strength was significantly stronger in BDL‐exercisers vs BDL‐controls in both forelimbs:
1310 ± 40 g vs 1064 ± 38 g (P < 0.01) and hindlimbs: 690 ± 17 g vs 596 ± 33 g (P = 0.02; Figure 1C). Hindlimb strength correlated with gastrocnemius weight; r = 0.69 (P < 0.001) and gastrocnemius circumference; r = 0.74 (P < 0.001; Figure 1D).
WHOLE BODY COMPOSITION
There was no significant difference in whole body composition parameters (lean mass, total water, free water and fat mass normalized with body weight) between the groups 5 weeks after surgery (Table 1).
BLOOD SAMPLES
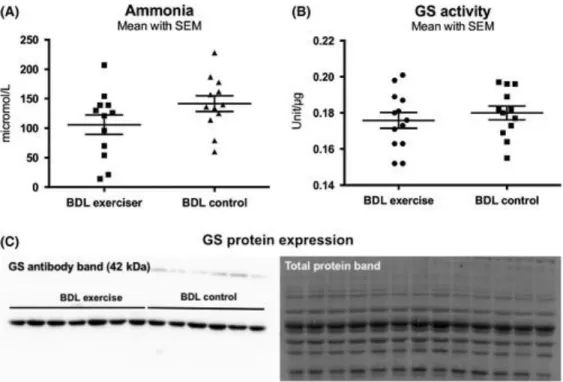
A reduction in plasma ammonia levels in BDL‐exercisers vs BDL‐controls was observed but did not reach significance: 106 ± 16 μmol/L vs 142 ± 13 μmol/L (P = 0.10; Figure 2A). Moreover, there was no significant difference in the liver biochemistry between the groups (Table 1).
Figure 2 A, Ammonia levels. No difference was seen, P = 0.10. B, GS activity is presented as mean ± SEM activity by µg of protein. Unpaired t test compared BDL‐exercisers to BDL‐controls. C, Western plot showing GS protein expression in muscle in BDL‐exercisers compared to BDL‐controls. Total protein band is shown as quantification. Results in A and B are expressed as mean ± SEM of bands density of GS by total protein expression
GLUTAMINE SYNTHETASE
There was no significant difference in GS protein expression and GS activity between the groups (Table 1 and Figure 2B,C).
BRAIN WATER CONTENT
There was no difference in brain water content between the groups (Table 1).
THE OPEN FIELD TEST
There was an increase in the total distance travelled between the two groups but this difference did not reach significance; distance travelled BDL‐exercisers vs BDL‐control: 54 ± 6.9 cm vs 35 ± 7.4 cm (P = 0.07). However, the exercisers explored and entered the centre more frequently than controls. Total time in centre was (median and IQR): 2.1 (0.9‐4.2)% vs 0.3 (0.0‐1.0)% (P = 0.008). Number of entries to the centre was (median and IQR): 3 (1‐5.5) times vs 0.5 (0.0‐1.8) times (P = 0.03).
DISCUSSION
To the best of our knowledge, this is the first study to show that resistance training in BDL‐rats diminishes the aggressive loss of both muscle size and strength (P < 0.05, Figure 1A,B). Our findings are in accordance with previous studies in other chronic disease states where strength and size of muscle improved with resistance training.25, 26 Plasma ammonia tended to be lower in the exercise group but did not reach significance (P = 0.10) and no improvement in behaviour or brain oedema was observed in BDL‐exercisers vs BDL‐controls. Whether an extended amount of time is required to observe a significant reducing effect on plasma ammonia and subsequently an improvement in HE remains to be further investigated.
Using EchoMRI, it was found that the overall lean body mass of the BDL‐exercisers was unaffected. As seen in previous studies, specific exercise protocols affect certain muscles. Similar resistance training protocols have led to regional hypertrophy in gastrocnemius, flexor hallucis and digitorum longus muscles—all important climbing muscles.27, 28 Therefore, since only certain muscles may benefit from the exercise protocol, this may explain insignificant changes in lean body mass between the two groups. The resistance training protocol involves equipment which replicates the rodents natural climbing habits and therefore probably predisposes to affect the hindlimb relative to whole body. Moreover, fluid retention in cirrhosis often disturbs the estimates of lean mass. The lean body mass results should therefore be interpreted with caution compared to direct muscle measurements.29 The gastrocnemius muscle does not directly contribute to the hindlimb grip strength. However, the extension of the tarsal joint caused by the muscle opposes the movement caused by the grip strength test and thereby contributes to the overall recorded strength.18 Nonetheless, the clear correlations between gastrocnemius size (weight and circumference) and strength support that we optimized muscle fibre components and did not just increase muscle size by water retention.
Previous studies have shown that BDL‐rats have a reduced muscle protein synthesis causing depletion of lean body mass including reduced gastrocnemius circumference and weight compared to healthy rats (SHAM‐operated).11 Also, in BDL‐mice, the cross‐sectional area of quadriceps is decreased with a reduced number of myofibres and disturbed contractile dysfunctions (reduced time to fatigue and force).12 These muscle abnormalities imitate muscle depletion in patients with cirrhosis. Therefore, the BDL‐model is a suitable model to test the effects of exercise on muscle and ammonia levels in chronic liver disease. This is the first study to demonstrate that BDL‐rats are capable of performing a
progressive resistance training programme. The protocol was well‐tolerated and thus, the BDL‐rat is a qualified animal model for future tests of the effects of resistance training in chronic liver disease.
The improved muscle size may support ammonia removal using branched‐chain amino acids (BCAA)
as substrates for the tricarboxylic acid (TCA) cycle, enhancing α‐ketoglutarate and glutamate formation and ultimately stimulating glutamine synthesis. Optimizing skeletal muscle mass may therefore
improve extra‐hepatic ammonia clearance.30 The gastrocnemius muscle changed favourably in the exercise group, and we observed a non‐significant tendency towards a decrease in plasma ammonia in exercisers. We did not see an increase in GS protein expression and GS activity in muscle. Originally, it was found that 50% of the arterial ammonia is metabolized in muscle tissues in liver disease.31 GS muscle activity is normally very low, but due to the large muscle volume a minor increase in GS could alter plasma ammonia. This may be statistically difficult to obtain. Additionally, muscle GS protein expression and activity are already elevated in BDL‐rats compared to SHAMs.32 Thus, this protocol may not induce a further increase in GS activity but by increasing muscle mass volume, it increases the capacity of ammonia removal by muscle. However, the increase in muscle mass following resistance training did not lead to a significant reduction in plasma ammonia, but a strong trend. An extended amount of time with muscle mass optimization may be required to see a significant effect on plasma ammonia in BDL‐rats. Furthermore, there is also the possibility of limited TCA cycle substrates, as the levels of BCAA are known to be low in cirrhosis.33
Nevertheless, it is worth noting that muscle optimization occurred in spite of hyperammonaemia. In animal models, it has been shown that hyperammonaemia causes muscle depletion and contractile dysfunction.14, 34 Ammonia may upregulate myostatin expression35 and myostatin has been shown to be elevated in BDL‐models.12 Myostatin deactivates the mammalian target of rapamycin (mTOR) resulting in decreased protein synthesis and increased autophagy, at least in part mediated through downstream molecules as p70S6K and 4E‐BP1.35, 36 Several physiological factors are triggered by resistance training, but among other, weight training activates protein synthesis trough the above mentioned mTOR pathway.37 This indicates exercise can counteract hyperammonaemia. Further investigations are required to describe the underlying pathways.
The two BDL groups maintained a similar weight on an isocaloric and isonitrogenous diet until week 4, when the BDL‐exercisers had a significantly lower weight compared to BDL‐controls. This is in
accordance with other exercise studies and possibly caused by the elevated energy requirements from the intensive exercise programme.38, 39 The increased activity level with a liver‐induced catabolic state may have required additional nutritional supplements to avoid further muscle proteolysis and ensure an optimal environment for optimizing muscle mass. Therefore, an increased calorie and food intake in the exercise group probably could have improved the strength and muscle size further.
In this study, brain oedema was not affected by exercise. This is to be expected since the reduction in blood ammonia was not significant. It has been previously demonstrated that lowering plasma
ammonia in BDL‐rats leads to an improvement in brain oedema.40 However, other factors are believed to be involved in the pathogenesis of brain oedema. However, we did see less anxiety and more
exploring in BDL‐exercisers vs non‐exercisers using the Open Field Test; even though the BDL‐rat is known to be less active.41 This may point towards an increased brain function and an ameliorating effect of exercise on HE symptoms. However, this remains to be thoroughly investigated.
One major study limitation is the duration of the exercise protocol. The survival of the BDL‐rat is restricted to approximately 5 weeks including 1 week of convalescence. This limits the total
intervention time to 4 weeks. In addition, the required time following muscle mass optimization to see an effect on plasma ammonia may be limited. Chronic liver disease induced by carbon tetrachloride (CCl4) could enable exercise to be tested for longer periods of time, but in these toxin models, TNF‐α
and IL‐6 have been suggested as the main contributors to myopenia.12 Variables such as carrying loads, duration and frequency of exercises are all adjustable and could strengthen the desired outcomes. Previous resistance training protocols for healthy and diseased rodents span from 1 to 26 weeks.16 However, we believe that the most suitable protocol to investigate the liver‐muscle‐axis involves the BDL‐model.
CONCLUSION
Four weeks of exercise in BDL‐rats optimized the overall skeletal muscle strength and the size of hindlimbs (gastrocnemius weight and circumference) compared to BDL‐controls. Despite an increase in muscle mass, a significant decrease in blood ammonia was not observed but rather a trend. The BDL‐rats were able to perform progressive resistance training despite of severe liver disease. We believe that this is an interesting model to test the pathways in the liver‐muscle‐axis influenced by resistance training.
ACKNOWLEDGEMENTS
A special gratitude to all the colleges at CRCHUM who worked on this project during weekdays and
weekends: Marcos Ocaña‐Sanchez, Kim‐Phat Pham, Grégory Petrazzo, Xiaoru Chen, Julia Ruf and
Marc‐André Clément. We thank the Cardiometabolic and Behaviour Phenotyping core facilities of CRCHUM for EchoMRI and behaviour instruments.
CONFLICT OF INTEREST
The authors do not have any disclosures to report.
R
EFERENCES1.Montano‐Loza AJ, Meza‐Junco J, Prado C, et al. Muscle wast‐ing is associated with mortality in patients with cirrhosis. Clin Gastroenterol Hepatol. 2012;10:166‐173.
2.Merli M, Giusto M, Lucidi C, et al. Muscle depletion increases the risk of overt and minimal hepatic encephalopathy: results of a pro‐ spective study. Metab Brain Dis. 2013;28:281‐284.
3.Hod G, Chaouat M, Haskel Y, Lernau OZ, Nissan S, Mayer M. Ammonia uptake by skeletal muscle in the hyperammonaemic rat. Eur J Clin Invest. 1982;12:445‐450.
4.Dasarathy S, Mookerjee RP, Rackayova V, et al. Ammonia toxicity: from head to toe? Metab Brain Dis. 2017;32:529‐538.
5.Duarte‐Rojo A, Ruiz‐Margáin A, Montaño‐Loza AJ, Macías‐Rodríguez RU, Ferrando A, Kim WR. Exercise and physical activity for patients with end‐stage liver disease: Improving functional sta‐tus and sarcopenia while on the transplant waiting list. Liver Transpl. 2018;24:122‐139.
6.Román E, Torrades MT, Nadal MJ, et al. Randomized pilot study: effects of an exercise programme and leucine supplementation in patients with cirrhosis. Dig Dis Sci. 2014;59:1966‐1975.
7.Román E, García‐Galcerán C, Torrades T, et al. Effects of an exercise programme on functional capacity, body composition and risk of falls in patients with cirrhosis: A randomized clinical trial. PLoS ONE. 2016;11:e0151652.
8.Zenith L, Meena N, Ramadi A, et al. Eight weeks of exercise training increases aerobic capacity and muscle mass and reduces fatigue in pa‐tients with cirrhosis. Clin Gastroenterol Hepatol. 2014;12:1920‐1926.
9.Nelson ME, Rejeski WJ, Blair SN, et al. Physical activity and pub‐lic health in older adults: recommendation from the American College of Sports Medicine and the American Heart Association. Circulation. 2007;116:1094‐1105.
10.Biolo G, Maggi SP, Williams BD, Tipton KD, Wolfe RR. Increased rates of muscle protein turnover and amino acid transport after resis‐tance exercise in humans. Am J Physiol Metab. 1995;268:E514‐E520.
11.Bosoi CR, Oliveira MM, Ochoa‐Sanchez R, et al. The bile duct li‐gated rat: A relevant model to study muscle mass loss in cirrhosis. Metab Brain Dis. 2017;32:513‐518.12.Giusto M, Barberi L, Di Sario F, et al. Skeletal muscle myopenia in mice model of bile duct ligation and carbon tetrachloride‐induced liver cirrhosis. Physiol Rep. 2017;5:e13153.
13.Butterworth RF, Norenberg MD, Felipo V, Ferenci P, Albrecht J, Blei AT. Experimental models of hepatic encephalopathy: ISHEN guide‐lines. Liver Int. 2009;29:783‐788.
14.Qiu J, Tsien C, Thapalaya S, et al. Hyperammonemia‐mediated auto‐phagy in skeletal muscle contributes to sarcopenia of cirrhosis. Am J Physiol Metab. 2012;303:E983‐E993.
15.Hornberger TA Jr, Farrar RP. Physiological hypertrophy of the FHL muscle following 8 weeks of progressive resistance exercise in the rat. Can J Appl Physiol. 2004;29:16‐31.
16.Krause Neto W, De Assis SW, Ciena AP, Anaruma CA, Gama EF. Vertical climbing for rodent resistance training: a discussion about training parameters. Int J Sport Sci. 2016;6:36‐49.17.Harris MB, Slack KN, Prestosa DT, Hryvniak DJ. Resistance training improves femoral artery endothelial dysfunction in aged rats. Eur J Appl Physiol. 2010;108:533‐540
17 Maurissen JP, Marable BR, Andrus AK, Stebbins KE. Factors affect‐ing grip strength testing. Neurotoxicol Teratol. 2003;25:543‐ 553.19.Nixon JP, Zhang M, Wang C, et al. Evaluation of a quantitative mag‐netic resonance imaging system for whole body composition analy‐sis in rodents. Obesity. 2010;18:1652‐1659.
20.Agostoni V, Lee SH, Forster V, et al. Liposome‐supported peritoneal dialysis for the treatment of hyperammonemia‐associated enceph‐alopathy. Adv Funct Mater. 2016;26:8382‐8389.
21.Ladner CL, Yang J, Turner RJ, Edwards RA. Visible fluorescent de‐tection of proteins in polyacrylamide gels without staining. Anal Biochem. 2004;326:13‐20.
22.Calas A‐G, Richard O, Même S, et al. Chronic exposure to glufos‐inate‐ammonium induces spatial memory impairments, hippocam‐ pal MRI modifications and glutamine synthetase activation in mice. Neurotoxicology. 2008;29:740‐747.
23.Marmarou A, Poll W, Shulman K, Bhagavan H. A simple gravimet‐ric technique for measurement of cerebral edema. J Neurosurg. 1978;49:530‐537.
24.Méndez M, Méndez‐López M, López L, et al. Spatial memory alter‐ations in three models of hepatic encephalopathy. Behav Brain Res. 2008;188:32‐40.
25.Kongsgaard M, Backer V, Jørgensen K, Kjaer M, Beyer N. Heavy resistance training increases muscle size, strength and physical function in elderly male COPD‐patients–a pilot study. Respir Med. 2004;98:1000‐1007
.26.Feiereisen P, Delagardelle C, Vaillant M, Lasar Y, Beissel J. Is strength training the more efficient training modality in chronic heart failure? Med Sci Sport Exerc. 2007;39:1910‐1917.
27.Park H, Farrar RP, Lee S. Resistance training results in selective hy‐pertrophy of skeletal muscle in both young and middle‐age rats.pdf. Korean J Exerc Nutr. 2008;12:127‐132.
28.Cassilhas RC, Reis IT, Venâncio D, Fernandes J, Tufik S, de Mello MT. Animal model for progressive resistance exercise: a detailed description of model and its implications for basic research in exer‐cise. Mot Rev Educ Física. 2013;19:178‐184.
29.Pirlich M, Schutz T, Spachos T, et al. Bioelectrical impedance anal‐ysis is a useful bedside technique to assess malnutrition in cirrhotic patients with and without ascites. Hepatology. 2000;32:1208‐1215.
30.Dam G, Keiding S, Munk OL, et al. Branched‐chain amino acids in‐crease arterial blood ammonia in spite of enhanced intrinsic muscle ammonia metabolism in patients with cirrhosis and healthy sub‐jects. Am J Physiol. 2011;301:269‐277.
31.Lockwood AH, McDonald JM, Reiman RE, et al. The dynamics of ammonia metabolism in man. Effects of liver disease and hyperam‐ monemia. J Clin Invest. 1979;63(3):449–460.
32.Jover‐Cobos M, Noiret L, Lee K, et al. Ornithine phenylacetate targets alterations in the expression and activity of glutamine syn‐thase and glutaminase to reduce ammonia levels in bile duct ligated rats. J Hepatol. 2014;60:545‐553.
33.Dam G, Sørensen M, Buhl M, et al. Muscle metabolism and whole blood amino acid profile in patients with liver disease. Scand J Clin Lab Invest. 2015;75:674‐680.
34.McDaniel J, Davuluri G, Hill EA, et al. Hyperammonemia results in reduced muscle function independent of muscle mass. Am J Physiol Gastrointest Liver Physiol. 2015;310:G163‐G170.
35.Qiu J, Thapaliya S, Runkana A, et al. Hyperammonemia in cirrhosis induces transcriptional regulation of myostatin by an NF‐B‐medi‐ ated mechanism. Proc Natl Acad Sci USA. 2013;110:18162‐18167.
36.Fyfe JJ, Bishop DJ, Stepto NK. Interference between Concurrent Resistance and Endurance Exercise: Molecular Bases and the Role of Individual Training Variables. Sports Med. 2014;44(6):743–762.
37.Ogasawara R, Fujita S, Hornberger TA, et al. The role of mTOR signalling in the regulation of skeletal muscle mass in a rodent model of resistance exercise. Sci Rep. 2016;6:31142.
38.Barone R, Bellafiore M, Leonardi V, Zummo G. Structural analysis of rat patellar tendon in response to resistance and endurance train‐ ing. Scand J Med Sci Sport. 2009;19:782‐789.
39.Hall KE, McDonald MW, Grisé KN, Campos OA, Noble EG, Melling C. The role of resistance and aerobic exercise training on insulin sensitivity measures in STZ‐induced Type 1 diabetic rodents. Metabolism. 2013;62:1485‐1494.
40.Bosoi CR, Parent‐Robitaille C, Anderson K, Tremblay M, Rose CF. AST‐120 (spherical carbon adsorbent) lowers ammonia levels and attenuates brain edema in bile duct‐ligated rats. Hepatology. 2011;53:1995‐2002.
41.Chan C‐Y, Huang S‐W, Wang T‐F, et al. Lack of detrimental effects of nitric oxide inhibition in bile duct‐ligated rats with hepatic en‐ cephalopathy. Eur J Clin Invest. 2004;34:122‐128.