2
ACKNOWLEDGEMENT
I would like to thank the jury members Dr. Michel Ephritikhine, Dr. Catherine Santini for accepting to be a reporter of this dissertation, Prof. J. David Come-Hamilton and Prof. Montserrat Gomez for accepting to examine my PhD studies.
I would like to present my special appreciation to Dr. Karine Philippot first for accepting me in the team and second for her endless guidance, patience, support and motivation, especially in desperate times, throughout my PhD studies and in the completion of this dissertation. I also would like to thank for her kindness and mother-like attitude beyond as a supervisor.
I would like to express my sincere gratitude to Dr. Bruno Chaudret for sharing his vast knowledge during priceless scientific discussions and also for his guidance, support and encouragement during my PhD studies. I am deeply honored to have a chance to work him, and to be alumni of his highly respected research group.
FP7-NMP2-Large Program Project (Synflow 2010-246461) is acknowledged for financial support. I also present my appreciation to Dr. Jacorien Coetzee and Prof. J. David Come-Hamilton for their collaboration to test the catalytic activity of the nanoparticles in the framework of Synflow Project.
All current and former Equipe L members, Prof. Catherine Amiens, Dr. Diana Ciuculescu-Pradines, Dr. Pierre Fau, Dr. Myrtil Khan, Dr. Katia Fajerwerg are also acknowledged for their scientific discussions and also kindness towards me from the beginning to the end of my PhD.
I would like to extend my gratitude to Dr. Pierre Lecante for X-ray analyses, to Prof. Romuald Poteau for theoretical calculations and Vincent Collière, Dr. Pier-Francesco Fazzini and Dr. Alvaro Mayoral for electron microscopy experiments and for their valuable contribution for the characterization of nanoparticle systems presented in this dissertation.
4
Thanks to Dr. Yannick Coppel and Dr. Christian Bijani for nuclear magnetic resonance experiments and for their valuable scientific discussions; Stéphanie Seyrac for thermogravimetric analyses, Jean-François Meunier for gas chromatography analyses, Alain Moreau for elemental analyses.
My special thanks to my lab- and office-mate Dr. Marlene Branca, my compatriots Dr. Şölen Kınayyiğit, Murat and İrem Bronz and to my great friends Dr. Nuria Romero, Dr. Natalia Jesus Costa, Lucas Vono, Dr. Patricia Lara, Dr. Miguel Guerrero, Dr. Rosa Axet, Dr. Valentina Castagnola, Dr. Luca Boselli, Dr. Muh-Mei Wei for being more than a friend and making me always feel at home in France and also for their endless encouragement and motivation throughout my thesis studies. Without these valuable people, it would not be possible to overcome this challenging road with many obstacles. I appreciate their presence, friendship and amusement.
Many thanks also to my former and current laboratory collaborators Pascal, Luis-Miguel, Mahmoud, Jérémy, Stefanos, Frédéric, Sébastien, Grégory, Eric, Torsten and Arnaud for their scientific discussions and also good friendship.
The colleagues from other teams of LCC, Audrey, Aurelien, Yohan, Pauline, Quentin, Chiara, Kevin, Sébastien, Gilles, Guanghua, Carlos, Yin, Ludovic, Rémy and Si are also acknowleged for having amusement and pleasant moments in the last 3.5 years.
I am thanktful to all visiting scholars of our research group, Roberto, Fernando, Jonathan, Jorge, Jordi, Gerard, Stefano, Nerio, Katie, Tatiana and Baptiste for bringing different atmosphere to the team and for their valuable friendship.
Thanks to all CNRS employees Isabelle Boutannet, Nataly Aulier, Gaëtan Havet, Mélanie Bégué, Florence Di Clemente, Patricia Fouquereau, Fabrice Candau, Philippe Prono, Michel Maupomé, Martine Marine, Michel and Brigitte Griessinger for their smiling faces each day and precious patient and endless help in administrative works.
My special thanks to my precious friends Melek Dinç, Neval Çelebi, Kerem Buran, Svetlana Borukhova, Huriye Erdoğan and Elmas Aydoğan for being such a good friend for more than 9 years…
The last but not the least, my special appreciation and great thankfulness are dedicated to my mum İjlal Ayvalı, my dad Ahmet Ayvalı, my sister Ayça Akdeniz and brother-in-law Arda Akdeniz for their love, patience and moral support during the period of my PhD studies and my nephew Derin Akdeniz for making me happy by his just a little smile. Also thank to my cousin Gökçe Güneş for her moral support and motivation.
6
TABLE OF CONTENTS
ACKNOWLEDGEMENT ... 3 TABLE OF CONTENTS ... 6 LIST OF FIGURES ... 10 LIST OF TABLES ... 16 LIST OF SCHEMES ... 17 LIST OF ABBREVIATIONS ... 18 General Introduction ... 20 CHAPTER I ... 24INTRODUCTION TO TRANSITION METAL NANOPARTICLES ... 24
1.1 Transition Metal Nanoparticles: General Properties and Applications ... 26
1.2 Mechanism of Nanoparticle Formation ... 28
1.2.1 “Magic Number” Clusters and Morphology of Metal Nanoparticles ... 31
1.3 Stabilization of Metal Nanoparticles ... 33
1.4 Synthesis of Metal Nanoparticles ... 35
1.4.1 Organometallic Approach for the Synthesis of Nanoparticles ... 35
1.4.1.1 Organometallic Complexes as Precursors of Nanoparticles9,50,63 ... 37
1.5 Metal Nanoparticles in Catalysis ... 41
1.5.1 Catalytic Hydrogenation of Amides ... 43
1.5.1.1 Homogeneous Catalysts Used in Hydrogenation of Amides ... 44
1.5.1.2 Heterogeneous Catalysts Used in Hydrogenation of Amides ... 46
1.6 Rhenium ... 48
1.6.1 General Aspects ... 48
1.6.2 Applications ... 49
1.6.3 Chemistry of Rhenium Compounds ... 49
1.7 Concluding Remarks ... 52
CHAPTER II ... 54
RUTHENIUM-RHENIUM BIMETALLIC NANOPARTICLES FROM [Re2(CO)10] ORGANOMETALLIC PRECURSOR ... 54
2.2 General Information about the Precursors and Miscibility of Ru and Re
Metals ... 59
2.2.1 Characteristics of [Ru(COD)(COT)] and [Re2(CO)10] Organometallic Complexes ... 59
2.2.2 Miscibility of Ru and Re Metals ... 64
2.3 Synthesis of RuRe Bimetallic Nanoparticles: Optimization of Reaction Conditions ... 64
2.4 PVP-Stabilized RuRe Bimetallic Nanoparticles: Synthesis and Characterization ... 71
2.4.1 Control Experiments ... 72
2.4.1.1 Control Experiments with [Re2(CO)10]... 72
2.4.1.2 Control Experiments with [Ru(COD)(COT)] ... 76
2.4.1.3 Concluding Remarks ... 80
2.4.2 Characterization of RuRe/PVP NPs by HRTEM and EDX ... 80
2.4.3 Characterization of RuRe/PVP NPs by WAXS and EXAFS ... 83
2.5 HDA-Stabilized RuRe Bimetallic Nanoparticles: Synthesis and Characterization ... 86
2.6 Preliminary Catalytic Activities of Bimetallic RuRe NPs in Hydrogenation of N-Methylpyrrolidone ... 101
2.7 General Conclusion of Chapter II ... 103
CHAPTER III ... 106
PURE RHENIUM NANOPARTICLES FROM [Re2(C3H5)4] ORGANOMETALLIC PRECURSOR: SYNTHESIS, CHARACTERIZATION AND SURFACE STUDIES ... 106
3.1 Introduction ... 108
3.2 Synthesis and Characterization of Pure Rhenium Nanoparticles ... 111
3.2.1 Characterization by TEM, HRTEM and STEM-HAADF ... 113
3.2.2 Characterization by WAXS ... 115
3.2.3 FT-IR Analysis ... 117
3.2.4 Thermogravimetric Analysis ... 119
3.3 Influence of Reaction Parameters ... 121
3.3.1 Temperature ... 121
3.3.2 [Stabilizer]/[Metal] Ratio ... 123
3.3.3 Reaction Time ... 125
3.4 Surface Reactivity Studies ... 126
8
3.4.2 CO Adsorption ... 127
3.4.3 Oxidation ... 139
3.5 General Conclusion of Chapter III ... 144
CHAPTER IV ... 146
Re-BASED BIMETALLIC NANOPARTICLES FROM [Re2(C3H5)4] PRECURSOR ... 146
4.1 Introduction ... 148
4.2 Bimetallic Ruthenium-Rhenium Nanoparticles ... 149
4.2.1 PVP-Stabilized Bimetallic Ruthenium-Rhenium Nanoparticles ... 152
4.2.1.1 Alloy Type PVP-Stabilized Bimetallic Ruthenium-Rhenium Nanoparticles ... 152
4.2.1.2 Core-Shell Type PVP-Stabilized Bimetallic Ruthenium-Rhenium Nanoparticles ………158
4.2.1.3 Surface Investigation of RuRe/PVP NPs ... 169
4.2.2 HDA-Stabilized Ruthenium-Rhenium Nanoparticles ... 180
4.2.2.1 Alloy Type HDA-Stabilized Bimetallic Ruthenium-Rhenium Nanoparticles ... 180
4.2.2.2 Core-Shell Type HDA-Stabilized Bimetallic Ruthenium-Rhenium Nanoparticles ………185
4.2.3 Concluding Remarks on Ruthenium-Rhenium Nanoparticles ... 188
4.3 Bimetallic Platinum-Rhenium Nanoparticles ... 190
4.3.1 PVP-Stabilized Bimetallic Platinum-Rhenium Nanoparticles ... 191
4.3.1.1 Synthesis of PVP-Stabilized Platinum-Rhenium Nanoparticles from [Pt(CH3)2(COD)] and [Re2(C3H5)4] Organometallic Complexes ... 191
4.3.1.2 Synthesis of PVP-Stabilized Platinum-Rhenium Nanoparticles from [Pt(C7H10)3] and [Re2(C3H5)4] Organometallic Complexes ... 199
4.3.2 HDA-Stabilized Bimetallic Platinum-Rhenium Nanoparticles ... 204
4.3.3 Concluding Remarks on Platinum-Rhenium Nanoparticles ... 211
4.4 General Conclusion of Chapter IV ... 212
CHAPTER V ... 216
GENERAL CONCLUSION ... 216
CHAPTER VI ... 224
EXPERIMENTAL PART ... 224
6.1 Generals and Materials ... 226
6.2 Characterization Techniques ... 227
6.2.1 Transmission Electron Microscopy Analysis ... 227
6.2.3 Extended X-ray Absorption Fine Structure Measurements ... 227
6.2.4 Fourier Transform or Attenuated Total Reflectance Infrared Analysis 228 6.2.5 Elemental Analysis ... 228
6.2.6 Nuclear Magnetic Resonance Experiments ... 228
6.2.7 Mass Spectometry Analysis ... 228
6.2.8 Gas Chromatography Experiments ... 229
6.2.9 Thermogravimetric analysis ... 229
6.3 Synthesis Procedures ... 229
6.3.1 Synthesis of C3H5MgCl Grignard Reagent in Diethylether... 229
6.3.2 Synthesis of [Re2(C3H5)4] Organometallic Complex... 230
6.3.3 Synthesis of Ruthenium-Rhenium Bimetallic Nanoparticles from [Re2(CO)10] Precursor ... 233
6.3.4 General Synthesis of Pure Rhenium Nanoparticles from [Re2(C3H5)4] Precursor ... 234
6.3.5 Synthesis of Rhenium-Based Bimetallic Nanoparticles from [Re2(C3H5)4] Precursor ... 236
6.3.5.1 Alloy Type Re-Based Bimetallic Nanoparticles... 236
6.3.5.2 Core-Shell Type Re-Based Bimetallic Nanoparticles ... 237
6.4 Surface Reactivity Studies and Catalysis ... 238
6.4.1 Quantification of surface hydrides ... 238
6.4.2 Surface reactivity studies with CO, H2 and O2 ... 239
6.4.3 Hydrogenation of N-Methylpyrrolidone ... 239
RESUME DE LA THESE ... 242
NANOPARTICULES MONO- ET BI- MÉTALLIQUES À BASE DE RHÉNIUM: SYNTHÈSE, CARACTÉRISATION ET APPLICATION EN CATALYSE ... 242
APPENDIX ... 266
A1. Phase Diagrams ... 266
A2. Lattice Parameters ... 267
10
LIST OF FIGURES
Figure 1.1 Formation of discrete electronic energy levels on the way from metal bulk to molecule.17 .... 27 Figure 1.2 The LaMer mechanism of nucleation of sulfur. The (theoretical) curve shows sulfur concentration as a function of time.28 ... 29 Figure 1.3 Formation of nanostructured metal colloids by the ‘‘salt reduction” method.32 ... 30 Figure 1.4 Schematic representation of (A) cuboctahedral and (B) Icosahedral Mackay magic clusters.33 (n) and N represent number of shells and total number of atoms, respectively. ... 33 Figure 1.5 Schematic representation of (a) electrostatically (b-d) sterically, and (e) electrosterically stabilized metal nanoparticles. Two possible polymeric stabilization modes are shown with individual (c) or multiple (d) polymer chains.4 ... 34 Figure 1.6 Generic potential energy diagram showing the effect of a catalyst in a hypothetical exothermic chemical reaction.32 ... 42 Figure 1.7 Reactions of [Re2(CO)10].127 ... 51 Figure 2.1 1H-NMR of [Ru(COD)(COT)] in C
6D12. ... 61 Figure 2.2 3D ball representation of [Re2CO10].186 ... 61 Figure 2.3 13C-NMR of [Re
2CO10] in d8-THF. ... 62 Figure 2.4 ATR-IR of [Re2(CO)10] in solid state. The inset is the zoom of carbonyl region shown by the red frame. 63
Figure 2.5 FT-IR of [Re2(CO)10] in pentane. ... 63 Figure 2.6 a-b) TEM Images from the crude supernatant of reaction mixture obtained at 60oC in THF. . 64 Figure 2.7 13C-NMR of solid, obtained after evaporation of solvent from crude supernatant, in d4-methanol (CD3OD). ... 65 Figure 2.8 ATR-IR of PVP and solid, obtained after evaporation of solvent from the crude supernatant, before and after purification. ... 66 Figure 2.9 a-c) TEM Images of crude reaction mixture obtained at 120oC in anisole for 2 days; Image b) is a zoom of the area in the red rectangle on image a); the inset of image c is the size histogram built for individual small nanoparticles. ... 67 Figure 2.10 ATR-IR of dark brown solid before and after purification. The inset is the zoom of the carbonyl region shown in green rectangle. ... 68 Figure 2.11 a-c) TEM Images of crude reaction mixture obtained at 150oC in anisole for 2 days. The inset of image c is the size histogram built from measurement of individual nanoparticles. ... 69 Figure 2.12 ATR-IR of the obtained solid before and after purification. The inset is the zoom of the carbonyl region shown in green rectangle. ... 70 Figure 2.13 MS analysis of gas phase after the synthesis of RuRe/PVP NPs. ... 71 Figure 2.14 TEM Images of the reaction mixture after treatment of [Re2(CO)10] with H2 at 150oC in anisole and in the presence of PVP. ... 73 Figure 2.15 RDFs of [Re2(CO)10] (black) and white solid (red) obtained from the reaction of [Re2(CO)10] with H2 at 150oC in anisole. (* and # indicate Re-Re and Re-C bond distances respectively) . 74 Figure 2.16 From top to bottom : ATR-IR Spectra of white and yellow solids, obtained from the reaction of [Re2(CO)10] with 3 bar of H2 at 150oC in anisole, and commercially supplied [Re2(CO)10] in solid state………. ... 76
Figure 2.17 TEM Images of a) Ru/PVP NPs prepared at r.t. in anisole for 2 days and
b) metal-containing agglomerate. The inset is the size histogram of image a. ... 77
Figure 2.18 a) TEM and b) HRTEM Images of Ru/PVP NPs (4 wt.% Ru) prepared at 150oC in anisole for 2 days. The inset is the size histogram built from image a. ... 78
Figure 2.19 HRTEM Image of Ru/PVP NPs (4 wt.% Ru) prepared at 150oC in anisole for 2 days. The inset is fourier transform of highly crystalline nanoparticle shown in red rectangle. ... 79
Figure 2.20 a-d) TEM of Ru/PVP NPs (10 wt.% Ru) prepared at 150oC in anisole for 2 days at different magnifications… ... 79
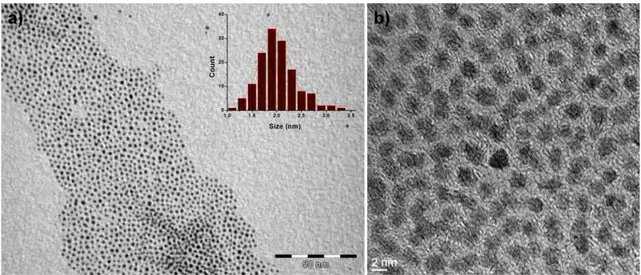
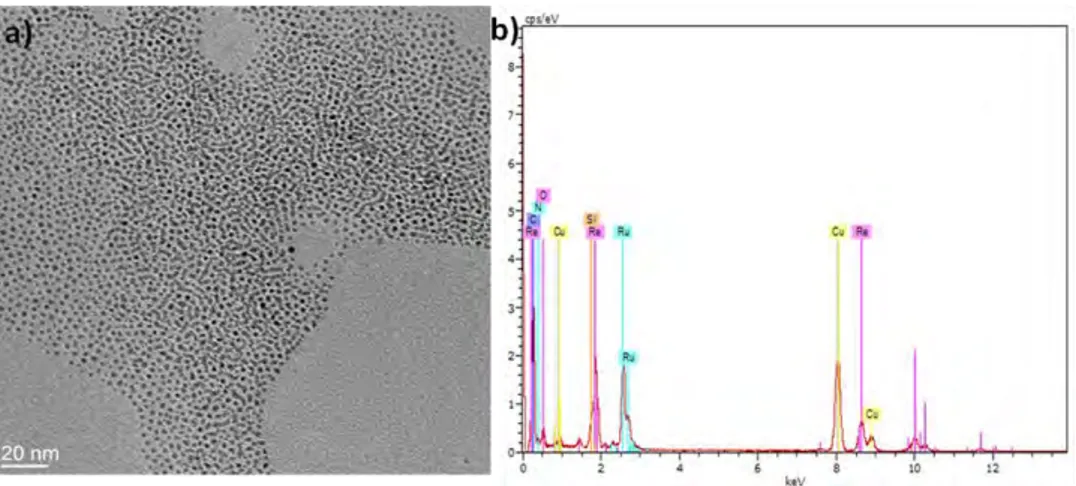
Figure 2.21 HRTEM Images of RuRe/PVP NPs, obtained from [Ru(COD)(COT)] and [Re2(CO)10] at 150oC in anisole in the presence of PVP, at different magnifications. ... 81
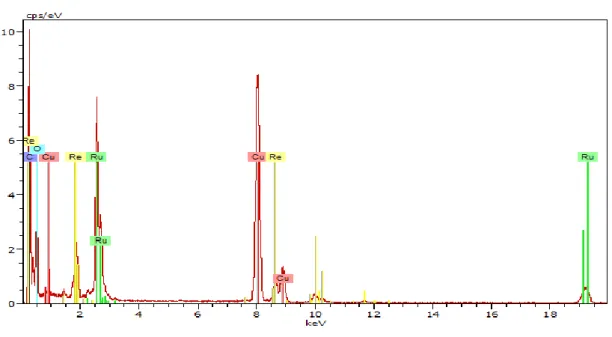
Figure 2.22 EDX Analysis of RuRe/PVP NPs prepared at 150 oC in anisole for 2 days. ... 82
Figure 2.23 Quantification of metal contents within the RuRe/PVP NPs by EDX. ... 82
Figure 2.24 RDF of RuRe/PVP NPs. ... 83
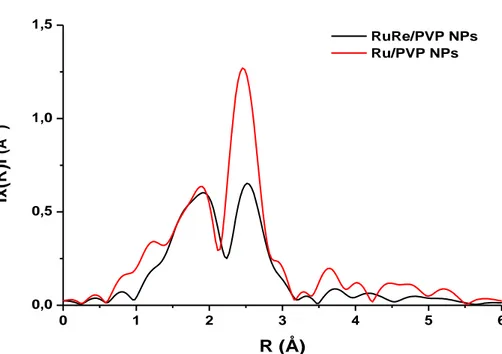
Figure 2.25 Fourier Transform at Ru K absorption edge of RuRe/PVP NPs (black) and pure Ru/PVP NPs (red)……… ... …….84
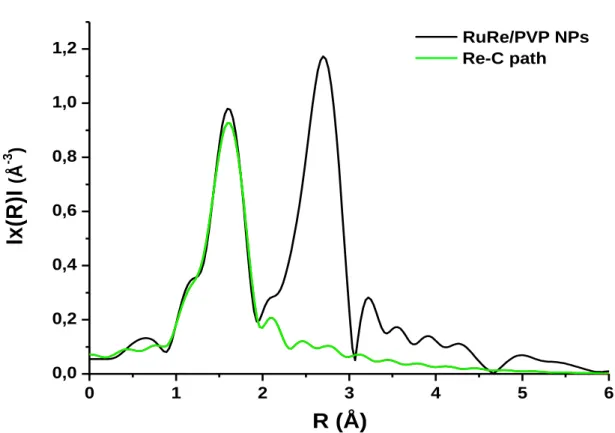
Figure 2.26 Fourier Transform at Re LIII absorption edge of RuRe/PVP NPs (black) and fit of Re-C path (green)………… ... 85
Figure 2.27 ATR-IR spectra of pure HDA (blue) and purified RuRe/HDA-1 NPs (red). ... 87
Figure 2.28 TEM images of the crude colloidal solution of RuRe/HDA-1 NPs... 88
Figure 2.29 a) TEM and b) HRTEM images of RuRe/HDA-1 NPs after washing with pentane. ... 89
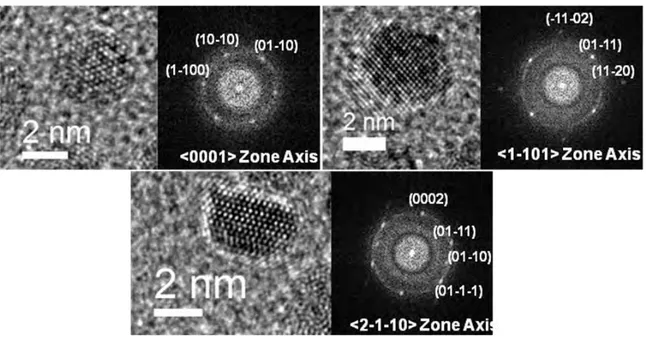
Figure 2.30 a) HRTEM image of RuRe/HDA-1 NPs after pentane washing; b) Fast Fourier Transform (FFT) of the nanoparticle shown in the rectangle at the top and c) zoom of another nanoparticle shown in green rectangle where “d” is lattice spacing of RuRe/HDA-1 NPs. The inset of image a is the zoom of nanoparticle shown in the rectangle at the top. ... 90
Figure 2.31 a) HRTEM image of RuRe/HDA-1 NPs after pentane washing and b) corresponding EDX analysis…………. ... 90
Figure 2.32 a-b) STEM-HAADF images of RuRe/HDA-1 NPs. ... 91
Figure 2.33 a-c) TEM images of RuRe/HDA-2 NPs after pentane washing; d) size histogram obtained from image c…………. ... 92
Figure 2.34 HRTEM and corresponding FFT images of purified RuRe/HDA-2 NPs. ... 93
Figure 2.35 STEM-HAADF images of washed RuRe/HDA-2 NPs. ... 94
Figure 2.36 a) HRTEM Image of RuRe/HDA-2 NPs; b) Corresponding EDX Spectra of regions indicated in image a. ... 95
Figure 2.37 a) STEM Image of RuRe/HDA-2 NPs; b) Corresponding EDX Spectra of dots indicated in image a……….. ... 95
Figure 2.38 a) STEM image of RuRe/HDA-2 NPs and b) zoom of the region shown in green rectangle; c-e) corresponding elemental mapping of Ru-Re, Ru and Re elements respectively. ... 96
Figure 2.39 Quantification of metal contents within the nanoparticles by EDX. ... 97
Figure 2.40 RDF of RuRe/HDA-1 (black) and RuRe/HDA-2 (red) NPs ... 98
Figure 2.41 Fourier Transform at Ru K absorption edge of RuRe/HDA-1 NPs (blue), RuRe/HDA-2 NPs (green) and pure Ru/PVP NPs (red). ... 99
Figure 2.42 Fourier Transform at Ru K absorption edge of RuRe/HDA-2 NPs (black) and a fit of Ru-Ru path (green). ... 99
Figure 2.43 Fourier Transform at Re LIII absorption edge of RuRe/HDA-1 NPs (blue), RuRe/HDA-2 NPs (red)……… ... 100
12
Figure 2.44 Fourier Transform at Re LIII absorption edge of RuRe/HDA-1 NPs (black) and simulations
of Re-C (blue), Re-Re (red) and Ru-Re (green) paths. ... 100
Figure 3.1 Structure of [Re2(C3H5)4]complex. ………..………110
Figure 3.2 Decomposition of [Re2(C3H5)4] under 3 bar of H2 at 60 oC after 7 h in petroleum. ... 111
Figure 3.3 Color change of the reaction solution during the decomposition of [Re2(C3H5)4] in the presence of PVP giving rise to a dark brown colloidal solution containing Re/PVP NPs after 2 days. ... 112
Figure 3.4 TEM Images and corresponding size histograms of purified a) Re/HDA and b) Re/PVP NPs prepared at 120 oC for 2 days in the presence of 1 molar eq. of HDA and 10 wt. % Re respectively. ... 113
Figure 3.5 HRTEM images of Re/PVP NPs, prepared at 120 oC for 2 days in the presence of 10 wt. % Re, at two different magnifications... 114
Figure 3.6 STEM-HAADF Images of a-b) purified Re/HDA and c-d) purified Re/PVP NPs, prepared at 120 oC for 2 days in the presence of 1 molar eq. of HDA and 10 wt. % Re respectively, at different magnifications…….. ... 115
Figure 3.7 Comparison of low-angle part diffractogram of Re/HDA NPs prepared at 120 oC for 2 days in the presence of 1 molar eq. of HDA with the model pattern computed for hcp Re. ... 116
Figure 3.8 RDFs of Re NPs (from top to bottom: Re/HDA NPs, hcp simulation for comparison, Re/PVP NPs) obtained by WAXS analysis. ... 117
Figure 3.9 Top: FT-IR Spectra of free PVP (red) and Re/ PVP NPs (black), Bottom: FT-IR spectra of free HDA (red) and Re/HDA NPs (black). ... 118
Figure 3.10 TGA results of a) HDA and b) PVP ... 119
Figure 3.11 TGA results of Re/HDA NPs ... 120
Figure 3.12 TGA results of Re/PVP NPs. ... 121
Figure 3.13 a-b) TEM and HAADF-STEM images of purified Re/HDA NPs prepared at 100 oC in 3 days with 1 molar equiv. of HDA; c-d) TEM and HAADF-STEM images of purified Re/PVP NPs prepared at 100oC in 3 days with 10 wt.% Re content. The insets are size histograms corresponding to TEM images………… ... 122
Figure 3.14 Comparison of WAXS RDFs of a) Re/HDA and b) Re/PVP NPs prepared at 120 oC and 100 oC………….. ... 123
Figure 3.15 a) TEM Image of Re/HDA NPs prepared at 120 oC in 2 days with 0.5 molar equiv. of HDA; b) TEM Image of Re/PVP NPs prepared at 120 oC in 2 days with 5 wt.% Re content. The insets are corresponding size histograms of the TEM images. ... 124
Figure 3.16 a) TEM image of Re/HDA NPs prepared at 120 oC in 4 days with 1 molar equiv. of HDA; b) TEM image of Re/PVP NPs prepared at 120 oC in 4 days with 10 wt.% Re content. The insets are corresponding size histogram of the TEM images... 125
Figure 3.17 FT-IR spectra of a) Re/HDA NPs exposed to 3 bar 12CO at r.t as a function of reaction time. The inset is the zoom to carbonyl region shown by blue frame... 128
Figure 3.18 FT-IR spectra of Re/PVP NPs exposed to 3 bar 12CO at r.t as a function of reaction time. The inset is the zoom to carbonyl region shown by green frame. ... 129
Figure 3.19 FT-IR spectra of Re/PVP NPs exposed to 3 bar 12CO at 90 oC as a function of reaction time, a) Whole spectrum b) Zoom of carbonyl stretching region. ... 130
Figure 3.20 FT-IR spectra of Re/HDA NPs exposed to 3 bar 12CO at 90 oC as a function of reaction time, a) Whole spectrum b) Zoom of carbonyl stretching region. ... 132
Figure 3.21 Zoom of the oxide stretching region of FT-IR Spectra of a) Re/HDA and b) Re/PVP NPs exposed to 3 bar 12CO at 90oC as a function of reaction time. ... 133
Figure 3.22 FT-IR Spectra of Re/12CO/HDA NPs exposed to 3 bar H 2 as a function of reaction time and temperature………… ... 135
Figure 3.23 13C-MAS NMR spectra of Re/PVP NPs exposed to 3 bar 13CO at 90 oC during: a) 0 day, b) 2 days, and c) 5 days reaction time. ... 136 Figure 3.24 13C-CPMAS NMR spectra of Re/PVP NPs exposed to 3 bar 13CO at 90 oC during: a) 0 day, b) 2 days, and c) 5 days reaction time, * Spinning side band. ... 136 Figure 3.25 13C-MAS NMR spectra of Re/HDA NPs exposed to 3 bar 13CO at 90 oC during: a) 0 day, b) 2 days, and c) 5 days reaction time. ... 138 Figure 3.26 13C-CPMAS NMR spectra of Re/HDA NPs exposed to 3 bar 13CO at 90 oC during: a) 0 day, b) 2 days, and c) 5 days reaction time. ... 139 Figure 3.27 a) FT-IR spectra of oxidized Re/HDA NPs compared to Re/HDA as prepared (120 oC in 2 days with 1 molar equiv. of HDA) and b) FT-IR Spectra of oxidized Re/PVP NPs compared to Re/PVP as prepared (120 oC in 2 days with 10 wt.% Re content). ... 140 Figure 3.28 a) and c) TEM images, b) and d) corresponding size histograms of oxidized Re/HDA NPs and Re/PVP NPs respectively... 141 Figure 3.29 WAXS Analysis of oxidized a) Re/HDA NPs and b) Re/PVP NPs respectively and their comparison with pure Re NPs. ... 142 Figure 3.30 FT-IR spectra of Re/12CO/PVP NPs exposed to 3 bar O
2 as a function of reaction time and temperature………….. ... 143 Figure 4.1 1H-NMR of [Ru(Me-Allyl)
2(COD)] in C6D12. ... 150 Figure 4.2 TEM images of alloy type RuRe/PVP NPs at two different magnifications. The inset is the size histogram built from image b. ... 153 Figure 4.3 HRTEM Images of alloy type purified RuRe/PVP NPs at different magnifications. On image b) well crystallized nanoparticles are visible. ... 154 Figure 4.4 a) HRTEM image of a crystalline alloy type RuRe/PVP NP b) FFT of this nanoparticle. .... 155 Figure 4.5 STEM-HAADF Images of purified alloy type RuRe/PVP NPs. The inset of image b is the zoom of NP shown with red frame. ... 156 Figure 4.6 a) STEM-HAADF image and b) intensity profile extracted from the particle center of an alloy type RuRe/PVP NPs. ... 156 Figure 4.7 STEM images of alloy type RuRe/PVP NPs (left) and EDX analyses (right) of individual nanoparticles highlighted with red frame. ... 157 Figure 4.8 RDF of alloy type RuRe/PVP NPs obtained by WAXS. ... 158 Figure 4.9 1H-NMR Study of the decomposition of a [Ru(COD)(COT)] and [Re2(C3H5)4] mixture under 3 bar H2 in the presence of PVP (stabilizer) and d8-THF (solvent) inside an air-tight high pressure NMR tube. # Pressurizing the tube with 3 bar H2. * Peak of dissolved H2. ŧ Increasing the temperature to 60oC. 160 Figure 4.10 1H-NMR spectra recorded from aliquots of the reaction mixture during the synthesis of core-shell type RuRe/PVP NPs. ... 162 Figure 4.11 a-b) TEM images of core-shell type RuRe/PVP NPs at two different magnifications, c) Size histogram built from individual nanoparticles of image b. ... 164 Figure 4.12 HRTEM Images of core-shell type purified RuRe/PVP NPs at different magnifications. In image b) well-crystallized nanoparticles are visible. ... 165 Figure 4.13 a) HRTEM image of a crystalline core-shell type RuRe/PVP NP b) Fast Fourier Transform (FFT) of this nanoparticle. ... 165 Figure 4.14 STEM-HAADF Images of purified core-shell type RuRe/PVP NPs at different magnifications……… ... 166 Figure 4.15 STEM images of core-shell type RuRe/PVP NPs (left) and EDX analyses (right) of individual nanoparticles highlighted with red frame. ... 167 Figure 4.16 RDF of core-shell type RuRe/PVP NPs obtained by WAXS. ... 168
14
Figure 4.17 Comparison of RDFs of core-shell and alloy type type RuRe/PVP NPs obtained by WAXS……… ... 168 Figure 4.18 FT-IR spectra recorded for alloy type RuRe/PVP NPs after treatment with 3 bar 12CO as a function of temperature and reaction time. The inset is a zoom of the same FT-IR spectra in the range of 870-920 cm-1………….. ... 171 Figure 4.19 13C-MAS NMR spectra recorded for alloy type RuRe/PVP NPs: a) crude NPs as a reference, b) 3h, c) 96h under 3 bar 13CO at r.t. and d) 48h under 3 bar 13CO at 90oC. * Spinning side band……… ... 172 Figure 4.20 13C-CPMAS NMR spectra recorded for alloy type RuRe/PVP NPs: a) crude NPs as a reference, b) 3h, c) 96h under 3 bar 13CO at r.t. and d) 48h under 3 bar 13CO at 90oC. * Spinning side band……… ... 173 Figure 4.21 FT-IR spectra recorded for core-shell type RuRe/PVP NPs exposed to 3 bar 12CO as a function of temperature and reaction time. ... 174 Figure 4.22 13C-MAS NMR spectra recorded for core-shell type RuRe/PVP NPs: a) crude NPs as a reference, b) 3h, c) 96h under 3 bar 13CO at r.t. and d) 48h under 3 bar 13CO at 90oC. * Spinning side band………. ... 176 Figure 4.23 13C-CPMAS NMR spectra recorded for core-shell type RuRe/PVP NPs: a) crude NPs as a reference, b) 3h, c) 96h under 3 bar 13CO at r.t. and d) 48h under 3 bar 13CO at 90oC. * Spinning side band……… ... 176 Figure 4.24 TEM Images of oxidized a-b) alloy type RuRe/PVP NPs and c-d) core-shell type RuRe/PVP NPs.. ... 177 Figure 4.25 a) Low-angle part diffractograms; b) RDFs of alloy type RuRe/PVP NPs before (red) and after (green) oxidation. ... 178 Figure 4.26 a) Low-angle part diffractograms; b) RDFs of core-shell type RuRe/PVP NPs before (red) and after (green) oxidation... 179 Figure 4.27 a-b) TEM Images of RuRe/HDA NPs from crude solution, c) size histogram of spherical nanoparticles built from image b. ... 182 Figure 4.28 HRTEM images of purified RuRe/HDA NPs at different magnifications. ... 183 Figure 4.29 HRTEM image of purified RuRe/HDA NPs; b) zoom of the crystalline nanoparticle shown by white frame c) FFT of crystalline nanoparticle. ... 184 Figure 4.30 Quantification of metal contents within the RuRe/HDA NPs by EDX. ... 184 Figure 4.31 STEM Image of alloy-type RuRe/HDA NPs and EDX Spectra obtained for individual nanoparticles indicated in red color. ... 185 Figure 4.32 1H-NMR Spectrum recorded from the crude solid, obtained after evaporating THF from the reaction of [Ru(COD)(COT)] and [Re2(C3H5)4] under 3 bar H2 in the presence of HDA, after dissolving in C6D12. * Proton peaks coming from [Re2(C3H5)4]. ... 186 Figure 4.33 TEM images from a-b) crude reaction mixture and c-d) purified solid after dissolving in toluene. The inset is the size histogram built from purified NPs. ... 187 Figure 4.34 a-b) HRTEM images of purified PtRe/PVP NPs synthesized from [Pt(CH3)2(COD)] and [Re2(C3H5)4] complexes, c) corresponding size histogram built from individual NPs. ... 193 Figure 4.35 HRTEM images of purified PtRe/PVP NPs synthesized from [Pt(CH3)2(COD)] and [Re2(C3H5)4] complexes. ... 194 Figure 4.36 STEM-HAADF images of purified PtRe/PVP NPs, synthesized from [Pt(CH3)2(COD)] and [Re2(C3H5)4] complexes, at different magnifications. ... 195 Figure 4.37 HRTEM (top left) and STEM-HAADF images (middle and bottom left) of purified PtRe/PVP NPs and corresponding FFT images (right). ... 196 Figure 4.38 Top: STEM image of purified PtRe/PVP NPs synthesized from [Pt(CH3)2(COD)] and [Re2(C3H5)4] complexes, Bottom: EDX analyses of the zone highlighted by the green rectangle. ... 197
Figure 4.39 Left: STEM/HAADF images of purified PtRe/PVP NPs synthesized from [Pt(CH3)2(COD)] and [Re2(C3H5)4] complexes, Right: Corresponding EDX analyses of individual nanoparticles highlighted in the red frames………… ... 197 Figure 4.40 RDF of PtRe/PVP NPs synthesized from [Pt(CH3)2(COD)] and [Re2(C3H5)4] complexes………. ... 198 Figure 4.41 Comparison of low-angle part diffractogram of PtRe/PVP NPs, synthesized from [Pt(CH3)2(COD)] and [Re2(C3H5)4] complexes, with the model patterns computed for fcc Pt (pink), Pt60Re40 (blue)……….. ... 198 Figure 4.42 a-b) TEM images of purified PtRe/PVP NPs synthesized from [Pt(C7H10)3], and [Re2(C3H5)4] complexes, c) Corresponding size histogram built from individual nanoparticles. ... 200 Figure 4.43 a-b) HRTEM Images of purified PtRe/PVP NPs synthesized from [Pt(C7H10)3], and [Re2(C3H5)4] complexes. c) Zoom of the region highlighted in red rectangle and corresponding FFT of the image……… ... 201 Figure 4.44 Left: STEM images of purified PtRe/PVP NPs synthesized from [Pt(C7H10)3], and [Re2(C3H5)4] complexes, Right: EDX analyses of rectangular area shown on the images. The insets are the elemental analysis obtained from the NPs. ... 202 Figure 4.45 Left: STEM/HAADF images of purified PtRe/PVP NPs synthesized from [Pt(C7H10)3], and [Re2(C3H5)4] complexes, Right: Corresponding EDX analyses of individual nanoparticles highlighted with a red rectangle…………. ... 202 Figure 4.46 Comparison of RDFs of PtRe/PVP NPs and Re/PVP NPs obtained by WAXS. ... 203 Figure 4.47 a-b) TEM images obtained from the crude colloidal solution of PtRe/HDA NPs at two different magnifications, c) Corresponding size histogram built from individual nanoparticles. ... 205 Figure 4.48 a-c) TEM images obtained from the crude colloidal solution of PtRe/HDA NPs afer 3 days under Ar atmosphere, d) Corresponding size histogram built from individual nanoparticles. ... 206 Figure 4.49 a-b) TEM images obtained from toluene solution of purified PtRe/HDA NPs, c) Corresponding size histogram built from individual nanoparticles. ... 207 Figure 4.50 HRTEM images of purified PtRe/HDA NPs at different magnifications... 208 Figure 4.51 HRTEM image of a purified PtRe/HDA NP (left) and corresponding FFT image (right).208 Figure 4.52 RDF of purified PtRe/HDA NPs obtained by WAXS. ... 209 Figure 4.53 EDX analysis of purified PtRe/HDA NPs (top) and quantification of metal contents within PtRe/HDA NPs (bottom). ... 210 Figure 4.54 a) STEM image of PtRe/HDA NPs; b-d) corresponding elemental mapping of Pt (red), Pt-Re and Pt-Re (green) elements respectively. ... 211 Figure 6.1 Experimental installation for the synthesis of C3H5MgCl. ... 230 Figure 6.2 Purification of [Re2(C3H5)4] complex from pentane extract. ... 231 Figure 6.3 a) 1H-NMR (400 MHz, Bruker) recorded by dissolving [Re
2(C3H5)4] complex in C6D6 and
b) Mass Spectra of [Re2(C3H5)4] (MW = 536 g/mol). ... 232 Figure A1. Binary phase diagram of Ru-Re294 ... 266 Figure A2. Binary phase diagram of Pt-Re295,296 ... 266
16
LIST OF TABLES
Table 1.1 Transition metal carbonyl complexes.a,63 ... 38
Table 2.1 Comparison of experimental and literature spectroscopic data of [H3Re3(CO)12]. ... 75
Table 2.2 Preliminary catalysis results obtained with RuRe NPs in the hydrogenation of N-Methylpyrrolidinone. ... 102
Table 3.1 Rhenium nanoparticle systems reported in the literature. ... 109
Table 3.2 Quantification of surface hydrides on Re NPs ... 127
Table 3.3 Summary of the characteristics of Re NPs prepared in different reaction conditions. ... 145
Table 4.1 Summary of the main characteristics of Re-based bimetallic NPs prepared in different reaction conditions.*#... ... 213
LIST OF SCHEMES
Scheme 1.1 LaMer’s Mechanism consisting of nucleation followed by diffusive, agglomerative Growth
(S : Sulfur).26…….. ... 28
Scheme 1.2 Schematic representation of the synthesis of metal nanoparticles from an organometallic precursor…………. ... 37
Scheme 1.3 Challenge levels in catalytic hydrogenation.104 ... 43
Scheme 1.4 Possible evolution pathways during the hydrogenation of amides.105 ... 44
Scheme 2.1 Procedures to synthesize ruthenium(0) cyclo-olefin complexes. (i) EtOH or THF, 20oC; (ii) EtOH or THF, reflux.173 ... 59
Scheme 2.2 Reactions of [Ru(COD)(COT)] with various phosphines and diphosphines under dihydrogen.174………… ... 60
Scheme 2.3 Organometallic synthesis of RuRe/PVP NPs from [Ru(COD)(COT)] and [Re2(CO)10]. .... 71
Scheme 2.4 Rhenium carbonyl hydride complexes resulting from the reaction of [Re2(CO)10] and H2. 74 Scheme 2.5 Ligand Exchange when reacting [Ru(COD)(COT)] under 3 bar of H2 in anisole at r.t. ... 78
Scheme 2.6 Organometallic one-pot synthesis of RuRe/HDA NPs from [Ru(COD)(COT)] and [Re2(CO)10]………….. ... 86
Scheme 2.7 Organometallic two-step synthesis of RuRe/HDA NPs from [Ru(COD)(COT)] and [Re2(CO)10]………….. ... 92
Scheme 2.8 Catalytic hydrogenation of N-Methylpyrrolidone to N-Methylpyrrolidine. ... 102
Scheme 3.1 Synthesis of Re NPs stabilized either by PVP or HDA from [Re2(C3H5)4]. ... 112
Scheme 3.2 Reaction of hydrides present on the surface of Re NPs with 2-norbornene. ... 126
Scheme 4.1 Synthesis of alloy type PVP-stabilized RuRe NPs from [Ru(Me-Allyl)2(COD)] and [Re2(C3H5)4]……….. ... 152
Scheme 4.2 Synthesis of core-shell type PVP-stabilized RuRe NPs from [Ru(COD)(COT)] and [Re2(C3H5)4]…………. ... 163
Scheme 4.3 Synthesis of alloy type HDA-stabilized RuRe NPs from [Ru(Me-Allyl)2(COD)] and [Re2(C3H5)4]………… ... 181
Scheme 4.4 Synthesis of alloy type PtRe/PVP NPs from [Pt(CH3)2(COD)] and [Re2(C3H5)4] complexes………….. ... 192
18
LIST OF ABBREVIATIONS
THF: Tetrahydrofurane TMEDA: Tetramethylethylenediamine PVP: Polyvinylpyrrolidone HDA: Hexadecylamine dppb: Bis(diphenylphosphino)butane dppe: 1,2-bis(diphenylphosphino)ethane PPh3: triphenyl phosphinePCy3: tricyclohexyl phosphine COD: Cyclooctadiene
COT: Cyclooctatriene CO: Carbon monoxide nm: Nanometer r.t.: Room temperature Hz: Hertz
NPs: Nanoparticles
Re/HDA NPs: HDA-Stabilized Rhenium
Nanoparticles
Re/PVP NPs: PVP-Stabilized Rhenium
Nanoparticles
RuRe/HDA NPs: HDA-Stabilized
Bimetallic Ruthenium-Rhenium
Nanoparticles
RuRe/PVP NPs: PVP-Stabilized Bimetallic
Ruthenium-Rhenium Nanoparticles
PtRe/HDA NPs: HDA-Stabilized Bimetallic
Platinum-Rhenium Nanoparticles
PtRe/PVP NPs: PVP-Stabilized Bimetallic
Platinum-Rhenium Nanoparticles
TEM: Transmission Electron Microscopy HRTEM: High Resolution Transmission
Electron Microscopy
STEM: Scanning Transmission Electron
Microscopy
HAADF: High Angle Annular Dark Field FFT: Fast Fourier Transform
WAXS: Wide Angle X-Ray Scattering RDF: Radial Distribution Function
EXAFS: Extended X-ray Absorption Fine
Structure
FT-IR: Fourier Transform Infrared MS: Mass Spectroscopy
NMR: Nuclear Magnetic Resonance
CP-MAS: Cross Polarization - Magic Angle
Spinning
General Introduction
General Introduction
The interest for metallic nanostructures has experienced an exponential development during the past decades due to their unusual properties, given they are situated at the boundary between molecular species and bulk metals.1–4 Thus, they are
promising candidates for applications in different areas among which one can cite catalysis, magnetism, medicine, electronics or sensors.1,4 A good control over the
characteristics of nanostructures is essential since their physical and chemical properties depend strongly on their size, shape and surface state.3,5,6 Different synthesis methods
such as chemical reduction, thermolysis, photochemical decomposition, electroreduction, microwave and sonochemical irradiation have been attempted up to date by the scientific community all around the world in order to prepare well-defined nanostructures.4,7
Among them, the organometallic approach, a synthesis procedure that consists of removing the ligands from an organometallic complex in the mildest possible conditions and with the minimum of potentially pollutant reactants, has emerged as an efficient and powerful method.8–11 It allows the preparation of a large variety of nano-objects of diverse elements with a clean and controllable metal surface which is of interest to have good and tunable physical and chemical properties.
More specifically, this work describes the preparation of rhenium based mono- and bi-metallic nanoparticles by organometallic approach, their characterization including surface reactivity studies and their preliminary application in catalysis. Initially, our objective was to develop rhenium based bimetallic nanostructures in order to use them in the hydrogenation of difficult functional groups such as amides. Rhenium is known in the literature to induce a positive contribution in terms of catalytic activity and selectivity in the hydrogenation of difficult functional groups such as carboxylic acids and amides by reducing the binding energy of CO to the co-metal under mild reaction conditions.12
Therefore, there has been an increasing number of papers and citations on rhenium based bimetallic catalyst systems in the last 20 years.
While the first difficulty of this study was the lack of information on pure rhenium nanoparticles in the literature, the second one was to find an appropriate rhenium
organometallic precursor to act as an efficient rhenium source. In particular, the precursor has to be decomposed properly under conditions as mild as possible to obtain “naked” and well-defined nanostructures.
The first results were obtained with bimetallic nanoparticles formed by either co-decomposition or two-steps co-decomposition of [Ru(COD)(COT)] and [Re2(CO)10] in
anisole (150 oC; 3 bar H
2) in the presence of polyvinylpyrrolidone or hexadecylamine as
stabilizing agents. Although these nanoparticles showed a narrow size distribution and a good crystallinity, the content of rhenium in the nanoparticles remained limited since total decomposition of [Re2(CO)10] could not be achieved. More importantly, the unreacted
[Re2(CO)10] could not be separated from the nanoparticles by purification which resulted
in low catalytic activity in the hydrogenation of N-methylpyrrolidone.
Given the difficulties met using [Re2(CO)10] as rhenium source, another rhenium
precursor was envisaged, namely dirheniumtetraally(II), [Re2(C3H5)4]. This complex was
synthesized according to a slightly modified published procedure13 and evaluated to
synthesize first pure rhenium nanoparticles and then rhenium-based ruthenium and platinum bimetallic systems. This precursor totally decomposed in mild conditions and allowed us to produce monodisperse rhenium nanoparticles in a reproducible manner. The obtained nanoparticles were precisely characterized by using complementary analysis techniques such as WAXS, EXAFS, XPS, TEM, HRTEM, STEM-EDX, STEM-HAADF, NMR, FT-IR, EA and performing surface reactivity studies (norbornene hydrogenation, oxidation and CO adsorption reactions). A preliminary evaluation of their interest in catalysis was carried out namely in the hydrogenation reaction of amides.
This study was performed at the “Laboratoire de Chimie de Coordination du
CNRS” in Toulouse, France, in the team “Nanostructures et Chimie Organométallique”
and under the co-supervision of B. Chaudret and K. Philippot. It was realized in the framework of FP7-NMP2-Large Program Project (Synflow 2010-246461). The dissertation is composed of six chapters.
The first chapter gives general information on metallic nanoparticles. The properties of metal nanoparticles, their mechanism of formation and stabilization methods are presented as well as the synthesis protocols, particularly the organometallic approach, and potential organometallic complexes as precursors. Then, application of metal
General Introduction
nanoparticles in catalysis and the importance of catalytic hydrogenation of amides are discussed. Moreover, the homogeneous and heterogeneous catalysts used in hydrogenation of amides and the importance of rhenium in this domain are given in detail. In the last part, information on the properties of rhenium and its carbonyl and hydride complexes are presented.
In Chapter II, ruthenium-rhenium bimetallic nanoparticles synthesized from [Ru(COD)(COT)] and [Re2(CO)10] precursors in the presence of polyvinylpyrrolidone or
hexadecylamine as stabilizing agents, their characterization and preliminary results in the catalytic hydrogenation of N-methylpyrrolidone are described.
The synthesis of pure rhenium nanoparticles from [Re2(C3H5)4] organometallic
complex, the influence of reaction parameters on the morphology of the so-obtained nanoparticles and surface reactivity studies followed by FT-IR and MAS NMR are reported in Chapter III.
Chapter IV is dedicated to rhenium-based bimetallic nanoparticles (Ru, Pt) prepared by using [Re2(C3H5)4] as rhenium source. Different reaction conditions
depending on the organometallic complexes used as precursors resulted in modification of the morphology of nanoparticles, as evidenced by using a combination of complementary characterization techniques and surface reactivity studies.
General remarks, conclusions and perspectives of the present work are given in Chapter V.
CHAPTER I
INTRODUCTION TO TRANSITION
METAL NANOPARTICLES
CHAPTER I
Introduction to Transition Metal Nanoparticles
1.1 Transition Metal Nanoparticles: General Properties and
Applications
Over the two last decades, nanoscience and nanotechnology, which deal primarily with the synthesis, characterization, and exploration of nanostructured materials, have become a popular field of research.3,4,7,14 With a situation somewhere between the bulk
solid and molecular state, metal particles in the nanoscale regime show unique properties with a size ranging from 1 to 100 nm.3,5,6 Metal nanoparticles do not follow classical
physical laws as bulk materials do. They exhibit so-called ‘‘nano-effects’’ when reaching a critical size. For instance, the melting point of a solid element or a chemical compound in the classical sense is a constant under distinct conditions whereas this is not the case for nanoparticles. The melting point of bulk gold is known to be 1064 0C. However, gold nanoparticles below ca. 20 nm in diameter begin slowly to melt at lower temperatures and the melting point then dramatically falls down at a size of ca. 3–4 nm.16 This phenomenon can simply be explained as while the particles are getting smaller, the percentage of surface atoms becomes higher. Since these surface atoms are less coordinated than inner atoms, they are more easily mobilized with increasing temperatures which results in lower melting points.16,17
Reducing the size of a metal also affects its color drastically. For example, the color of bulk gold is yellow; but if gold is downsized to ca. 50 nm, the yellow color spontaneously disappears and turns to blue and further reduction leads to purple and finally bright red colors.17 This color change is a consequence of the appearance of
plasmon resonances. Plasmon resonances, quantitatively described by the Mie theory,18
are caused by the interaction of light with the confined electron gas in such small particles, resulting in a collective electron oscillation. The frequency of this oscillation depends on the metal, the size of the corresponding particles, their shape and the surrounding medium.
The unique material properties in the nanoscale size range come mainly from two sources:
i. Quantum size effect:17,19 The electronic situation in bulk metals is characterized by the existence of energy bands. The valence band contains the relevant valence
electrons that are in case of transition metals usually s- and d- electrons. The conduction band of metals overlaps to some extent with the valence band and so becomes partially occupied with electrons which are responsible for the electric conductivity of metals. In contrast with the electrons in a filled band, those in the conduction band are fully mobile and make conductivity possible. In semiconductors, valence and conduction bands are separated by a specific energy gap, which is too large in insulators. If a metal particle is continuously reduced in size, the overlap of valence band and conduction band is vanishing similar to a semiconductor. Further reduction will end up in a situation where the bands turn into more or less discrete energy levels. At this step, the metal bulk properties disappear to be substituted to that of a ‘‘quantum dot’’, following quantum mechanical rules. Such evolution can end up in the formation of a typical molecular situation as in molecules (Figure 1.1). Such confinement of charge carriers in a small space leading to discrete energy levels is called “quantum size effect” and results in change of the electronic properties of metals in nanoparticles.
Figure 1.1 Formation of discrete electronic energy levels on the way from metal bulk to molecule.17
ii. Surface/interface effect: The properties of surface or interface atoms become much more significant, as the surface to volume ratio increases with decreasing of particle size. Due to their high surface-to-volume ratio compared to bulk catalytic materials, transition metal nanoparticles display a higher number of potential active sites which makes them very attractive as catalysts. Moreover, with their
CHAPTER I
Introduction to Transition Metal Nanoparticles
different possible shapes, metal nanoparticles may present different crystallographic facets and fraction of surface atoms on their corners and edges, which makes them appealing for different catalytic applications, in particular for selectivity concerns.5,20
Due to their unique properties mentioned above, besides catalysis, metal nanoparticles have many potential uses7,21 such as in optoelectronics, conductors, sensors
or biomedicine area.4,22–24 Catalysis can be highlighted as it is the key for the development of starting chemicals, fine chemicals and drugs from raw materials. In the modern catalysis, nanocatalysis is recognized as a whole discipline since well-controlled nanoparticles can display ensemble of advantages from both heterogeneous and homogeneous catalysts.24
It should be noted that in the literature, nanomaterials are named in different manners such as nanocrystals, nanoparticles, nanoclusters and colloids.15 Although
different sources refer to different nanomaterial names, the term ‘nanoparticles’ will be used throughout this dissertation to denote any type of metallic species with a size between 1 and 100 nm in order to avoid semantic problems.
1.2 Mechanism of Nanoparticle Formation
Starting with LaMer25 who worked on the formation of sulfur sols, many valuable
scientists26 proposed a mechanism for the stepwise formation of nanoclusters. However,
most accepted mechanisms have been provided by LaMer, Turkevich and Finke.27,28
In 1950s, LaMer25,26 described the formation of sulfur sols from the
decomposition of sodium thiosulfate in hydrochloric acid. This widely cited mechanism (Scheme 1.1) assumes that homogeneous nucleation occurs until a nucleus of critical size is obtained.
Scheme 1.1 LaMer’s Mechanism consisting of nucleation followed by diffusive, agglomerative Growth (S : Sulfur).26
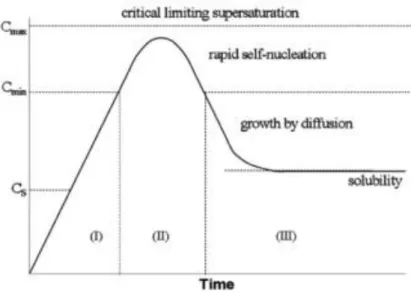
In accordance with statistical mechanics cited by LaMer, the energy barrier to nucleation can only be surmounted in supersaturated solutions (Figure 1.2). At this point, “self/burst nucleation” occurs. The burst nucleation immediately lowers the supersaturation level of monomers in solution; thus, nucleation stops and growth starts by diffusion of atoms. The LaMer mechanism predicts that the separation of nucleation and growth in time is required for the formation of a near monodisperse size distribution, which is accepted by the scientists today. Although LaMer’s mechanism is feasible for supersaturated systems, it does not explain how the transition metal nanoclusters nucleate and grow from dilute solutions.28
Figure 1.2 The LaMer mechanism of nucleation of sulfur. The (theoretical) curve shows sulfur concentration as a function of time.28
Shortly after LaMer’s work, Turkevich and co-workers29 proposed a mechanism for the stepwise formation of particles based on nucleation, growth, and agglomeration thanks to studies on colloidal gold using electron microscopy.
In 1997, a most significant contribution to the understanding of mechanistic aspects of a metal salt reduction was made by Finke and Watzky26 who reported a two-step mechanism (slow, continous nucleation and then fast autocatalytic growth). Then, a more general mechanism30,31 (four-step, double autocatalytic mechanism) for
CHAPTER I
Introduction to Transition Metal Nanoparticles
agglomeration, adding a third bimolecular agglomeration step followed by fourth, autocatalytic agglomeration step.
Under the lights of proposed mechanisms, the general mechanistic formation of metal nanoparticles can be summarized and simplified on three steps that are nucleation, growth and agglomeration (Figure 1.3). However, it should be noted that for metal particles, nucleation is the result of a complicated interplay of factors such as the difference between the redox potentials of the metal salt and the reducing agent, and the reaction conditions including the rate of addition, the reaction temperature, and even the stirring rate.27,28 Therefore, deep mechanistic studies are necessary to give a more complete and more general picture of what happens during nanoparticle nucleation and growth processes.
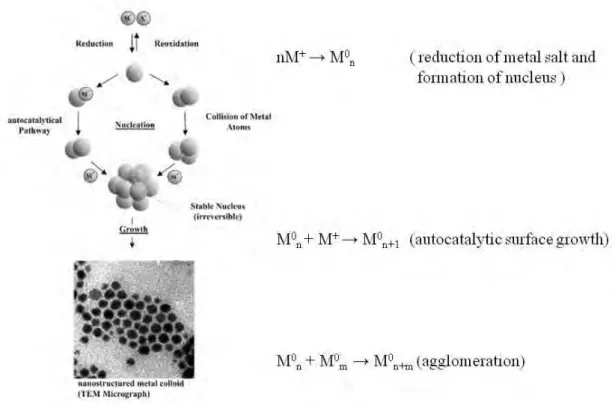
Figure 1.3 Formation of nanostructured metal colloids by the ‘‘salt reduction” method.32
As shown in Figure 1.3, the nucleation step starts with the reduction of the metal salt to zerovalent metal atoms. These atoms collide in solution with other metal(0) atoms or with sub-clusters already formed to give a stable ‘seed’ nucleus of 13 metal atoms.27
This is the first member of the so-called full-shell cluster family (see section 1.2.1) and its formation is irreversible. To initiate nucleation, the concentration of metal atoms in solution must be high enough to reach supersaturation. After nucleation, the autocatalytic surface growth starts to occur. If the growth period is almost the same for all the particles, a monodisperse sample will be obtained. However, if nucleation and growth do overlap, then the duration of the growth period will differ between nucleation sites and the growing particles tend to undergo ‘‘Ostwald ripening’’,33 diffusion of adatoms around small clusters to the environment of large clusters due to a difference of the two-dimensional gas atom density around clusters, or coalescence, an undesired mechanism that causes polydispersity. The growth period has to be stopped since some time later, the nanoparticles start to coagulate and eventually form aggregated bulk metal. Therefore, in order to gain high-quality nanoparticles, the passivation of the metallic surface by adding a stabilizer is essential (vide infra, Section 1.3). Surface passivation helps to achieve size selectivity by preventing agglomeration and fusing of particles.
1.2.1 “Magic Number” Clusters and Morphology of Metal Nanoparticles
In general, aggregates of atoms are classified into clusters (< 2 nm; two to several hundreds atoms) and particles (2-100 nm). The structure of clusters is determined by the number of atoms and their bonding. Magic numbers and sequences in cluster formation are intimately related to the nucleation and growth processes, which are governed by the often competing bonding and packing factors.33–35 While these processes may be
kinetically or thermodynamically controlled, and hence sensitive to experimental conditions, the fact that bonding effects are electronic in origin and packing factors are steric in nature implies that magic sequences result from successive fillings of electronic or atomic shells, respectively.34
Magic numbers describe the packing of atoms around a central atom of a cluster with a maximum stability and a minimum energy. Therefore, “magic number” clusters possess high ionization potentials, low electron affinity, high symmetry and reduced reactivity, high melting points and large highest occupied molecular orbital–lowest unoccupied molecular orbital (HOMO-LUMO) gaps as compared to clusters with one atom more or one atom less. 33
CHAPTER I
Introduction to Transition Metal Nanoparticles
Magic number cluster model describes a cluster with a central atom with closed shells as a close-packed structure. The radius (R) of a metal droplet can be written as follows33:
R = rws x N1/3
where N is the number of atoms in the droplet and rws is the Wigner-Seitz radius of the
element under consideration. The Wigner-Seitz radius is the radius of a sphere whose volume is equal to the mean volume per atom in the solid.36 For a general cubic crystal with j atoms in each unit cell and lattice constant a, the following relations can be written:
Where, for a simple cubic (sc) structure j=1, for body-centered cubic (bcc) j=2 and for face-centered cubic (fcc) j= 4.33
With this expression the number of atoms present in a nanocluster can be calculated from its size (or vice versa). For instance, the size of platinum (fcc metal, a = 0.392 nm) clusters consisting of 10, 55, 100 and 1000 atoms can be calculated from the formula
(R=rws x N1/3) as ~ 0.33, 0.58, 0.71 and 1.53 nm, respectively.33
After calculating the overall atom number in a nanocluster, one can also calculate the number of atoms in each shell of the cluster.35 Each shell in a cubic (bcc) or
hexagonal (hcp) close packed structure contains 10n2 + 2 atoms (n = number of shells).
Thus, for example, the clusters with n=1 and n=2 contain 12 and 42 atoms in their outer shell and consequentlu a total number of 13 and 55 atoms, respectively. The total number of atoms (N) in a cluster that forms cuboctahedron or icosahedron can be calculated with the expression35:
N(n) = N(n-1) + 10n2 + 2, where N(o) = 1 (central atom) and n (number of shells) > 1
These atoms can orientate in different structures (Figure 1.4) and their morphologies will depend on many factors among which the most important are: the method of production, the growth kinetics, the time scale of the synthesis reaction.33,34
Figure 1.4 Schematic representation of (A) cuboctahedral and (B) Icosahedral Mackay magic clusters.33 (n) and N represent number of shells and total number of atoms, respectively.
1.3 Stabilization of Metal Nanoparticles
Since the surface areas of metal nanoclusters are enormous relative to their masses, they have an excess surface free energy comparable to the lattice energy, making them thermodynamically unstable.14,27 At short interparticle distances, two particles
would be attracted to each other by van der Waals forces and, in the absence of any repulsive forces to counteract this attraction, an unprotected sol would coagulate. Therefore, they have to be stabilized in a certain extent against aggregation into larger particles and eventually to bulk metal. In the literature,4,14,15,27 the stabilization of metal nanoparticles is generally divided into five categories namely; electrostatic, steric, electrosteric, ligand stabilization and deposition on supported materials.
Electrostatic Stabilization: DLVO (Derjaugin-Landau-Verwey-Overbeek) theory was developed in the 1940’s to describe how colloids are stabilized.37 DLVO-type
stabilization is commonly referred as electrostatic stabilization since it relies on anions adsorbed to the coordinatively unsaturated, electrophilic surface of colloids to create columbic repulsion between particles. The electrostatic repulsion opposes van der Waals attractions which thus prevents particle agglomeration. Ionic compounds such as halides or carboxylates14,38 are often used to achieve electrostatic stabilization (Figure 1.5 a). A
CHAPTER I
Introduction to Transition Metal Nanoparticles
dispersion of metal clusters that are only stabilized electrostatically can, however, coagulate easily if the ionic strength of the dispersing medium is increased sufficiently for the double layer to become compressed. The level of stabilization can be influenced by altering the total charge on the metal cluster surface or the polarity of the solvent.19,27
Steric Stabilization: Steric stabilization is achieved by surrounding the metal core by layers of materials that are sterically bulky such as polymers or dendrimers (Figure 1.5 b-d). These large adsorbates provide a steric barrier between metal nanoparticles, thus preventing agglomeration.
Figure 1.5 Schematic representation of (a) electrostatically (b-d) sterically, and (e) electrosterically stabilized metal nanoparticles. Two possible polymeric stabilization modes are shown with individual (c) or
multiple (d) polymer chains.4
Electrosteric Stabilization: Here, the combination of both electrostatic and steric effects provides stabilization around metal nanoparticles like in the case of polyoxoanion39 and
tetraammoniumalkyl halide40,41 stabilized nanoclusters (Figure 1.5 e).
Ligand Stabilization: The predominantly covalent interactions between ligand molecules and nanoparticle surface usually stabilize the particles to such an extent that they may be isolated in solid state, without aggregation. Thiols, phosphines and amines which contain S, P, N donor atoms, respectively are commonly used as ligands to stabilize metal nanoparticles.11
Stabilization on Solid Supports: The deposition of nanoparticles in the confined void spaces of classical solid supports such as metal oxides, carbonaceous materials, zeolites or metal organic frameworks is another extensive way to prevent their aggregation.42,43
1.4 Synthesis of Metal Nanoparticles
Nanostructured metal colloids can be obtained following two approaches: top-down and bottom-up methods.1,32,15 The top-down method involves the thermal,
chemical or mechanical grinding of bulk metals and subsequent stabilization of the resulting nano-sized metal particles by adding protecting agents. However, the top-down approach suffers from broad particle size distributions (typically larger than 10 nm) and irreproducibility. The more common and practical bottom-up approach involves first the generation of metal atoms and then the nucleation and growth to a certain size. At this concern, the bottom-up approach provides more convenient ways to control the size of the particles. It includes four main synthetic methods: chemical reduction of transition metal complexes,44–46 thermal, photochemical or sonochemical decomposition,47–49
decomposition of organometallics,11,50 and electrochemical reduction.51
Today, the key goal in the chemistry of transition metal nanoparticles is the development of reproducible and controllable synthesis tools for the achievement of nanoparticles that are well-defined in size, shape and composition. This is of particular importance as the properties of metal nanoparticles are drastically influenced by their size, shape and composition.3,5,6 At this concern, the organometallic approach8,11 which
has been developed by Chaudret and Philippot et. al. for more than 20 years, provides an efficient way for the synthesis of metal nanoparticles with a high control. The next section will be devoted to the organometallic synthesis of metal nanoparticles as applied in the team. It will cover the general methodology, recent developments and choice of organometallic precursors.
1.4.1 Organometallic Approach for the Synthesis of Nanoparticles
Organometallic complexes associate one or several metal atoms with carbon containing fragments. The metal-carbon bond can be a σ-bond (metal-alkyl), π-bond (metal-olefin/arene) or a combination of both (allyl, cyclopentadienyl etc.).9 Several
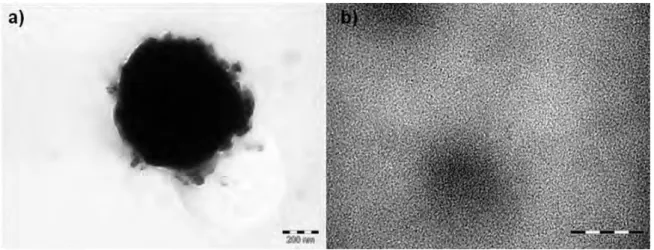
![Figure 2.21 HRTEM Images of RuRe/PVP NPs, obtained from [Ru(COD)(COT)] and [Re 2 (CO) 10 ] at 150 o C in anisole in the presence of PVP, at different magnifications](https://thumb-eu.123doks.com/thumbv2/123doknet/2087337.7296/82.892.140.778.286.927/figure-hrtem-images-obtained-anisole-presence-different-magnifications.webp)