Effects of level of intake and of available volatile fatty acids on the
absorptive capacity of sheep rumen
M. Doreaua, E. Ferchala, Y. Beckersb a
INRA, Laboratoire Sous-Nutrition des Ruminants, Theix, 63122 Saint-Genès Champanelle, France
b Faculté Universitaire des Sciences Agronomiques, Unité de Zootechnie, 2 passage des Déportés, 5030 Gembloux, Belgium
Abstract
The objective of this experiment was to determine the respective effects of level of intake and of the amount of volatile fatty acids (VFAs) present in the rumen on VFA ruminal absorption. In a factorial design, six ewes received a hay diet either at 126 or at 73% of energy maintenance requirements. Their capacity of absorption of VFAs was evaluated by the method of temporarily isolated rumens, in which the rumen was filled with solutions containing high or low amounts of VFAs. Rate of absorption (amount of VFAs absorbed per hour) was
significantly higher, by 32% on average, in sheep fed the high intake than in sheep fed at low intake. The proportion of initial VFAs absorbed did not depend on the concentration of VFAs introduced in the rumen, so that the amount of VFAs absorbed varied as the concentration of VFAs introduced in the rumen. The decrease in intake resulted in a decrease by 32% in the rate of absorption of total VFAs. No interaction between
concentration of VFAs and previous intake was observed. This suggests that the capacity of the rumen to absorb VFAs is reduced at low intake even if low amounts of VFAs are available.
Keywords: Sheep; Rumen; Absorption; Volatile fatty acids; Undernutrition
1. Introduction
In ruminants, changes in food supply without changing the composition of the diet have numerous consequences on digestive, metabolic and hormonal processes (Chilliard et al., 1995). In particular, variations in intake result in modifications in weight and metabolic activity of the digestive tract, occurring a few days after intake changes (Fell and Weekes, 1975; Ortigues and Doreau, 1995). It can be thought that these variations involve
modifications of the capacity of the rumen to absorb digestion end-products. According to Bergman (1990), only 75% of volatile fatty acids (VFAs) produced in the rumen are absorbed in this compartment, the remaining being absorbed in subsequent parts of the digestive tract. It has been shown recently that underfeeding sheep decreased the rate of VFA absorption in the rumen (Perrier et al., 1994). Similar results have been obtained by Gäbel et al. (1993) after 48 h fasting. The method used in these trials consisted of emptying the rumen, then introducing a given amount of VFAs in a buffered solution and measuring absorption of VFAs from the rumen. The consequences of this reduction of absorption rate are not known. It can be supposed that it is of minor importance because when food intake is decreased, the amount of VFAs available for absorption decreases. In order to answer this question, the aim of this experiment was to dissociate the effects of the level of intake and the amount of VFAs available for absorption by the rumen wall. Animals received the same diet at two intakes. At each intake, high or low amounts of VFAs were introduced in the rumen and their rate of absorption was measured.
2. Material and methods
2.1. Method of measurement of absorption capacity
The absorption capacity was measured by use of temporarily isolated rumens as described by Gäbel and Martens (1986). Animals were fitted with ruminal and duodenal cannulas. The rumen of each was emptied and washed with a saline solution to remove feed particles. Ruminal contents were kept at 39°C and returned to the rumen at the end of the assay. Saliva was continuously removed by a collector introduced in the oesophagus and
2.5 1) containing VFAs were introduced in the rumen. Their rate of absorption was measured for 2.5 h by regular ruminal samplings and VFA analyses. Two successive solutions were tested on the same day. Water exchanges through the rumen wall were taken into account using a marker of rumen liquid.
2.2. Animals, experimental design and feeding
Six dry ewes of the Lacaune breed, weighing 65.5 ± 7.1 kg at the beginning of the experiment, were used. They were fitted with a ruminal cannula (diameter 75 mm) and with a t-shaped abomasal cannula. They were separated into two groups according to their liveweight. The design was a 2 × 2 factorial scheme, with two experimental periods of 5 weeks. During the first period, three ewes were fed at high intake (HI) and the other three ewes at low intake (LI). During the second period, ewes previously fed at HI were fed at LI, and vice versa. At the end of each period, the six ewes were assayed for absorption measurements with two test solutions, high in VFAs (HS) and low in VFAs (LS). With this design, the six ewes were fed at each intake level, HI and LI, and in each case were assayed for both test solutions, HS and LS.
Ewes received as unique feed a natural grassland hay, second cut, in two equal parts, at 09:00 h and 15:00 h. The hour of morning feeding was 07:30 h on the days of the assays. During a preliminary period of 1 week, voluntary intake of this hay was determined. Two levels of intake were then defined: 1310 (HI) and 680 (LI) g dry matter (DM) daily. Although HI was chosen to be lower than voluntary intake, refusals were observed, so that the effective intakes were 1234 ± 39 and 674 ± 12 g DM for HI and LI, respectively.
On a mean hay sample, organic matter (ashing at 550°C for 6 h), crude protein (Kjeldahl method), neutral detergent fibre (NDF) and acid detergent fibre (ADF) (Goering and Van Soest, 1970) were 89.4, 12.5, 60.9 and 33.6% of DM, respectively; mean organic matter digestibility of the same hay, measured in another trial with four of these six ewes at similar intakes, had means of 67.6 and 67.2% for HI and LI (Perrier and Doreau, 1995). Due to between-period variations of liveweight, the calculated percentages of energy requirements (INRA, 1989) were 126 and 73% for HI and LI treatments. The percentages of protein requirements were 169 and 98% of protein requirements for HI and LI treatments.
2.3. Measurements, analyses and calculations
Two test solutions, differing by their concentration of VFAs, were successively used on the same day for each ewe in a random rank. Composition of these solutions is given in Table 1. They contained a buffer, a mixture of VFAs in similar proportions (69.1, 20.6 and 10.3% of acetic, propionic and butyric acids, respectively) and cobalt ethyleneoliamine tetracetic acid (Co-EDTA) as a marker of the liquid phase. Mannitol was added to the solution with the lowest VFA concentration to equilibrate the osmotic pressure of the two solutions and to ensure physiological conditions between 280 and 310 mOsm kg-1. Total VFA concentrations were 121.6 and 60.8 mM for solutions HS and LS, respectively.
Table 1 Chemical composition of test solutions (g l-1)
Solution HS a Solution LS a Buffer NaHCO3 8.5 8.5 KHCO3 4.4 4.4 NaCl 0.8 0.8 VFA mixture Acetate 5.03 2.52 Propionate 1.86 0.93 Butyrate 1.11 0.55 Co-EDTA 0.05 0.05 Mannitol - 11.08
a HS, high concentration in VFAs; LS, low concentration in VFAs.
The assays began at 09:30 h. A 15-ml sample of the liquid phase of ruminal contents was taken while emptying the rumen. Test solutions were sampled (15 ml) before and immediately after their introduction into the rumen, then every 30 min for 150 min. On all samples pH was measured then subsamples taken for VFA analysis (5 ml
liquid in 0.5 ml of 5% H3PO4) and Co-EDTA analysis (5 ml). Samples were centrifuged at 4900 × g for 15 min. Analysis of VFAs was performed by gas liquid chromatography (Jouany, 1982) with isocaproic and isobutyric acids as internal standards for ruminal fluid and VFA solutions, respectively. Co-EDTA was analysed by atomic absorption spectrophotometry (Udén et al., 1980).
Amount of VFAs present in the rumen at each time of sampling was calculated from VFA concentration and rumen volume of liquid obtained by initial infusion volume (2.5 1) corrected by Co-EDTA concentrations. Rate of VFA absorption (mmol h-1) was calculated by linear regression of the VFA ruminal amount in the five samples taken between 30 and 150 min after introduction of the test solution.
The water volume and pH of tests solutions at each sampling, and the amounts and percentages of VFAs absorbed, were analysed using the GLM procedure of SAS (1988) using the following model:
Y = Ii + Sj + Ak + ISij + IAik + SAjk + eijkl
where Y is the dependant variable, I the intake level (i = 1 or 2), S the solution infused in the rumen (i = 1 or 2),
A the animal (k = 1 to 6), IS the interaction between intake level and solution, IA the interaction between intake
level and animal, SA the interaction between solution and animal and e the residual error.
Moreover the differences in absorption rates from one VFA to the other were tested. The comparison of the percentages of absorption between acetate, propionate and butyrate was achieved by the model:
Z = Ii + Sj + Ak + ISij + IAik + SAjk + Nl + eijklm
where Z is the percentage of absorption and N is the nature of VFAs, acetate, propionate or butyrate (l = 1 to 3). When significant, differences between VFAs were compared using a Student-Newman-Keuls t-test.
3. Results
3.1. pH and volatile fatty acids of rumen liquid
The pH of rumen liquid averaged 5.87 and 5.88 for levels HI and LI, respectively. These low values are a consequence of the sampling 2 h after feeding. The pH is independent (P > 0.05) of the intake level.
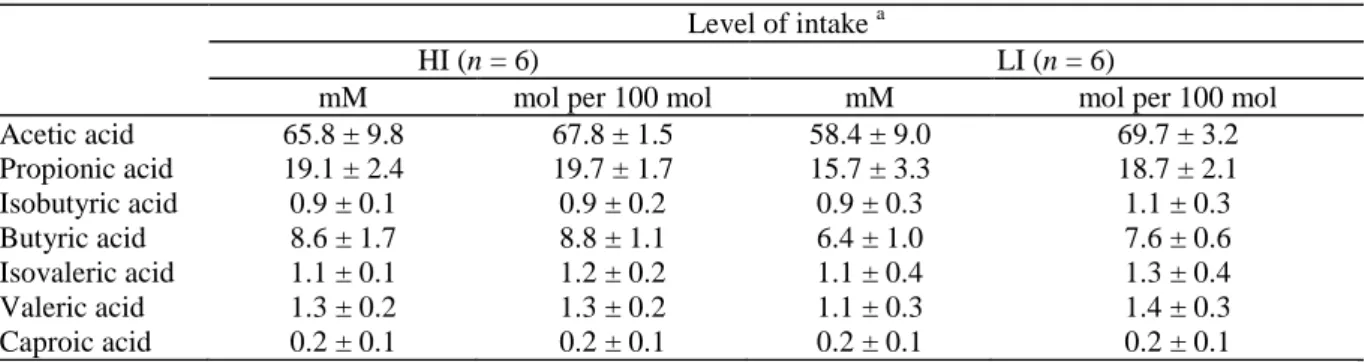
Total acidity of rumen liquid was 97.0 ± 13.1 and 83.9 ± 13.2 mM for treatments HI and LI. Concentrations of total and individual VFAs (Table 2) did not differ (P > 0.05) between intake levels, except that butyric acid concentration increased with intake level. No significant variation in the percentages of VFAs was shown (P > 0.05).
Table 2 Concentration and composition (mean ± SD) of volatile fatty acids in rumen liquid at the two levels of intake
Level of intake a
HI (n = 6) LI (n = 6)
mM mol per 100 mol mM mol per 100 mol
Acetic acid 65.8 ± 9.8 67.8 ± 1.5 58.4 ± 9.0 69.7 ± 3.2 Propionic acid 19.1 ± 2.4 19.7 ± 1.7 15.7 ± 3.3 18.7 ± 2.1 Isobutyric acid 0.9 ± 0.1 0.9 ± 0.2 0.9 ± 0.3 1.1 ± 0.3 Butyric acid 8.6 ± 1.7 8.8 ± 1.1 6.4 ± 1.0 7.6 ± 0.6 Isovaleric acid 1.1 ± 0.1 1.2 ± 0.2 1.1 ± 0.4 1.3 ± 0.4 Valeric acid 1.3 ± 0.2 1.3 ± 0.2 1.1 ± 0.3 1.4 ± 0.3 Caproic acid 0.2 ± 0.1 0.2 ± 0.1 0.2 ± 0.1 0.2 ± 0.1
Table 3 Rate of absorption of VFAs (mmol absorbed h-1, mean ± SD) at the two levels of intake with the two test solutions
Solution HS Solution LS Effect of
HI level LI level HI level LI level Solution Level of intake Interaction
(n = 6) (n = 6) (n = 6) (n = 6) (I) (I) (S×I)
Acetate 39.0 ± 14.0 25.1 ± 4.1 16.9 ± 3.7 12.7 ± 3.7 * * * * * NS
Propionate 13.3 ± 4.4 8.7 ± 1.7 5.9 ± 1.3 4.7 ± 1.2 * * * * * NS
Butyrate 7.1 ± 2.1 4.6 ± 1.0 2.9 ± 0.8 2.4 ± 0.7 * * * * * *
Total VFAs 59.6 ± 20.2 38.7 ± 6.3 25.8 ± 5.8 19.7 ± 5.6 * * * * * NS
HS, high level of VFAs in the infused solution; LS, low level of VFAs in the infused solution; HI, high level of intake; LI, low level of intake. * * * = P < 0.001; * * = P < 0.01; * = P < 0.05; NS = P > 0.05.
Table 4 Percentage of VFA absorption (% of initially infused absorbed h-1, mean ± SD) at the two levels of
intake with the two test solutions
Solution HS Solution LS Effect of
HI level LI level HI level LI level Solution Level of intake Interaction
(n = 6) (n = 6) (n = 6) (n = 6) (S) (I) (S×I)
Acetate 18.1 ± 4.2 12.8 ± 2.2 17.1 ± 4.2 12.9 ± 3.4 NS * * * NS
Propionate 20.4 ± 4.0 14.5 ± 2.7 19.4 ± 4.2 15.3 ± 3.0 NS * * NS
Butyrate 22.1 ± 3.7 15.3 ± 3.3 19.3 ± 5.0 15.8 ± 3.9 NS * * NS
Total VFAs 19.1 ± 1.0 13.5 ± 2.3 17.8 ± 4.3 13.7 ± 3.3 NS * * * NS
HS, high level of VFAs in the infused solution; LS, low level of VFAs in the infused solution; HI, high level of intake; LI, low level of intake. * * * = P < 0.001; * * = P < 0.01; NS = P > 0.05.
3.2. Volume and pH variations of the test solutions
Variations of ruminal water volume after the introduction of test solutions, as measured by Co-EDTA, depended neither on the level of intake nor on the animal. Volume was modified by the nature of the test solution (P < 0.05). For solution HS, the liquid volume increased during the 150 min of the assay to 2.8 1. For solution LS, it increased to 2.6 1 for the first 60 min and then stabilized.
The initial pH of test solution differed (6.20 vs 6.88; P < 0.01) for solutions HS and LS, respectively. This difference progressively decreased but remained significant (P < 0.05) for the first 120 min of the assay. At 150 min, the pH was 7.29 and 7.41 (P > 0.05) for solutions HS and LS, respectively.
3.3. Volatile fatty acid absorption
The absorption of VFAs appeared linear for the 150 min of measurements. The correlation coefficient between VFA concentration and time was 0.95 for acetate and 0.97 for propionate and butyrate. However, a trend to curvilinearity was shown by the values of the residuals of the regression.
The rates of absorption (amount absorbed per hour) of individual and total VFAs were about twofold higher (P < 0.001) for solution HS than for solution LS, and 32% higher (P < 0.01) for HI than for level LI (Table 3). The animal effect and the interactions between intake and test solution were significant (P < 0.05) only for butyrate. The interactions between animal and level of intake, and between animal and test solution, were non-significant. The percentage of absorption was not affected by test solution (P > 0.05) but was higher (P < 0.01) for HI than for LI, for all individual VFAs (Table 4). The animal effect was significant for acetate (P < 0.01) and for propionate, butyrate and total VFAs (P < 0.05). The interaction between animal and level of intake was significant for acetate (P < 0.01) and total VFAs (P < 0.05) but non-significant for propionate and butyrate (P > 0.05). The interactions between level of intake and test solution, and between animal and test solution, were non-significant.
4. Discussion
4.1. Validation of the method
The slight difference in volume of the test solutions may have resulted in a bias in absorption because the increase in volume leads to a dilution of VFAs in water. This decrease in concentration tends to limit the amount of VFAs absorbed because absorption depends on VFA concentration in the lumen (see below). This bias may have led to an underestimation of the difference of absorption between HS and LS.
The pH differences between the two solutions occurred even though the buffer chosen was shown in a preliminary trial to be more efficient than other buffers mentioned in the literature. It is known that when pH increases, absorption rate decreases (Bueno, 1972; Weigand et al., 1972a,b). This variation could be low for pH higher than 7 because most VFAs are in a dissociated form. The slight curvilinearity of the regression of VFAs absorbed against time could be explained by pH increase. However, the high correlation coefficient of the linear regression suggests that the effect of pH on absorption is limited in this experiment.
4.2. Effect of available VFAs
The amount of VFAs available for absorption differed according to the test solution. It did not modify the percentage of VFAs absorbed, so the amount of VFAs absorbed for HS was twice that for LS. This result confirms previous data obtained with the same method by Weigand et al. (1972a,b), Thorlacius and Lodge (1973) and Oshio and Tahata (1984) who showed that VFA absorption rate (% of VFAs infused) was constant when their ruminal concentration increased, provided the latter was lower than 130 mM. Peters et al. (1992) obtained the same result using marked VFAs. Only Dijkstra et al. (1993) observed a saturation of VFA
absorption when VFA concentration increased. Collectively, these results show that the luminal concentration of VFAs has a small influence on percentage of absorption.
Under normal feeding conditions, the percentage of VFAs produced which is absorbed in the rumen decreases when VFA production increases (Bergman, 1990). This seems to be a result of the increase in liquid outflow rate towards the omasum, and not from modifications of absorption capacity.
4.3. Effect of level of intake
The significant effect of level of intake on rate and percentages of VFA absorption confirms the data recently obtained by Perrier et al. (1994) on sheep given hay either at maintenance or at half maintenance requirements, and those of Gäbel et al. (1993) who compared normally fed and fasted sheep. In the present trial, the decrease in intake reduced absorption rate by 32%, similar to the findings of Perrier et al. (1994). In these two latter trials, the reduction was of the same magnitude for the three VFAs, whereas the reduction was lower for acetate than for propionate and butyrate in the trial by Gäbel et al. (1993).
Level of intake modifies the characteristics of the rumen wall. The weight of the rumen is widely dependent on intake (Ortigues and Doreau, 1995). This variation concerns both muscular layers and mucosa, where absorption takes place (Johnson et al., 1987). This variation was observed as soon as 5 days by Rompala and Hoagland (1987), and can last 3 weeks after the change in intake (Burrin et al., 1990). It is likely that variations of weight of the ruminal wall occurred in the present experiment. These variations have been attributed to hyperplasia (Moon and Campbell, 1973) and hypertrophia (Burrin et al., 1992). Both effects may improve absorption, as VFA absorption mainly occurs by passive diffusion.
Intake is positively related to blood flow (Lindsay, 1993). This variation is due to the increase of oxidative metabolism with intake (Rémond et al, 1995), which in turn increases the gradient of concentration between the lumen and the epithelial cells and thus the passive VFA absorption. It can be hypothesized that both the variation in weight of mucosa and in blood flow explain the variations in absorption measured in this experiment.
4.4. Interaction between available VFAs and level of intake
The effect of level of intake is of the same extent whatever the amount of VFAs to be absorbed. The variations in VFA luminal concentration are not sufficient to induce a variation in absorption. A main consequence is that VFA absorption may not be optimized at low levels of intake. No mechanisms of adaptation of absorptive processes to undernutrition are shown, contrary to digestive processes which are more efficient when intake decreases (Chilliard et al., 1995).
Acknowledgements
The authors sincerely thank A. Combeau and D. Roux for their participation in animal manipulations, and R. Lefaivre and J. Chabrot for chemical analyses.
References
Bergman, E.N., 1990. Energy contribution of volatile fatty acids from the gastrointestinal tract in various species. Physiol. Rev., 70: 567-590.
Bueno, L., 1972. Le rumen isolé in situ: absorption des acides gras volatils (In situ isolated rumen: absorption of volatile fatty acids). Rev. Méd. Vét., 123: 943-953.
Burrin, D.G., Ferrell, C.L., Britton, R.A. and Bauer, M., 1990. Level of nutrition and visceral organ size and metabolic activity in sheep. Br. J. Nutr., 64: 439-448.
Burrin, D.G., Britton, R.A., Ferrell, C.L. and Bauer, M.L., 1992. Level of nutrition and visceral organ protein synthetic capacity and nucleic acid content in sheep. J. Anim. Sci., 70: 1137-1145.
Chilliard, Y., Doreau, M., Bocquier, F. and Lobley, G.E., 1995. Digestive and metabolic adaptations of ruminants to variations in food supply. In: M. Journet, E. Grenet, M.H. Farce, M. Thériez and C. Demarquilly (Editors), Recent Developments in the Nutrition of Herbivores. INRA Publ., Paris, pp. 329-360.
Dijkstra, J., Boer, H., Van Bruchem, J., Bruining, M. and Tamminga, S., 1993. Absorption of volatile fatty acids from the rumen of lactating dairy cows as influenced by volatile fatty acid concentration, pH and rumen liquid volume. Br. J. Nutr., 69: 385-396.
Fell, B.F. and Weekes, T.E.C., 1975. Food intake as a mediator of adaptation in the ruminal epithelium. In: I.W. McDonald and A.C.I. Warner (Editors), Digestion and Metabolism in the Ruminant. University of New England, Armidale, Australia, pp. 101-118.
Gäbel, G. and Martens, H., 1986. The effect of ammonia on magnesium metabolism in sheep. J. Anim. Physiol. Anim. Nutr., 55: 278-287.
Gäbel, G., Marek, M. and Martens, H., 1993. Influence of food deprivation on SCFA and electrolyte transport across sheep reticulorumen. J. Vet. Med., 40: 339-344.
Goering, H.K. and Van Soest, P.J., 1970. Forage Fiber Analysis (Apparatus, Reagents, Procedures and Some Applications). Agricultural Handbook No. 379, ARS, USDA, Washington, DC, 20 pp.
INRA, 1989. Ruminant Nutrition: Recommended Allowances and Feed Tables. John Libbey Eurotext, Paris, 389 pp.
Johnson, C.L., Johnson, D.E. and Rumpler, W.V., 1987. Source and level of alimentation effects on visceral organ mass of fat steers. In: P.W. Moe, H.F. Tyrrell and P.J. Reynolds (Editors), Energy Metabolism of Farm Animals. Rowman and Littlefield, Totowa, NJ, USA, pp. 50-53.
Jouany, J.P., 1982. Volatile fatty acids and alcohol determination in digestive contents, silage juices, bacterial cultures and anaerobic fermentor contents. Sci. Aliments, 2: 131-144.
Lindsay, D.B., 1993. Metabolism of the portal-drained viscera. In: J.M. Forbes and J. France (Editors), Quantitative Aspects of Ruminant Digestion and Metabolism. CAB International, Wallingford, UK, pp. 267-289.
Moon, S.J. and Campbell, R.M., 1973. Effects of reproduction in sheep on the rate of cell division and nucleic acid content of the ruminal mucosa. J. Agric. Sci. (Camb.), 80: 443-449.
Ortigues, I. and Doreau, M., 1995. Responses of the splanchnic tissues of ruminants to changes in intake: absorption of digestion end products, tissues mass, metabolic activity and implications to whole animal energy metabolism. Ann. Zootech., 44: 321-346.
Oshio, S. and Tahata, I., 1984. Absorption of dissociated volatile fatty acids through the rumen wall of sheep. Can. J. Anim. Sci., 64(suppl.): 167-168.
Perrier, R. and Doreau, M., 1995. Effect of long-term underfeeding and subsequent refeeding on hay digestibility in sheep. Ann. Zootech., 44(suppl.): 206.
Perrier, R., Ferchal, E., Durier, C. and Doreau, M., 1994. Effect of undernutrition on the ability of the sheep rumen to absorb volatile fatty acids. Reprod. Nutr. Dev., 34: 341-347.
Peters, J.P., Shen. R.Y.W. and Robinson, J.A., 1992. Disappearance of acetic acid from the bovine reticulorumen at basal and elevated concentrations of acetic acid. J. Anim. Sci., 70: 1509-1517.
Rompala, R.E. and Hoagland, T.A., 1987. Effect of level of alimentation on visceral organ mass and the morphology and Na + , K + adenosinetriphosphatase activity of intestinal mucosa in lambs. J. Anim. Sci., 65: 1058-1063.
SAS, 1988. SAS/STAT User's Guide: Statistics (6.03 Ed.). SAS Inst. Inc., Cary, NC, 1028 pp.
Thorlacius, S.O. and Lodge, G.A., 1973. Absorption of steam-volatile fatty acids from the rumen of the cow as influenced by diet, buffers, and pH. Can. J. Anim. Sci., 53: 279-288.
Udén, P., Colucci, P.E. and Van Soest, P.J., 1980. Investigation of chromium, cerium and cobalt as markers in digesta. Rate of passage studies. J. Sci. Food Agric, 31: 625-632.
Weigand, E., Young, J.W. and MacGilliard, A.D., 1972a. Extent of butyrate metabolism by bovine ruminoreticulum epithelium and the relationship to absorption rate. J. Dairy Sci., 55: 589-597.
Weigand, E., Young, J.W. and MacGilliard, A.D., !972b. Extent of propionate metabolism during absorption from the bovine ruminoreticulum. Biochem. J., 126: 201-209.