HAL Id: hal-00670230
https://hal.archives-ouvertes.fr/hal-00670230
Submitted on 15 Feb 2012
HAL is a multi-disciplinary open access
archive for the deposit and dissemination of
sci-entific research documents, whether they are
pub-lished or not. The documents may come from
teaching and research institutions in France or
abroad, or from public or private research centers.
L’archive ouverte pluridisciplinaire HAL, est
destinée au dépôt et à la diffusion de documents
scientifiques de niveau recherche, publiés ou non,
émanant des établissements d’enseignement et de
recherche français ou étrangers, des laboratoires
publics ou privés.
A SUBJECTIVE EVALUATION OF 3D IPTV
BROADCASTING IMPLEMENTATIONS
CONSIDERING CODING AND TRANSMISSION
DEGRADATION
Pierre Lebreton, Alexander Raake, Marcus Barkowsky, Patrick Le Callet
To cite this version:
Pierre Lebreton, Alexander Raake, Marcus Barkowsky, Patrick Le Callet. A SUBJECTIVE
EVAL-UATION OF 3D IPTV BROADCASTING IMPLEMENTATIONS CONSIDERING CODING AND
TRANSMISSION DEGRADATION. IEEE International Symposium on Multimedia 2011 (ISM), Dec
2011, United States. pp. 506-511, �10.1109/ISM.2011.89�. �hal-00670230�
A SUBJECTIVE EVALUATION OF 3D IPTV BROADCASTING
IMPLEMENTATIONS CONSIDERING CODING AND TRANSMISSION
DEGRADATION
Pierre Lebreton1,2, Alexander Raake1 Assessment of IP-Based Applications1 Deutsche Telekom Laboratories, TU Berlin Ernst-Reuter-Platz 7, 10587 Berlin, Germany
{firstname}.{lastname}@telekom.de
Marcus Barkowsky2, Patrick Le Callet2 2Team Image and Video Comunication Ecole Polytechnique de l’Universite de Nantes IRCCyN, rue Christian Pauc, 44306 Nantes, France
{firstname}.{lastname}@univ-nantes.fr
Abstract—This paper describes the results of a subjective test to assess current technology used for 3DTV broadcasting. As a first aspect, the performance of the currently deployed coding schemes was compared to state of the art algorithms. Our results show that downsampling and packing 3D stereoscopic videos according to the so called Side-By-Side format gives the highest perceived quality for a given bitrate. The second aspect of the study was to investigate how common 2D error concealment algorithms perform in case of 3D, and how their 3D-related performance compares with the 2D case. The results provide information on whether binocular suppression or binocular rivalries play the most important role for 3D video quality under transmission error. The results indicate that binocular rivalries and related visual discomfort are the dominant factors. Another aspect of the paper is a comparison of the test results with results from different labs to evaluate the repeatability of a subjective experiment in the 3D case, and to compare the employed test methodologies. Here, the study shows the variation between observers when they are rating visual discomfort and illustrates the difficulty to evaluate this new dimension.
Keywords-3D Video Quality, Packet losses, Coding, Subjec-tive testing, Visual discomfort
I. INTRODUCTION
3D is the next step for television. Addind the feature of 3D is frequently put at the same level as the transition from monochrome to color. However, to ensure high acceptance of a 3DTV service it is necessary to transmit high quality videos even though the additional amount of required bit rate is high. In the literature, a number of studies address the quality of 3D video. We can cite the work of Strohmeier et al. who investigated the quality of mobile 3DTV using different coding schemes and different error rates [1]. However, since their study was focused on mobile 3DTV using auto-stereoscopic displays and low resolutions videos, results are assumed to be different from our HD stereoscopic case. This difference is due to the different level of visibility of artifacts due to resolution and display technology. In the context of HDTV stereoscopic video, Wang et al. [2] have studied the perceived quality of 3D HD video encoded with different coding schemes (Simulcast, MVC, and simulcast with lower spatial or temporal resolution). One of the outcomes is that for the same perceived quality, an important reduction in bit rate could be achieved by decreasing the spatial resolution. The effect of spatial down-sampling on perceived
quality of 3D video was also studied by Stelmach et al. [3]. In this study they considered different combinations of vertical and horizontal down-sampling and evaluated the effect on perceived quality, and on depth and sharpness impression. This spatial down-sampling is currently used for 3D HDTV broadcasting in the “Side by Side” representation. In addition to representation and compression, transmission plays a very important role for video quality, and thus needs to be studied as well. Some results on this topic can be found in Strohmeier et al [1]. They studied the quality-impact of packet loss in the mobile case. In their study, they also considered the robustness of different coding schemes under transmission errors. Some results have also been presented for the 3D HD stereoscopic case by Barkowsky et al. [4], who studied the efficiency of different concealment algorithms when only one of the two stereoscopic views is damaged.
In the present paper we address the quality evaluation of compressed videos considering the coding and transmission schemes that are currently used for broadcast IPTV, and try to compare them with results obtained for other available algorithms described in the literature (simulcast and MVC).
The majority of experiments referred to so far were designed for assessing the quality of experience (QoE) perceived by observers watching 3DTV. However, for 3D a QoE evaluation is not straightforward. The recommendations from the International Telecommunication Union (ITU) ITU-R BT.500-12 [5], ITU-T P.910 [6], and ITU-R BT.1438 [7] are not adequate for 3D QoE evaluation. This issue has been studied by Chen et al [8], and a number of unclear points have been raised. Regarding the testing methodology, several alternatives to the ITU methodologies have been proposed to evaluate the global 3D experience. Seuntiens studied different criteria like naturalness [9]. Strohmeier [10] proposed a new methodology: the open profiling of quality (OPQ) in which he asks the observers to rate the global quality and give few adjectives in their own vocabulary to explain their judgment. Considering the fact that many aspects of 3DTV quality assessment have not been clearly defined, high variations can occur between test laboratories. To evaluate this issue, Wang et al. have compared test results of the same experiment conducted in two laboratories, and have found a linear relation between the two labs’ results [2]. Our test was designed with some intersection with previous tests from the literature, enabling us to make some comparisons between test methodologies and to continue to study which factors mainly influence subjective test results.
descrip-tion of the experiment. Secdescrip-tion 3 and 4 presents the results obtained for different coding schemes and transmission under packet loss, respectively. Section 5 indicates paths for further research, and section 6 concludes the paper.
II. EXPERIMENTAL SETUP
A. Source material
Seven contents have been used as source material (SRCs). All of them were 10s long full-HD progressive sources of 25 frames/second (1080p25). The contents have different spatial, tem-poral and depth characteristics:
1) Horse: Horse standing in a field, scene change, car approach-ing, scene change, the horse starts to walk. This content has complex texture and a slow pan motion.
2) Car Race Prep.: Preparation of a race; several scene changes, colorful, high spatial complexity, slow motion.
3) Car Race: Scene with cars racing; several scene changes, high motion and large depth range.
4) Piano: Man playing the piano; slow pan motion, low spatial complexity.
5) Ski: Skier skiing; low on texture, high motion, large depth range.
6) SkullRock: 3D generated sequence, low spatial complexity, low motion, and high depth range.
7) Boxe: Two men boxing. There is only the boxers’ movement.
B. Processing of test sequences
To generate all the Processed Video Signals (PVS), several Hypothetical Reference Circuits (HRCs) were considered. These HRCs can be divided into two distinct groups: coding-only and coding under transmission errors. The general processing procedure according to the first part of the HRCs is described in Fig. 1, where encoding is done according to one of three different coding schemes:
1) Simulcast (Fig. 1 a): the two views are encoded indepen-dently using an H.264 encoder (x264 [11])
2) MVC (Fig. 1 b)): the two views are encoded exploiting the redundancy between views, here using JMVC 8.2.
3) Side by Side + H.264 (Fig. 1 c)): the two views are each downscaled and encapsulated in an HD frame, then H.264 encoded (x264).
For each coding scheme, different values of Quantization Param-eter (QP) have been chosen. Defining QP instead of bitrate gives us the ability to reach a more constant quality over all SRCs and thus avoid to have contents with always low quality (because maximum bitrate is too low to achieve high quality) or having contents with always high quality (because the selected range of bitrates always leads to high quality). Details on the different HRCs are listed in Table I.
The second part of the HRCs covers different conditions of transmission errors. The process of simulating the transmission errors is depicted in Fig. 2. Each view of the SRC is encoded independently using an H.264 encoder (x264). The frames were decomposed into 68 slices, which corresponds to one slice per macroblock line. The GOP structure was (M,N) with M=3 and keyframe rate N=1/s. The software “sirannon” [12] was used to encapsulate the bitstream into MPEG2-TS, and the resulting TS-packets into RTP TS-packets. The software tcpdump is then used to capture the RTP packets and save them in a packet capture file “.pcap”. The simulation of the lossy channel was done as follow: we used a random number generator which indicated us the the packets number which should be dropped. This random number
Left View Right View H.264 encoding H.264 encoding H.264 decoding H.264 decoding Reconstituted stereo. views (a) Simulcast. Left View Right View MVC encoding decodingMVC Reconstituted stereo. views (b) MVC. Left View
Right View Downsampling(lanczos)
SbS packing Left Right Left Right H.264 encoding H.264 decoding Unpacking Left Right Upsampling
(lanczos) Reconstitued stereo. views
width = width / 2 width = width x 2 Downsampling (lanczos) width = width / 2 (c) Side by side.
Figure 1. Encoding of the SRC using different coding schemes
HRC Coding Scheme QP Packet loss rate [%]
1 Simulcast - -2 Simulcast 26 0.0 3 Simulcast 26 0.4 4 Simulcast 26 0.9 5 Simulcast 32 0.0 6 Simulcast 38 0.0 7 Simulcast 38 0.4 8 Simulcast 38 0.9 9 Simulcast 40 0.0 10 MVC 26 0.0 11 MVC 32 0.0 12 MVC 38 0.0 13 MVC 40 0.0 14 Frame Packing (SbS) 26 0.0 15 Frame Packing (SbS) 32 0.0 16 Frame Packing (SbS) 38 0.0 17 Frame Packing (SbS) 40 0.0 18 2D - -19 2D 26 0.4 20 2D 26 0.9 21 2D 38 0.0 22 2D 38 0.4 23 2D 38 0.9 Table I
HYPOTHETICALREFERENCECIRCUITS(HRCS)
generator followed a uniform law, and no content-dependent dif-ference between RTP packets was made (e.g. in terms of whether an I-, P- or B-frames was hit by the loss). We only took care that the first I-frame of the PVS was not affected by packet loss. Finally, we used a decoder implemented by Deutsche Telekom Laboratories to decode the video. This decoder (used by ITU-T SG.12 in the context of the P.NAMS and P.NBAMS standardization contests)
SRC
Encoding
Encapsulation
MPEG2-TS
Transmission
Over RTP
sirannon & tcpdump
uniform random
drop RTP packets
Desencapsulation
RTP
Desencapsulation
MPEG2-TS
Decoding
Deutsche Telekom Decoder
PVS
.264
.pcap .pcap
Figure 2. Simulation of transmission errors
has the particularity to be able to take pcap-files as input. This decoder implements an intra-error concealment algorithm. The 2D sequences have been realized by presenting the same, (left) view to the two eyes.
C. Subjective experiment
For the subjective experiment, the laboratory test environment was set as defined in ITU-R BT.500-12 [5]. A 23” Alienware OptX 3D Full HD Display was used. This display has a native resolution of 1920x1080 and a refresh rate of 120Hz. The display was used in combination with NVidia 3D Vision shutter-glasses. The viewing distance was set to three times the picture height (3H). The maximum value of crossed and uncrossed disparities was checked on every SRC (using a motion estimation-based algorithm to estimate stereo disparities [13]) to ensure that the disparity values stay in the comfortable viewing zone (zone described by Chen et al [8]). The luminance of the background was set to 50 cd/m2. The test methodology was Absolute Category Rating with hidden reference (ACR-HR). 21 observers took part in the test, and were asked to rate the general quality and the visual discomfort, each on a five grade discrete scale with the typical labels “Excellent”, “Good”, “Fair”, “Poor” and “Bad”. It is only after rating the PVS on these two scales that the observers were allowed to watch the next PVS. After screening using the methodology described in the VQEG 3DTV Test Plan, one observer was rejected.
The general procedure of a test was as follow: the test started by a training session composed of seven sequences. This training was designed to illustrate the rating task and to introduce the ranges of contents and of quality. In the main session, the observer could rate the 161 sequences in two sessions, one of 81 and one of 80 PVSs (with a 15min break between the two parts). The whole test (including a vision test and break) took 1.25 h.
III. COMPARISONCODINGSCHEMES
A. Test results
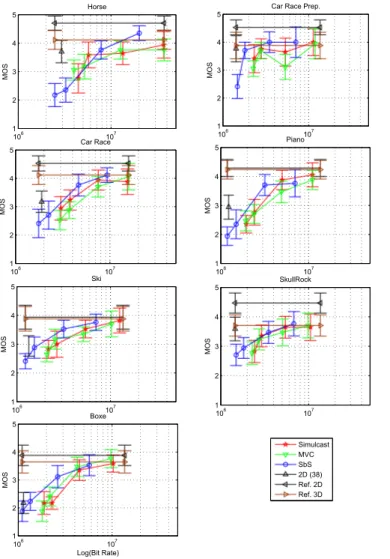
The first objective of our test was to compare the quality and consequently bit rate requirements of video encoded with different coding schemes. Here, the Side by Side (SbS) representation currently used for 3D IPTV broadcasting was to be compared with other available algorithms (simulcast and MVC). Fig. 3 depicts the mean quality rating per content and per coding scheme as a function of the logarithm of the bit rate. Also shown are the 95% confidence intervals (CIs). As can be seen from the graphs, CIs are rather high and in the range (a,b). A MANOVA (Multivariate ANalysis
106 107 1 2 3 4 5 MOS Horse 106 107 1 2 3 4 5 MOS
Car Race Prep.
106 107 1 2 3 4 5 MOS Car Race 106 107 1 2 3 4 5 MOS Piano 106 107 1 2 3 4 5 MOS Ski 106 107 1 2 3 4 5 MOS SkullRock 106 107 1 2 3 4 5 Log(Bit Rate) MOS Boxe Simulcast MVC SbS 2D (38) Ref. 2D Ref. 3D
Figure 3. Quality per content and per coding scheme.
Of VAriance) to explain quality with the fixed factors (QP, coding scheme, contents), reveals that there is a significant impact due to coding scheme (F=5.77, p = 0.0015), and a significant impact due to content (F=12.6, p < 0.0001). Fig. 4 is based on a student t-test, and indicates which condition-pairs are statistically different from each other.
From a first inspection of Fig. 5 we can state that at a given bit-rate level, in most cases SbS provides a higher perceived quality than Simulcast and MVC. We did not observe a strong gain in bit rate for the MVC coding scheme compared to Simulcast. However MVC is still young and further improvement can be expected. Another advantage of MVC which is not taken into account in this study is its backward compatibility (e.g. a MVC bitstream can be decoded by a H.264/AVC -compatible decoder simply by dropping the data it does not understand: the one related to the other views), which is an important feature for 3DTV broadcasting. For evaluating the difference of required bit-rate between methodologies, the approach proposed by Wang et al [2] was used: For every PVS in SbS representation, the value of bitrate required for achieving the same perceptual quality but using Simulcast or MVC is determined. The estimation of equivalent bitrate is done using a linear regression between known values in
0 5 10 15 20 0 5 10 15 20 HRC HRC
Figure 4. Test of statistical difference of Quality between HRC. A dot
means no statistical difference. A triangle oriented to the top means that the horizontal condition is statistically better than the vertical condition.
SRC MOS Gain compared to
Simulcast Gain compared to MVC 1 3.94 31% 21% 2 4.00 31% 28% 3 4.12 40% 56% 4 4.06 57% 57% 5 3.82 55% 48% 6 3.65 52% 58% 7 3.59 55% 55% Table II
GAIN INBITRATE OF USING THESBSREPRESENTATION COMPARED TO
SIMULCAST ORMVCFOR A FIXED QUALITY LEVEL
the log(bitrate) vs. Mean Opinion Score (MOS) space. Then, the ratio of required bitrate for SbS divided by the bitrate required for Simulcast or MVC is calculated. This provides a measure of the relative bitrate gain for each coding scheme. Table II provides the results in terms of equivalent bitrate. On average, a 50% gain in bitrate can be reached using the SbS representation, without reducing perceptual quality. These results are in accordance with previous tests from the literature [2] [3]. We can also see that MVC did not provide a significant quality improvement in our experiment, and that the results were highly content-dependent. These test results seem to indicate that for a given bitrate the current implementation of 3D HDTV broadcast services achieves a higher quality than the other available standards (using full resolution), when a specific limited value of bit rate is required. We can also observe that in most cases the quality level that can be achieved with SbS is as high as the quality achieved with the simulcast reference. The most likely reason for this last result is that it is difficult for the observer to differentiate between high quality contents when the contents are presented sequentially as it is done in a single stimulus test.
B. Inter-laboratory comparison
A second part of experimental data analysis consisted in comparing the test results with results obtained by other laboratories. Two other laboratories (L1: ACREO, L2: IRCCyN) have conducted experiments with similar conditions. The comparison of their experimental results was part of the analysis presented in [2]. In our experiment we used different SRCs. Only
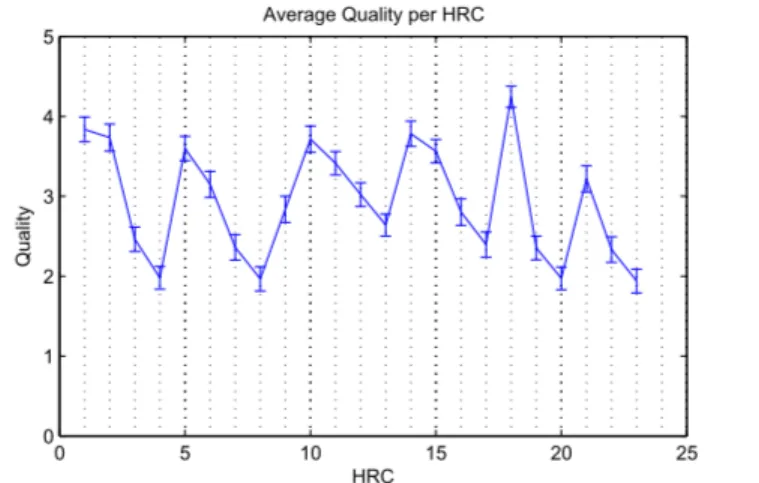
0 5 10 15 20 25 0 1 2 3 4 5 HRC Quality
Average Quality per HRC
Figure 5. Quality rating in function of the HRC
1 1.5 2 2.5 3 3.5 4 4.5 5 1 1.5 2 2.5 3 3.5 4 4.5 5 TLabs ACREO ACREO vs TLabs Simulcast MVC 2D 1 1.5 2 2.5 3 3.5 4 4.5 5 1 1.5 2 2.5 3 3.5 4 4.5 5 T−Labs IRCCyN TLabs vs IRCCyN Simulcast MVC 2D 1 1.5 2 2.5 3 3.5 4 4.5 5 1 1.5 2 2.5 3 3.5 4 4.5 5 ACREO IRCCyN ACREO vs IRCCyN Simulcast MVC 2D
Figure 6. Comparison of quality evaluation between laboratories
9 HRC were common between the tests (1,2,5,6,10,11,12,18,21). Another difference between our tests was that people saw video with transmission impairment in our testso that the ranges of degradation types and quality were clearly different. Another difference between the tests is the methodology used for evaluating the visual discomfort: in our test we used ACR with a 5 grade scale, the other tests used also ACR-HR but the vocabulary used indicated a comparison with the 2D viewing (e.g. the 3D presentation was: much more comfortable than 2D, more comfortable than 2D, as comfortable as 2D...).
Fig. 6 depicts a direct comparison between the labs quality test results on identical HRCs. A linear relation can be observed between the labs. The Pearson correlation is 0.84 between our test and L1, 0.71 with L2 and 0.97 between L1 and L2. The correlation is very high between these last two, however as we can see in [2], depending on the HRC and PVS the variations between quality rating can be higher. An interesting aspect is that the correlation between our test results and L1’s test results is much better than the correlation we get with L2. We do not have yet a clear answer on this question.
0 5 0 2 4 Quality Comfort 0 5 0 2 4 Quality Comfort 0 5 0 2 4 Quality Comfort 0 5 0 2 4 Comfort 0 5 0 2 4 Quality Comfort
Figure 7. Different type of answers between the observers: each scutter
plot represents a type of observer’ in terms of her answers
Another interesting point was found in case of the visual dis-comfort evaluation. Fig. 7 depicts a direct comparison of the quality and discomfort ratings. From this figure it becomes apparent that observers have answered differently in case of the visual discomfort scale: there are subjects who have rated quality and discomfort in a similar fashion and others who did not. To further analyze these variations, we have classified the observers in different classes. We can state that this problem was not specific to our test and was also visible in the tests results of L1 and L2. It appears that visual discomfort is a difficult concept and not all observers understand the scale in an identical way.
The different pattern of answers observed were:
1) The observers who answered with a clear linear relation with the quality scale. These ones either have considered a direct relation between discomfort and quality, or were simply not able to distinguish between the related two concepts 2) The observers who completely covered the space with
differ-ent quality–discomfort rating value pairs for differdiffer-ent HRCs. This group apparently considered quality and discomfort to not necessarily be related, for example when the discomfort is mainly due to the content.
3) The observers showing an answer pattern in the shape of a triangular matrix: the value of discomfort is between [1, CMax] with CMax being a function linearly dependent on the quality. These observers have considered a relation of implication between comfort and quality: a high discomfort leads to a low quality video, but the reverse was not neces-sarily true: low quality video could be due to degradations that are not related with discomfort.
After classifying the observers, an ANOVA with group member-ship as fixed factor showed that observers did not use the quality scale differently, but did so for visual discomfort.
Fig. 8 depicts the average rating of visual discomfort as a function of the HRCs. Since the observers rated discomfort differently, the following analysis is performed by group. To create these classes we determined for each observer the correlation between their quality and visual discomfort ratings. Then, a k-means analysis of these correlation values was performed and divides the observers into the ones who have clearly related visual discomfort and quality (class with R between 0.63 and 0.92 with an average of 0.74) and the ones who do not (R between 0.13 and 0.51 with an average of 0.33).
From the two curves we can see that observers who have not
0 5 10 15 20 25 0 0.5 1 1.5 2 2.5 3 3.5 4 4.5 5 HRC Visual discomfort
Visual discomfort per HRC. Blue (Triangle): Class R = 0.32701
Red (Circle): Class R = 0.74214
Figure 8. Visual discomfort in function of the HRCs for the two classes
of observers: the ones with low correlation between quality and discomfort and the one with high correlation between quality and discomfort
necessarily linked quality and discomfort gave more constant rating of visual discomfort than the other class of observers. However, also some of the 2D sequences were rated as uncomfortable by these users, which is an unexpected behaviour.
When comparing the results with the L1 and L2 tests, it can be stated that there, too, a high variation of discomfort ratings could be observed, although discomfort was rated relative to the 2D version. Hence, the tests underline the difficulty of judging discomfort of 3D video.
IV. TRANSMISSION IMPAIRMENTS
Another important aspect of the experiment presented in this paper was to evaluate the effect of packet loss on the perceived quality of 3D videos. The goal of this test is to evaluate how common 2D error concealment strategies perform in case of 3D video, and to compare the quality of 2D and 3D video under packet loss. The evaluation of 3D vs 2D is particularly interesting, since in the 3D case two contradicting factors are involved:
1) The binocular suppression theory, which says that if one of the two stereoscopic views has distortions, then the resulting quality can be high, since the quality mainly depends on the best of the two views or at least on the average of the quality levels related with each individual view.
2) The binocular rivalries (when one of the two eyes perceives strong artefacts) which induces visual discomfort,affecting the general quality of experience.
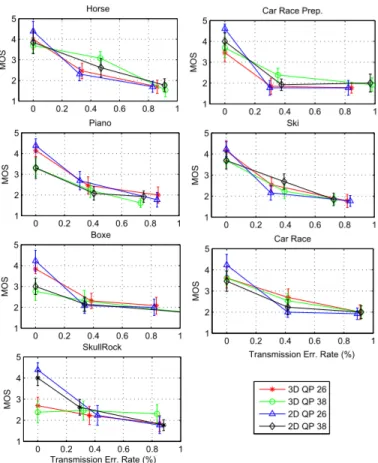
Hence, the test aimed. Fig. 9, depicts for every SRC, the quality as a function of the error rate. As we can see from the graphs, no significant difference could be found between the 2D and 3D conditions. Hence, it seems that for this type of degradation, binocular rivalries have the most important effect on the quality ratings.
These results seem to be confirmed by the visual discomfort ratings. Fig. 8, shows for the second group of observers (the ones with a high correlation between quality and visual discomfort), a significant impact of transmission error on the visual discomfort.
0 0.2 0.4 0.6 0.8 1 1 2 3 4 5 MOS Horse 0 0.2 0.4 0.6 0.8 1 1 2 3 4 5 MOS
Car Race Prep.
0 0.2 0.4 0.6 0.8 1 1 2 3 4 5 MOS Car Race 0 0.2 0.4 0.6 0.8 1 1 2 3 4 5 MOS Piano 0 0.2 0.4 0.6 0.8 1 1 2 3 4 5 MOS Ski 0 0.2 0.4 0.6 0.8 1 1 2 3 4 5
Transmission Err. Rate (%)
MOS SkullRock 0 0.2 0.4 0.6 0.8 1 1 2 3 4 5
Transmission Err. Rate (%)
MOS Boxe 3D QP 26 3D QP 38 2D QP 26 2D QP 38
Figure 9. Quality per content in function of the percentage of dropped
packets
V. CONCLUSION
In this paper we have evaluated the perceived quality of a current implementation of 3DTV broadcasting, and have compared its efficiency with some of the more state-of-the-art algorithms. At this point, the current implementation using a side by side representation with frame packing seems to be the most efficient way to transmit HD stereoscopic 3D videos, with less bandwidth requirements than Simulcast and MVC using full resolution. These results were in accordance with the results reported in previous studies. The paper further shows that visual discomfort is not a clear concept for the observers. While some of them make a clear link between quality and visual discomfort, other seem to relate visual discomfort more with content-related features. A solution for further visual discomfort evaluation requires to better illustrate the concept of discomfort to the test subjects, for example using an appropriate training session with differently comfortable contents, using, for example, the disparities between the views as criterion for content selection.
The last target of our experiment was to compare the quality of 2D and 3D videos in case of packet loss. In our test, we did not observe a significant quality difference between 2D and 3D at a given packet loss rate. This shows that the binocular suppression theory does not seem to hold in case of 3D sequences with transmission errors. Instead, binocular rivalry seems to explain the loss- impact on video quality. Further tests will be needed for comparing different 3D concealment algorithms described in the literature with the typical 2D-counterparts.
VI. ACKNOWLEDGMENT
The authors would like to thank Savvas Argyropoulos for his help and advices during the preparation and for providing tools and help during the analysis of the experiment. We would also like to thanks Peter List for his support and for providing the decoder used in this experiment, and also Thomas Buchholz for providing source sequences and support in setting up the test. This work was also partially supported by the COST IC1003 European Network on Quality of Experience in Multimedia Systems and Services -QUALINET (http://www.qualinet.eu/).
REFERENCES
[1] Dominik Strohmeier, Satu Jumisko-Pyykk¨o et al., “Results of quality attributes of coding, transmission, and their combina-tions,” MOBILE3DTV, Tech. Rep., 2010.
[2] Kun Wang, Marcus Barkowsky et al., “Subjective evaluation of HDTV stereoscopic videos in IPTV scenarios using abso-lute category rating,” EI2011, 2011.
[3] Lew Stelmach, Wa James Tam et al., “Stereo Image Quality: Effects of Mixed Spatio-Temporal Resolution,” Transactions Letters, 2000.
[4] Marcus Barkowsky, Kun Wang et al., “Subjective quality assessment of error concealment strategies for 3DTV in presence of asymmetric transmission errors,” in Packet Video Workshop, 2010.
[5] ITU-R BT.500-12, “Methodology for the subjective assess-ment of the quality of television pictures,” 2009.
[6] International Telecommunication Union, “Subjective video quality assessment methods for multimedia applications,” 2008.
[7] ITU-R BT.1438, “Subjective assessment of stereoscopic tele-vision pictures,” 2000.
[8] Chen Wei, Fournier J´erˆome et al, “New requirements of sub-jective video quality assessment methodologies for 3DTV,” Video Processing and Quality Metrics (VPQM), 2010. [9] Pieter J.H. Seunti¨ens, “Visual experience of 3DTV,” Ph.D.
dissertation, Eindhoven University, 2006.
[10] Dominik Strohmeier, “Open profiling of quality as a mixed method approach to study multimodal experienced quality,” In Proc. 8th European Conference on Interactive TV and Video EuroITV, 2010.
[11] “http://x264.nl/.”
[12] “http://sirannon.atlantis.ugent.be/.”
[13] Manuel Werlberger Thomas Pock and Horst Bischof., “Mo-tion Estima“Mo-tion with Non-Local Total Varia“Mo-tion Regulariza-tion,” IEEE Conference on Computer Vision and Pattern Recognition (CVPR), San Francisco, CA, USA, 2010.
![Figure 1. Encoding of the SRC using different coding schemes HRC Coding Scheme QP Packet loss rate [%]](https://thumb-eu.123doks.com/thumbv2/123doknet/8226753.276612/3.918.502.806.103.531/figure-encoding-different-coding-schemes-coding-scheme-packet.webp)