HAL Id: cea-03184967
https://hal-cea.archives-ouvertes.fr/cea-03184967
Submitted on 30 Mar 2021HAL is a multi-disciplinary open access archive for the deposit and dissemination of sci-entific research documents, whether they are pub-lished or not. The documents may come from teaching and research institutions in France or abroad, or from public or private research centers.
L’archive ouverte pluridisciplinaire HAL, est destinée au dépôt et à la diffusion de documents scientifiques de niveau recherche, publiés ou non, émanant des établissements d’enseignement et de recherche français ou étrangers, des laboratoires publics ou privés.
Reaction Mechanisms of Fluoroethylene Carbonate
Degradation, an Additive of Lithium-Ion Batteries,
Unraveled by Radiation Chemistry
Marin Puget, Viacheslav Shcherbakov, Sergey Denisov, Philippe Moreau,
Jean-Pierre Dognon, Mehran Mostafavi, Sophie Le Caër
To cite this version:
Marin Puget, Viacheslav Shcherbakov, Sergey Denisov, Philippe Moreau, Jean-Pierre Dognon, et al.. Reaction Mechanisms of Fluoroethylene Carbonate Degradation, an Additive of Lithium-Ion Batteries, Unraveled by Radiation Chemistry. Chemistry - A European Journal, Wiley-VCH Verlag, In press, 27 (31), pp.8185-8194. �10.1002/chem.202100562�. �cea-03184967�
1
Reaction Mechanisms of Fluoroethylene Carbonate Degradation, an
Additive of Lithium-Ion Batteries, Unraveled by Radiation Chemistry
Marin Puget,a Viacheslav Shcherbakov,b Sergey Denisov,b Philippe Moreau,c Jean-Pierre
Dognon,a Mehran Mostafavib and Sophie Le Caëra*
a NIMBE, UMR 3685 CEA, CNRS, Université Paris-Saclay, CEA Saclay F-91191 Gif-sur-Yvette Cedex, France.
b Institut de Chimie-Physique/ELYSE, UMR 8000 CNRS/Université Paris Saclay, F-91405 Orsay Cedex, France.
c Université de Nantes, CNRS, Institut des Matériaux Jean Rouxel, IMN, F-44000 Nantes, France
*email: sophie.le-caer@cea.fr
Abstract
Numerous additives are used in electrolytes of lithium-ion batteries, especially for the formation of efficient solid electrolyte interphase at the surface of the electrodes. The understanding of the degradation processes of these compounds is thus important. They can be obtained through radiolysis. In the case of fluoroethylene carbonate (FEC), picosecond pulse radiolysis experiments evidenced the formation of FEC●-. This radical is stabilized in neat FEC, whereas the ring opens to form more stable radical anions when FEC is a solute in other solvents, as confirmed by quantum chemistry calculations. In neat FEC, pre-solvated electrons primarily undergo attachment compared to solvation. At long timescales, produced gases (H2, CO, and CO2) were quantified. A reaction scheme for both the oxidizing and reducing pathways at stake in irradiated FEC was proposed. This work evidences that the nature of the primary species formed in FEC depends on the amount of FEC in the solution.
2
Introduction
The successful implementation of intermittent renewable energies is crucial for the energy transition. It is strongly linked to the capacity to store electricity with reliable, high performance, and robust storage technologies. Among them, Lithium-ion batteries (LIBs) appear as particularly interesting.[1-2]
LIB electrolytes are typically composed of a mixture of linear and cyclic carbonates.[3] The
cyclic carbonate is ethylene carbonate in conventional LIBs.[3] The combination of several
solvents was generally required to adjust the physicochemical and electrochemical properties of the electrolyte (adequate viscosity, good dielectric constant, good chemical and electrochemical stability). However, recent results have evidenced that ethylene carbonate-free electrolytes have very interesting performance and are able to work under high voltage conditions.[4-5] These different solvents also tend to facilitate the formation of a layer, the
so-called solid electrolyte interphase (SEI), whose role is to create a kinetic barrier between the electrolyte molecules and the surface of the electrodes by blocking electron transfer processes,[6] thus avoiding further degradation of the electrolyte, while allowing the Li+
transport from one electrode to the other or within the active material.[7-8] In the case of silicon
anode materials, which are very appealing in terms of gravimetric capacity that can be stored by the device, the SEI formed on the surface of the electrode is not stable due to the large volume changes undergone by silicon upon lithiation/delithiation processes.[9] A way to
enhance the mechanical stability of the SEI consists of adding a compound to the electrolyte, an additive, such as fluoroethylene carbonate (FEC, see Scheme 1).[10-13] However, there is no
definitive answer on the amount of FEC to be used (from 2% to 30%)[11] or if other additives
such as vinylene carbonate (VC, see Scheme 1) could play the same role as FEC. Such uncertainty comes from the lack of access of most studies to the processes by which FEC leads to a SEI of proper composition. Therefore, the detailed understanding of the behavior of this additive upon charge/discharge cycles (electron transfer) undergone in LIBs is of crucial interest.
We have previously demonstrated that it is possible to use ionizing radiation to simulate the aging of the battery in a reduced time.[14-16] This approach entails benefits. Indeed, it is much
faster than conventional aging methods, which require many charge/discharge cycles. A few hours are necessary in the case of radiolysis against several months or even years in the conventional method.[14-16] Moreover, radiolysis enables performing time-resolved
3
experiments, and with a high time resolution (picosecond timescale), the kinetic data on the first processes at stake in the system of interest can be obtained.[15, 17-18] Radiolysis thus
constitutes an accelerated chemical approach to fundamentally study the behavior of different electrolytes or the different solvents that constitute electrolytes. It can provide information on the behavior of FEC whose reaction mechanisms in the batteries are debated in the literature.[11, 19-21]
In a pioneering work investigating the specificities of the FEC additive, Shkrob et al.[22]
showed that FEC could undergo defluorination, inducing a radical polymerization by cross-linking. This 3D polymer network creates a good SEI because of the elastomeric properties of the polymer chains that can bear stresses caused by the cycling of the battery. In another study, it was demonstrated that the FEC•- radical anion is formed upon radiolysis, but its
precursors were not clearly identified.[23] Bearing this in mind, the goals of the present paper
are: i) to identify the species formed at the early times in irradiated FEC, ii) to describe in details the processes at stake in FEC upon radiolysis and iii) to identify the influence of solvents such as diethyl carbonate (DEC, see Scheme 1) on the FEC radiolysis, in order to mimick the reactions taking place in LIBs.
Scheme 1. Molecules of interest in the present study: fluoroethylene carbonate (FEC),
propylene carbonate (PC), vinylene carbonate (VC), and diethyl carbonate (DEC).
Results and discussion
Pulse radiolysis experiments
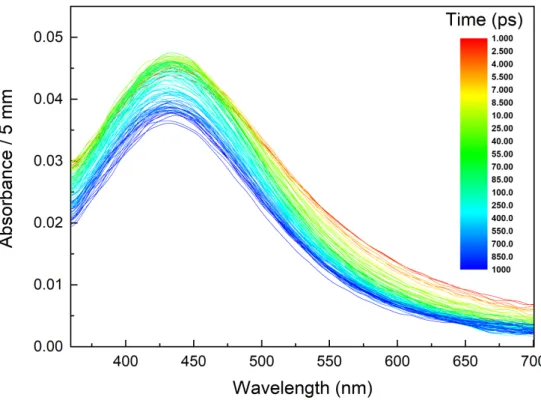
Pulse radiolysis experiments were performed on FEC to understand the first steps of the ionizing radiation/matter interaction. Figure 1 displays the spectra recorded in the 360-700 nm spectral range after the FEC irradiation during the first ns after the electron pulse. Two components are clearly seen in this figure: the maximum of the major is located at 430 nm while the other appears as a shoulder. Its maximum ranges between 500 and 600 nm. This
O O F O FEC O O O PC O O O DEC O O O VC
4
latter component disappears quickly (Figure 1). The decomposition of the spectro-kinetic data is given in Figures 2a and 2b.
Figure 1. Evolution of the spectra recorded in neat FEC during the first ns after the electron
pulse. The color bar indicates the times, expressed in ps, at which the spectra are recorded. The dose is 105 Gy.
We performed pulse radiolysis experiments in presence of AgClO4 (see Supporting
Information SI-2). These experiments proved that the species whose absorption maximum is at 430 nm (Figure 2a) is negatively charged, is reducing (as it can reduce Ag+) and is not the
solvated electron: therefore, it is attributed to the formation of the FEC•- radical anion, in
agreement with a previous study.[23] Note that in the case of PC, the maximum of the
spectrum of the PC•- was reported to be located below 280 nm.[24] The other species formed
within the pulse and whose decay lasts roughly 100 ps (Figure 2b), is characterized by a maximum located at 560 nm (Figure 2a). According to Freeman,[25] the position of the
maximum of the solvated electron band (expressed in eV) increases with ε×d×g3K× αP, with ε
the static dielectric constant, d (the density of the liquid, gK the Kirkwood parameter and αP
the polarizability (7 Å3 here). The Kirkwood parameter is linked to the correlation of
5
experimental value is not available in the literature. However, it can be calculated using the data given in the experimental section and considering that the dielectric constant of FEC is 110, as reported experimentally.[27] The value of the Kirkwood parameter is then calculated to
be 4.1. The high value of the ε×d×g3K× αP product (7 × 10-20 g) corresponds to a solvated
electron band located in the visible, below 620 nm according to the correlation between the position of the band and the ε×d×g3K× αP product.[25] We thus assume here that the transient
band detected at 560 nm is assigned to the electron solvated in FEC. This is confirmed by the kinetics (Figure 2b), which shows that the decay of the species absorbing around 560 nm is correlated to the increase of the signal of the FEC●- radical. The solvated electron decays very
fast, and vanishes in less than 100 ps. This is the reason why it was not previously detected.[23]
Figure 2. (a) Decomposition of the time-dependent spectra (presented in Figure 1) reveals
two species; (b) The corresponding kinetics within the first ns. The black squares (resp. red circles) correspond to the species whose maximum is centered at 430 nm (resp. 560 nm).
Upon irradiation, the primary effects of ionizing radiation consist of the excitation and ionization of the molecule:
FEC → FEC∗, FEC"•, e# (R1)
The pre-solvated electron can then be solvated: e#+ FEC → e
$%&
# (R2)
The precursor of the FEC•- radical anion can be either the pre-solvated or the solvated
electron. We assign the short-lived species absorbing at 560 nm (Figures 2a-2b) to the solvated electron in FEC formed thanks to reaction (R2). As in the case of propylene
6
carbonate (PC),[17] the low absorbance values measured for the solvated electron imply that at
time scales shorter than that available in the present work, the major part of pre-solvated electrons leads to the formation of FEC•- radical anions (R3) and that only a minor part form
solvated electrons.
e#+ FEC → FEC•# (R3)
In the competition between solvation (R2) and attachment to the solvent molecule (R3) of the pre-solvated electron, (R3) is then the major channel.
The decay kinetics of the solvated electron obeys a pseudo first-order kinetics (Figure 2b, and Supporting Information SI-3). This decay is attributed to reaction (R4):
e$%&# + FEC → FEC•# (R4),
with the following rate constant: k4 = 3.5 × 10⁹ mol-1.L.s-1
FEC•- radical anions are thus formed following two paths: firstly, directly within the electron
pulse by the reaction of FEC with pre-solvated electrons and second by solvated electrons. From the absorbance values, we can conclude that reactions (R3) and (R4) represent roughly 90% and 10% of the FEC•- formation, respectively. In the competition between solvation and
attachment of the electron in presence of FEC, attachment is thus the preponderant channel. Since the viscosity of FEC is around 4 mPa.s at room temperature,[27] the diffusion-limited
rate constant in FEC is around 1.7 × 10¹⁰ mol-1.L.s-1. The k
4 value is thus lower than the value
for a diffusion-limited process.
Assuming that the radiolytic yield of FEC•- is equal to 4 × 10⁻⁷ mol.J-1 at 20 ps (see below),
we get from Figure 1 an estimate of the value of the molar absorption coefficient of the radical anion: 2200 mol-1.L.cm-1 at 430 nm.
In neat FEC, another species absorbing in the near-infrared spectral range is formed within the electron pulse. This species may be the FEC•+ radical cation. The corresponding data are
provided in the Supporting Information SI-4, SI-5, and SI-6.
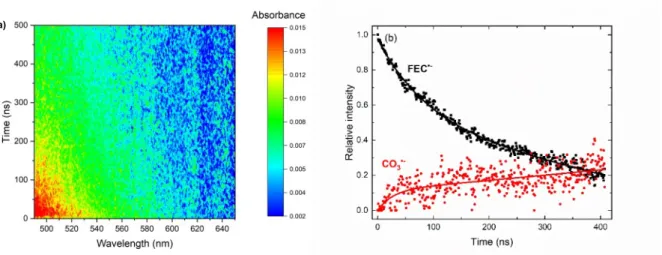
On a longer timescale, available thanks to the streak camera, data were recorded in the 490-700 nm spectral range (Figure 3a). The FEC•- species decays within few hundreds of
7
the signals recorded above 560 nm are weak, multi-species decomposition evidences that the signal due to FEC•- decays with time while that due to the species absorbing at 600 nm
increases concomitantly. It may be assigned to the weak formation of the carbonate radical anion (Figure 3b). Indeed, the CO3•- anion radical exhibits a spectral signature whose
maximum is around 600 nm and whose molar absorption coefficient at the maximum is equal to 1860 mol-1.L.cm-1.[28]
Reference[23] suggests the formation of carbonate anion radicals in low quantities (around 10-8
mol.J-1) from the FEC•- radical anion according to reaction (R5):
FEC•#→ CO ' •#+ C
(H'F (R5)
From the estimate of the absorbance measured at 600 nm 200 ns after the electron pulse (0.002 in a 5 mm optical path cell), we get an approximate radiolytic yield ca. 2 × 10⁻⁸ mol.J-1
for the carbonate radical anion. This value is consistent with previous estimations (ca. 10-8
mol.J-1).[23]
Figure 3. (a) Data spectro-kinetic matrix. (b) Decomposition of the transients measured in the
490-700 nm spectral range by two species: one is FEC•- (black squares) and the other is CO3•-
(red circles). The lines guide the eyes.
Pulse-radiolysis experiments were also performed by solubilizing FEC in another solvent (ethanol or diethyl carbonate labeled as DEC). The choice of DEC was motivated by the fact that it is commonly used as a co-solvent in electrolytes of lithium-ion batteries.[14-15]
Moreover, its behavior under radiolysis is well known.[14-15, 29]
8
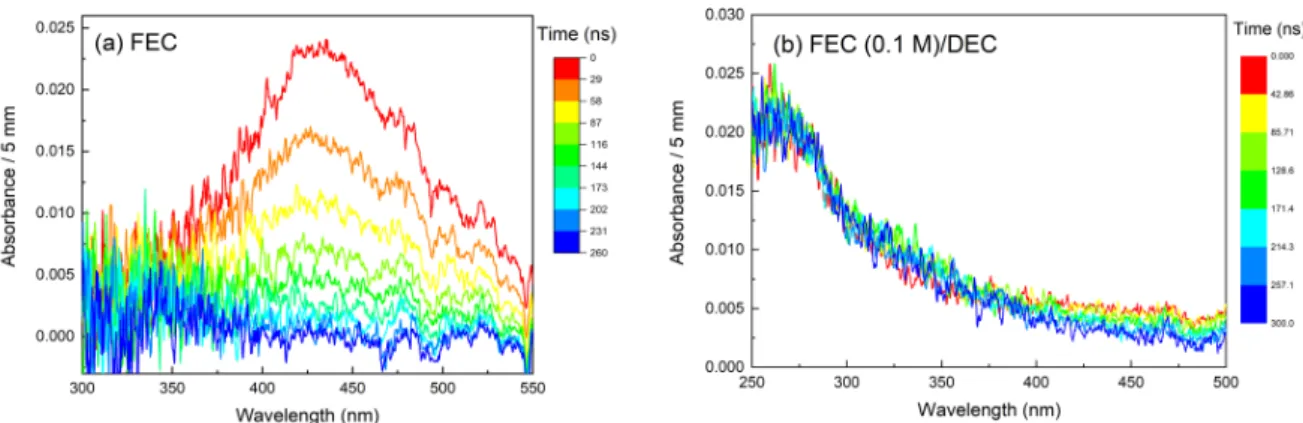
When FEC is a solute in DEC, the band at 430 nm observed in neat FEC is no longer present (see the differences between Figures 4a and 4b) while absorption is detected in the UV range. In DEC, the solvated electron absorption was observed in the near infrared spectral range due to a low static dielectric constant (εs = 2.82)[29] of diethyl carbonate. The maximum of the
band is located beyond the detection limit of 1400 nm.[29] Noteworthily, radical anions are
generated in irradiated cyclic carbonates such as propylene carbonate,[17] ethylene
carbonate,[18] and fluoroethylene carbonate in the present study, whereas only solvated
electrons are formed in linear carbonates such as diethylcarbonate[15, 29] upon irradiation. The
data corresponding to the detection of the solvated electron in the DEC solution containing FEC are provided in Supporting Information SI-7. These results evidence that the solvated electron in DEC reacts with FEC with a rate constant equal to 4.7 × 10⁹ mol-1.L.s-1. Similar
results were obtained in ethanol, a protic solvent (see Supporting Information SI-8), but also in acetonitrile or N,N-dimethylformamide, which are polar and aprotic solvents (Supporting Information SI-9).
Figure 4. Evolution of the spectra recorded in neat FEC (a) and in FEC (0.1 M) diluted in
DEC (b) on a timescale of 350 ns after the electron pulse. Below 350 nm, the signal in neat FEC is very noisy due to the absorption of FEC (see Supporting Information SI-1). The color bar indicates the times, expressed in ns, at which the spectra are recorded. The dose is 105 Gy.
These results show that the species formed in neat FEC just after the electron pulse and that formed after reaction of the solvated electron in ethanol or DEC are not the same. In FEC, these experimental observations may be due to the specific organization of FEC solvent molecules around FEC●-. The multi-species decomposition of the time-resolved spectra
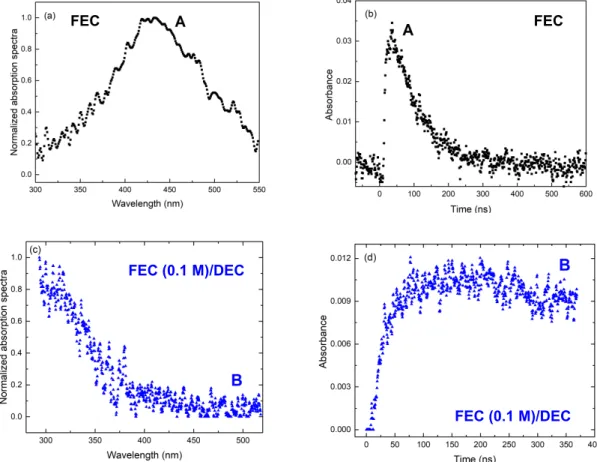
measured in the UV-visible spectral range in neat FEC evidence that only one species is detected between 300 and 550 nm (Figure 5a), assigned to the FEC●- radical anion. The decay
9
rate constant is found to be 1.2 × 10⁷ s-1. The solvated electron in other solvents than FEC
leads to other radical anions, absorbing in another spectral range than the visible one investigated so far (Figures 5c-d). In the DEC solution containing FEC, only one species is observed (Figure 5c), which absorbs in the UV range. Note that in this case, the absorption of the solvated electron in DEC is out of the detection window displayed in Figure 5c (Supporting Information SI-7). However, the solvated electron in DEC reacts with FEC (Supporting Information SI-7). The absorbance of the species in the UV range mainly increases during the first tens of ns. It decreases then slightly (Figure 5d). Note that the same signal in the UV range was reported in the picosecond pulse radiolysis of diethyl carbonate, with similar kinetic behavior.[29] We thus assign species "B" (Figures 5c-5d) to the DEC(+H)●
radical, as was proposed in reference[29].
Figure 5. Top. (a) Decomposition of the spectra and (b) corresponding kinetics in the
UV-visible spectral range measured in neat FEC (obtained from Figure 4a). Bottom (c) Decomposition of the spectra and (d) corresponding kinetics in the UV-visible spectral range measured in FEC (0.1 M)/DEC solution (obtained from Figure 4b).
The data were recorded with the streak camera in the 300-550 nm spectral region after the electron pulse. The dose is 116 Gy.
FEC
FEC (0.1 M)/DEC
FEC (0.1 M)/DEC FEC
10
In order to better understand the formation of transient species, theoretical chemistry calculations were carried out.
Theoretical chemistry calculations
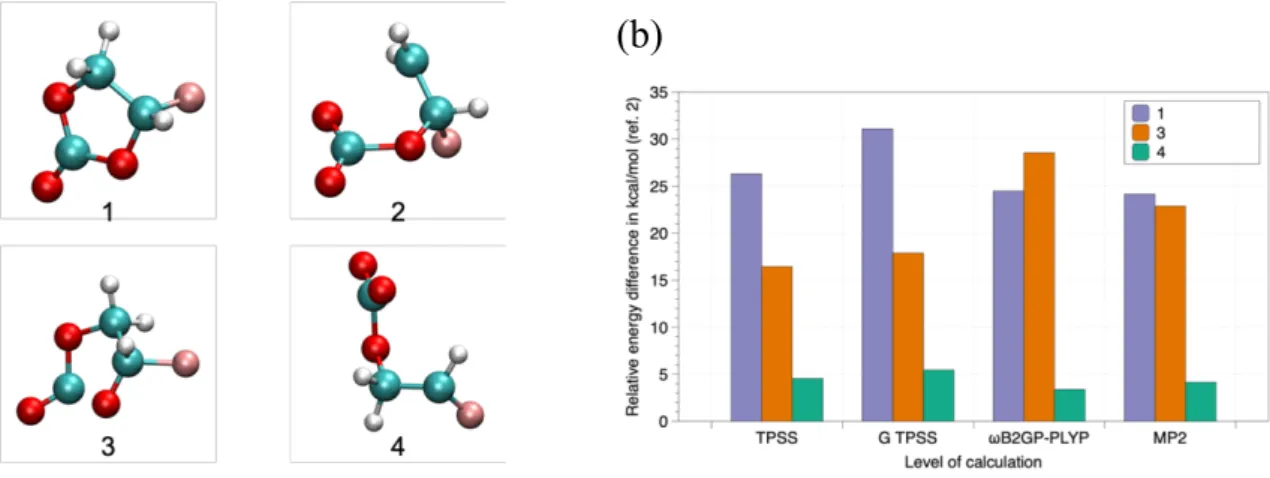
We investigated the electronic structure and spectroscopic properties of various fluorinated carbonate radical anions, with the cyclic ring (FEC●-, structure 1) or after the ring cleavage
(structures 2-4) (see Figure 6a). Figure 6a shows the optimized geometry for the ground state of the isolated radical anions. The most stable structure was calculated to be structure 2, i.e., obtained after the ring cleavage. The electronic and Gibbs free energies calculated at various levels of theory are reported in Figure 6b with respect to structure 2. Figure 6b illustrates the behavior of different classes of functionals for the various radical anions. These results are consistent with a preceding study.[30]
Figure 6. (a) DFT/TPSS-D3(BJ) optimized geometry for the ground state of the isolated
radical anions.(b) Relative energies for 1, 3 and 4 radical anions with reference to 2. For Gibbs free energies, the temperature is 298.15 K.
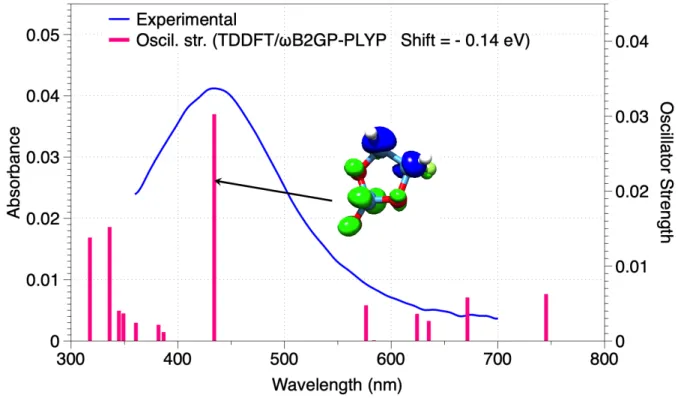
The calculated absorption spectra of the different species are shown in Figure SI-10 and SI-11 in the Supporting Information. Only the cyclic FEC radical anion (species 1) is able to reproduce the experimental absorption spectra near 430 nm (see Figure 7). Species 2-4 absorb in the UV range and not in the visible range (Figure SI-11). Note that the experimental region near 300 nm is delicate and experimentally noisy due to FEC absorption.
11
Figure 7. Comparison of the experimental (from Figure 1) and computed (DFT/ wB2GP-PLYP) spectra of the cyclic FEC radical anion (species 1 in Figure 6a). Calculated oscillator strengths are represented by bars. The predicted spectrum is "shifted" by -0.14 eV. Analysis of the intrinsic characteristics of electron excitation for the 430 nm band is also shown from the distribution of hole and electron. Blue and green isosurfaces (0.001) represent hole and electron distributions, respectively.
The origin of the 430 nm absorption band can be investigated by analyzing the intrinsic characteristics of electron excitation from the distribution of hole and electron. The electronic transitions involve the excitation of an electron from C orbitals to orbitals located at the carbonate group (see Figure 7). The Δr index is a quantitative indicator for measuring the charge transfer (CT) length of electron excitation. The 430 nm band should be basically regarded as a CT excitation owing to a Δr index equal to 2.55 Å (C. A. Guido et al. suggest using 2.0 Å as a criterion for distinguishing between short and long range excitations[31]).
For the other compounds 2-4, this electron transfer is not possible, and the absorption occurs at shorter wavelengths. This set of results reinforces the experimental hypotheses despite the lower stability of the cyclic compound in the gas phase (Figure 6b). The role of the FEC solvent is at the origin of the stabilization of the electronic structure of the cyclic radical anion observed experimentally.
12
Production of stable molecules upon irradiation and reaction mechanisms
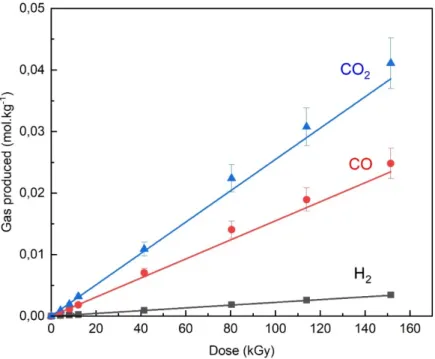
To determine degradation processes in fluoroethylene carbonate, the main gaseous species produced upon irradiation of FEC were identified and quantified. They consist of CO, CO2,
and H2 to a lesser extent. The amount of these gaseous molecules (normalized to the sample
mass) varies linearly with the dose (Figure 8). From the slope of the lines, we measured the radiolytic yields, expressed in mol.J-1 (Figure 8). The radiolytic yields of CO
2, CO and H2 are
equal to (2.5 ± 0.2) × 10-7 mol.J-1; (1.5 ± 0.1) × 10-7 mol.J-1 and (2.2 ± 0.2) × 10-8 mol.J-1,
respectively. The main gases produced in FEC are CO and CO2, as in the cyclical carbonate
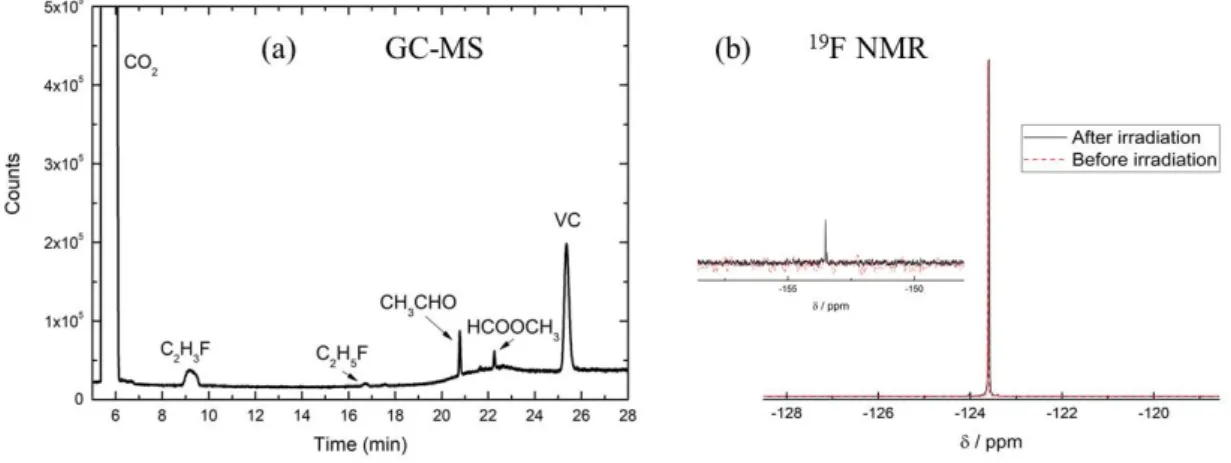
PC.[16] From gas chromatography coupled to mass spectrometry experiments (GC-MS), other
stable molecules formed after an irradiation of 17 kGy were identified (Figure 9a): C2H3F,
Si(CH3)2F2, HCOOCH3 and VC (see Scheme 1). Si(CH3)2F2 results from the reaction of the
column of the chromatography with HF.
Figure 8. Evolution of various gas produced upon irradiation of neat FEC with 10 MeV
electrons as a function of the dose as measured by gas chromatography. The points correspond to experimental data.
To analyze the evolution of FEC degradation during irradiation, 19F and 1H NMR experiments
were also carried out. The 1H NMR spectra before and after irradiation did not highlight any
13
peak at -123.6 ppm corresponding to the F atom of the FEC molecule (Figure 9b). This signal does not change upon irradiation, but a new peak appears around -153.5 ppm. This new singlet has been attributed to the formation of an HF molecule.[15] Besides, no F- anion could
be seen because its signal in pure FEC is mingled with the F atom of FEC as shown by measurements performed with LiF diluted in pure FEC.
Figure 9. (a) GC-MS spectrum of FEC irradiated at a dose of 17 kGy. (b) 19F NMR spectra of
FEC before (dotted, red) and after (solid, black) irradiation at 200 kGy. The inset represents a zoom on the singlet around -153.5 ppm.
The following reaction scheme can be deduced from all the experimental observations given above (Scheme 2). The first step corresponds to reaction (R1). Besides ionization, excited molecules are also formed. They can then deactivate or dissociate, leading to the formation of small molecules and to radicals. As FEC is a very polar solvent, excitation is then a minor channel and can be neglected. In polar solvents, the radiolytic yield of the reduced or of the oxidized species at a few tens of picoseconds is generally about 4 × 10⁻⁷ mol.J-1.[24]
Concerning the oxidation pathway, the FEC(-H)● radical is formed after rapid proton transfer
from the solvent molecule to the radical cation generated upon ionizing radiation (Scheme 2). The release of CO2 together with ●CH2COF from the FEC(-H)● radical was calculated to be
exergonic.[23] It was also suggested that ●CH2COF can initiate chain reaction, but we have no
evidence of this process here.[23] Carbon dioxide can also be formed in the reduction channel,
which is more complex than the oxidative channel. DFT Calculations have evidenced that the FEC●- radical anion will decompose, leading to the release of a fluoride anion followed by
CO2 production and by the formation of the ●CH2CHO (vinoxyl) radical.[32] We can assume
14
work, suggesting that this channel is minor. Other calculations of the reduction decomposition pathways of FEC, performed on the FEC-Na+ complex, have evidenced that these
decomposition pathways are multi-step ones, and that both CO2 and CO release are exergonic
processes, the CO2 release being thermodynamically more favorable.[33] Carbon monoxide is
then formed via the reduction channel only, whereas the formation of carbon dioxide can arise both from oxidation and reduction pathways. Noteworthily, it is mainly formed in the oxidation pathway. When FEC is diluted in another solvent, then the ring is directly clef upon electron attachment and species such as 2-4 can be formed (see the corresponding spectra in Figure SI-11). The most stable ones have spectral features below 300 nm. They can thus not be observed experimentally. Noteworthily, the FEC●- species was never observed when FEC
was diluted in other solvent, no matter its characteristics (polar or not, protic or not….) (Figures 4-5, Figures SI-7, SI-8 and SI-9) and even when FEC was at a few decimolar concentration. This, together with quantum chemistry calculations, suggests that several FEC molecules are required to stabilize FEC●-.
Dihydrogen is formed in low quantity. A proposed precursor is the FEC(+H)● species
(Scheme 2). Note that H2 molecules may also arise from the dissociation of excited FEC
molecules.
In the LIBs research field, most studies on FEC are focused on its influence on the formation and composition of the SEI, which prevents a detailed comparison with the present results. Nevertheless, the oxidative decomposition mechansisms of FEC were investigated in the case of LIBs working at a high voltage.[34] The authors have shown that the main decomposition
pathway of the FEC•+ radical cation consists in the formation of CO2 and of the
2-fluoroacetaldehyde radical cation, which is consistent with our findings. In an other work, the FEC reduction products were proposed.[35] The obtained results suggested a mechanism where
FEC reduces to form LiF and VC, followed by subsequent VC reduction. CO and CO2 were
detected in the gas phase, CO2 being the major product. HCO2Li, Li2C2O4, and Li2CO3 were
also found in small quantities and were due to the reduction of CO2.[35] Even if the
experiments are different, radiolysis can thus provide valuable insights into the processes occuring in FEC under aging.
15
Scheme 2. Proposed reactions taking place in irradiated FEC. I.R. stands for "Ionizing
Radiation". The gases measured by gas chromatography are indicated with a pink color, while the species detected by GC-MS are indicated with a green color. The arrow with the dotted line corresponds to a minor channel. The values given into brackets are radiolytic yields. They are expressed in 10-7 mol.J-1. The CO
2 radiolytic yield is equal to 2.5 × 10⁻⁷ mol.J-1, and the
H2 radiolytic yield is equal to 2.2 × 10⁻⁸ mol.J-1. Concerning the fate of FEC*, we limit
ourselves to the generation of a hydrogen atom, which is the most favorable process. The measured rate constants are given in the text.
Conclusions
We have previously shown that it is possible to simulate the accelerated aging of electrolytes using radiolysis. In the present work, the degradation mechanisms of an additive, fluoroethylene carbonate, were studied. The first steps of the radiation/matter interaction were followed by pulse radiolysis at the picosecond timescale. These observations were complemented by analytical techniques providing information on the nature of the degradation products and giving access to the radiolytic yields of the main gases produced upon irradiation.
Picosecond pulse radiolysis experiments have evidenced the presence of two species whose absorption band maxima were located at 430 nm and 560 nm, attributed to the FEC●- radical
anion and the solvated electron, respectively. The signal of the solvated electron is low and
e-(4.0) FEC●-(4.0) e -solv(0.8) ≈ 90% ≈ 10% CO3●-(0.2) + C 2H3F CO2(min.)+ F-+ ●CH2CHO ●COOCH 3+CO(1.5)+ F -CH3CHO+ FEC(-H)● HCOOCH3+ FEC(-H)● FEC FEC+●+ FEC FECH+ + FEC(-H)● FEC(+H)●+ FEC FEC(-H)●+ FEC + H 2 2 FEC(+H)● H2+2 FEC VC+ F● CO 2(maj.)+ ●CH2COF Oxidation Reduction
From both channels and from excited state FEC●-+ FECH+
FEC
FEC Ionizing Radiation FEC*, FEC+●, e
-FEC* FEC FEC(-H)● + H● 2H● H 2
16
disappears in ca. 100 ps. The same measurements were carried out by diluting the FEC in diethylcarbonate and ethanol solutions. In these cases, the absorption band centered at 430 nm is no longer observed while the solvated electron is detected, that reacts with FEC. These experimental results strongly suggest that the FEC●- radical is stabilized when surrounded by
FEC molecules, which is also corroborated by theoretical chemistry calculations. When FEC is solubilized in other solvents, the cycle of FEC molecules is cleft upon reaction with the solvated electron, leading to linear species, which are more stable. This result evidences that the nature of the primary species formed in FEC depends on the amount of FEC in the electrolyte, i.e. if it is a solute or a co-solvent, which has strong implications for reaction mechanisms taking place in the electrolytes of lithium-ion batteries. The measurements performed on neat FEC prove that the attachment of the electron to FEC is preferred to solvation. The oxidation and reduction reaction mechanisms were identified, leading to the formation of various compounds and gases, CO and CO2 being the major ones.
The use of pulse radiolysis provides information on the first stages of degradation of fluoroethylene carbonate. Additional physico-chemical analysis techniques such as GC-MS or NMR enable identifying the nature of the degradation products and even quantifying them. This approach can be extended to other additives of interest for electrolytes. It allows the fast identification of the degradation processes of the electrolytes used in lithium-ion batteries and is a real complementary technique to the traditional methods currently in use. Lastly, our measurements indicate that VC is formed upon degradation of FEC. Work is currently under progress to understand reaction mechanisms induced by irradiation in VC and also the differences in the behavior of FEC and VC upon ionizing radiation.
Methods
Experimental section
Chemicals
Fluoroethylene carbonate (FEC) was purchased from Solvionic. Diethyl carbonate (DEC) and ethanol (≥ 99.8%) were purchased from Sigma Aldrich. They were used without further purification. Fluoroethylene carbonate is a transparent liquid that does not absorb significantly
17
in our spectral range of interest (300-1500 nm; see the spectra in the 200-3000 nm spectral range, Figure SI-1). Its melting point is around 293 K. The FEC molecular weight is 106.05 g.mol-1, and its mass density at 298 K is 1.410 g.cm-3 (neat FEC thus corresponds to 13.3
mol.L-1).[36] The FEC dielectric constant was experimentally determined[27] around 110 but
calculated[36] to be 91 at 298 K. Its dipole moment was calculated to be 4.67 D.[37] As in the
case of propylene carbonate (PC)[17], the high static dielectric constant may be a consequence
of the large value of the dipole moment. The dynamic viscosity of FEC is 4 mPa.s at 20°C.[38]
Picosecond pulse radiolysis experiments
To understand the phenomena occurring at early times, picosecond pulse radiolysis experiments at the laser-driven electron accelerator ELYSE were performed.[39] During these
experiments, the different samples were bubbled with argon or N2 to avoid any water uptake.
The electron pulses were delivered with a pulse duration of about 7 ps and electron energy of 7.6 MeV at a repetition rate of 5 Hz. Two experimental configurations were used depending on the investigated timescale.The transient absorbance of the samples was probed in a flow cell with 5 mm optical path collinear to the electron pulse propagation. The basic optical configuration of the first experimental configuration, a pump-probe set-up, is described in reference [39]. It allows recording signals up to 10 ns. The broadband pump-probe system was
operated in two configurations, one in the visible range using a single crystal of CaF2 for
continuum light generation, another one using a single crystal of yttrium aluminum garnet (YAG) for continuum light generation optimized in the near infrared (NIR).[40] Probe and
reference beams were coupled into an optical fiber, transmitted to an adapted spectrometer, and dispersed onto the specific line scan detectors. For the NIR measurements, a customized broadband polychromator with an InGaAs photodiode array from Hamamatsu (G11608-512DA) was used.[40] A spectral overlap of both detection configurations was achieved in the
region below the fundamental laser wavelength of 780 nm, down to 600 nm.
In the second configuration, the signals are recorded in the ns-µs time scale thanks to a streak camera and a homemade repetitive flash-lamp.[41] In a single experiment, spectra (in the
300-800 nm wavelength range) at given times and kinetics at various wavelengths are thus obtained. The absorbance values were an average of the measurements over 600-900 pulses. The precision of the measurements is about 2 mO.D (O.D. being the Optical Density).
The dose per pulse was deduced from the absorbance of the hydrated electron e-aq in water,
18
dose was derived from the solvated electron yield at 10 ps: G(e
-aq)10 ps = 4.4 ´ 10-7 mol J-1 and
from the molar absorption coefficient ε800 nm = 1.53 ´ 104 L mol-1 cm-1.[42] For the second
experimental configuration using the streak camera, the dose per pulse in water was derived from the absorbance of the hydrated electron at 600 nm and from the solvated electron yield at 3 ns, with ε600 nm(e-aq) = 1.35 × 10⁴ M−1 cm−1 and G(e-aq)3 ns = 3.45 ×10⁻⁷ mol J−1.[39] The
dose per pulse in water was found to be ca. 100 Gy (1 Gy = 1 J.kg-1) per pulse and was shown
to be very stable within the same day. In all irradiation experiments, considering the stopping powers in FEC and in water, the dose received by FEC and by water was considered the same within an error bar of 10%.
Spectro-Kinetic Data Analysis
The spectro-kinetics matrix consists of the absorbance values measured at different times and wavelengths. A wavelength-dependent baseline correction was then applied to enable multivariate curve resolution alternating least squares (MCR-ALS) analysis[43-44] by our
spectro-kinetic analysis code (SK-Ana).[45] The number of absorbing species in a global
matrix was assessed by singular value decomposition.[46] Positivity constraints were imposed
for both spectra and kinetics.
Stable species produced upon irradiation of FEC
In order to measure the gases produced upon irradiation, FEC was placed in Pyrex glass ampules under an argon atmosphere. The conditioning procedure used for the irradiation experiments and the gas analysis can be found in references.[14, 47] The samples were
irradiated thanks to a linear electron accelerator facility (10 MeV). We worked at 2 Hz frequency in order to prevent the sample from heating. The dose rate was determined by the Fricke dosimetry[48] and found to be 15 Gy.pulse-1. The main gases formed upon irradiation
(H2, CO, CO2, and CH4) were quantified by gas chromatography (µGC-R3000, SRA
Instrument) using ultrahigh purity argon as the carrier gas.[14]
Gas identification was performed by gas chromatography-mass spectrometry (GC-MS). Experiments were performed with an Agilent 6890 GC system interfaced with an Agilent 5973 MS equipped with an electron impact (EI) source, and a quadrupole mass analyzer. The mass range is 4-160. Helium is used as the vector gas with a flow rate of 2 mL min-1.
Separation is carried out by two distinct separation modes: on one hand, with a CP-PorabondQ (25 m, Æ 0.32 mm) column (Varian), and on the other hand, with a two columns
19
system connected in parallel, a molecular sieve Rt-MSieve 5Å PLOT (30 m, Æ 0.53 mm) column (Restek) and a Rt-Q-Plot (30 m, Æ 0.32 mm) column (Restek). Injector is set at 110 °C in split mode.
19F and 1H NMR experiments were performed on a 400 MHz Bruker spectrometer. Pure FEC
was directly measured without being diluted. Each sample was prepared under an argon atmosphere in a glove box, and the tubes contained 600 µL of FEC.
Computational Methods
Density functional theory (DFT) and time dependent DFT (TD-DFT) have been used to investigate the electronic structure and spectroscopic properties of fluorinated carbonate radical anions. In this framework, the fundamental challenge is to have functionals that could give a reasonable description of both the geometries and UV-Visible spectra of those molecules. TD-DFT with non-hybrid exchange-correlation functionals generally underestimate excitation energies, particularly for charge-transfer states. Excitation energies are generally improved with hybrid functionals and range-separated functionals (particularly for charge-transfer excitation) that separate the exchange term of the DFT functional into long- and short-range contributions.[49] To get spectra from calculations that can be compared
with the experiments, one step beyond is to use double-hybrid functionals. In this work, we use ωB2GP-PLYP, a double-hybrid functional with long-range correction optimized for excitation energies.[50] It provides a balanced description of local-valence, Rydberg, and
charge-transfer states. The calculations have been carried out with the ORCA 4 program.[51]
The electronic spectra and the electronic transitions were analyzed by using the Multiwfn 3.8 program.[52]
Geometry optimization
The geometries were optimized using density functional theory (DFT) with the ORCA 4 program[51] along with the resolution of identity approximation[53]. It speeds up the calculation
of the Coulomb term. The TPSS functional was considered corrected by the empirical dispersion term (D3) proposed by Grimme et al.[54] with finite damping as introduced by
Becke and Johnson (BJ-damping) to account for the London dispersion energy[55]. The
addition of the BJ-damping provides better results for non-bonded distances and more clear effects of intramolecular dispersion. The split valence plus polarization triple-ξ (def2-TZVP) basis set[56] augmented with diffuse functions was used.
20
Excited states
The theoretical electronic absorption spectra were calculated on the optimized ground-state geometry using time-dependent DFT (TD-DFT) with the ωB2GP-PLYP functional[50] and the
ORCA 4 program.[51] To get spectra from calculations that can be compared with the
experiments, we included an energy correction, and only subsequently we converted the spectra to nm. In a final step, we performed a scaling of the calculated intensities for a better similarity with experimental spectra.
Post-process, analysis, and visualization of results from ORCA
All calculations (including spectra and excited states properties) were analyzed by using Multiwfn (development version 3.8) software[52] and visualized by using the VMD 1.9.4
software[57].
Acknowledgments
The "Fondation Maison de la Chimie" is gratefully acknowledged for financial support. We also acknowledge the French EMIR&A network for the provision of irradiation beam time.
Conflict of interest
The authors declare no conflict of interest.
Keywords
density functional calculations, lithium-ion battery, radiolysis, reaction mechanisms
References
[1] J. M. Tarascon, M. Armand, Nature 2001, 414, 359-367. [2] M. T. Armand, J.-M., Nature 2008, 451, 652-657. [3] K. Xu, Chem. Rev. 2004, 104, 4303-4417.
[4] L. Ma, S. L. Glazier, R. Petibon, J. Xia, J. M. Peters, Q. Liu, J. Allen, R. N. C. Doig, J. R. Dahn, J. Electrochem. Soc. 2017, 164, A5008-A5018.
[5] S. Klein, S. van Wickeren, S. Röser, P. Bärmann, K. Borzutzki, B. Heidrich, M. Börner, M. Winter, T. Placke, J. Kasnatscheew, Adv. Energy Mater. 2021, 2003738. [6] J. Kasnatscheew, R. Wagner, M. Winter, I. Cekic-Laskovic, Top. Curr. Chem. 2018,
21 [7] K. Xu, Chem. Rev. 2014, 114, 11503-11618.
[8] J. Kasnatscheew, U. Rodehorst, B. Streipert, S. Wiemers-Meyer, R. Jakelski, R. Wagner, I. Cekic-Laskovic, M. Winter, J. Electrochem. Soc. 2016, 163, A2943-A2950.
[9] A. Wang, S. Kadam, H. Li, S. Shi, Y. Qi, npj Comput. Mater. 2018, 4, 15.
[10] Y.-M. Lin, K. C. Klavetter, P. R. Abel, N. C. Davy, J. L. Snider, A. Heller, C. B. Mullins, Chem. Comm. 2012, 48, 7268-7270.
[11] V. Etacheri, O. Haik, Y. Goffer, G. A. Roberts, I. C. Stefan, R. Fasching, D. Aurbach,
Langmuir 2012, 28, 965-976.
[12] B. T. Young, D. R. Heskett, C. C. Nguyen, M. Nie, J. C. Woicik, B. L. Lucht, ACS
Appl. Mater. Interfaces 2015, 7, 20004-20011.
[13] C. S. Bongu, S. Surblé, J. P. Alper, A. Boulineau, J.-F. Martin, A. Demarque, P.-E. Coulon, M. O. Rosso, F., S. Franger, N. Herlin-Boime, S. Le Caër, J. Phys. Chem. C
2019, 2019, 28550-28560.
[14] D. Ortiz, V. Steinmetz, D. Durand, S. Legand, V. Dauvois, P. Maître, S. Le Caër,
Nature Comm. 2015, 6, 6950.
[15] D. Ortiz, I. Jimenez Gordon, J.-P. Baltaze, O. Hernandez-Alba, S. Legand, V. Dauvois, G. Si Larbi, U. Schmidhammer, J. L. Marignier, J.-F. Martin, J. Belloni, M. Mostafavi, S. Le Caër, ChemSusChem 2015, 8, 3605-3616.
[16] D. Ortiz, I. Jimenez Gordon, S. Legand, V. Dauvois, P. Baltaze, J. L. Marignier, J.-F. Martin, J. Belloni, M. Mostafavi, S. Le Caër, J. Power Sources 2016, 326.
[17] S. Le Caër, D. Ortiz, J. L. Marignier, U. Schmidhammer, J. Belloni, M. Mostafavi, J.
Phys. Chem. Lett. 2016, 7, 186-190.
[18] F. Wang, F. Varenne, D. Ortiz, V. Pinzio, M. Mostafavi, S. Le Caër, ChemPhysChem
2017, 18, 2799-2806.
[19] M. Nie, D. P. Abraham, Y. Chen, A. Bose, B. L. Lucht, J.Phys. Chem. C 2013, 117, 13403-13412.
[20] X. Chen, X. Li, D. Mei, J. Feng, M. Y. Hu, J. Hu, M. Engelhard, J. Zheng, W. Xu, J. Xiao, J. Liu, J.-G. Zhang, ChemSusChem 2014, 7, 549-554.
[21] R. Jung, M. Metzger, D. Haering, S. Solchenbach, C. Marino, N. Tsiouvaras, C. Stinner, H. A. Gasteiger, J. Electrochem. Soc. 2016, 163, A1705-A1716.
[22] I. A. Shkrob, Y. Zhu, T. W. Marin, D. Abraham, J. Phys. Chem. C 2013, 117, 19270−19279.
[23] I. A. Shkrob, J. F. Wishart, D. P. Abraham, J. Phys. Chem. C 2015, 119, 14954-14964. [24] J. L. Marignier, F. Torche, S. Le Caër, M. Mostafavi, J. Belloni, J. Phys. Chem. B
2016, 120, 2388-2396.
[25] G. Freeman, J. Phys. Chem. 1973, 77, 7-9.
[26] G. Oster, J. G. Kirkwood, J. Chem. Phys. 1943, 11, 175-178.
[27] M. Ohtake, K. Takimoto, N. Nanbu, M. Takehara, M. Ue, Y. Sasaki, Extended
Abstract of the 214th ECS meeting 2008, Abs. No. 175.
[28] Y. Katsumura, G. Wu, M. Lin, Y. Muroya, T. Morioka, Y. Terada, X. Li, Res. Chem.
Intermed. 2001, 27, 755-763.
[29] F. Torche, A. K. El Omar, P. Babilotte, S. Sorgues, U. Schmidhammer, J.-L. Marignier, M. Mostafavi, J. Belloni, J. Phys. Chem. A 2013, 117, 10801-10810.
[30] Y. Okuno, K. Ushorogata, K. Sodeyama, Y. Tateyama, Phys. Chem. Chem. Phys.
2016, 18, 8643-8653.
[31] C. A. Guido, P. Cortona, B. Mennucci, C. Adamo, J. Chem. Theory Comput. 2013, 9, 3118-3126.
[32] K. Leung, S. B. Rempe, M. E. Foster, Y. Ma, J. M. Martinez del la Hoz, N. Sai, P. B. Balbuena, J. Electrochem. Soc. 2014, 161, A213-A221.
22
[33] H. Kumar, E. A. Detsi, D.P., V. B. Shenoy, Chem. Mater. 2016, 28, 8930-8941.
[34] L. Xia, B. Tang, L. Yao, K. Wang, A. Cheris, Y. Pan, S. Lee, Y. Xia, G. Z. Chen, Z. Liu, ChemistrySelect 2017, 2, 7353-7361.
[35] A. L. Michan, B. S. Parimalamn, M. Leskes, R. N. Kerber, T. Yoon, C. P. Grey, B. L. Lucht, Chem. Mater. 2016, 28, 8149-8159.
[36] S. Lee, S. S. Park, J. Phys. Chem. B 2011, 115, 12571–12576.
[37] A. K. Kushwaha, M. R. Sahoo, S. K. Nayak, ChemistrySelect 2019, 4, 1251-1258. [38] A. Janes, T. Thomberg, J. Eskusson, E. Lust, J. Electrochem. Soc. 2013, 160, A1025. [39] J. Belloni, H. Monard, F. Gobert, J. P. Larbre, A. Demarque, V. De Waele, I. Lampre,
J. L. Marignier, M. Mostafavi, J. C. Bourdon, M. Bernard, H. Borie, T. Garvey, B. Jacquemard, B. Leblond, P. Lepercq, M. Omeich, M. Roch, J. Rodier, R. Roux, Nucl.
Instrum. Methods Phys. Res. A 2005, 539, 527-539.
[40] U. Schmidhammer, P. Jeunesse, G. Stresing, M. Mostafavi, Appl. Spectr. 2014, 68, 1137-1147.
[41] J. L. Marignier, V. de Waele, H. Monard, F. Gobert, J. P. Larbre, A. Demarque, M. Mostafavi, J. Belloni, Rad. Phys. Chem. 2006, 75, 1024-1033.
[42] F. Wang, U. Schmidhammer, J.-P. Larbre, Z. Zong, J.-L. Marignier, M. Mostafavi,
Phys. Chem. Chem. Phys. 2018, 20, 15671-15679.
[43] R. Tauler, Chemom. Intell. Lab. Syst. 1995, 30, 133-146.
[44] C. Ruckebusch, M. Sliwa, P. Pernot, A. de Juan, R. Tauler, J. Photochem. Photobiol.
2012, 13, 1-27.
[45] P. Pernot, in https://zenodo.org/record/1120307#.X_b3ouhKi9I (Ed.: L. d. C. Physique), 2017.
[46] G. H. Golub, C. F. Van Loan, Matrix Computation, The John Hopkins University Press, London, 1989.
[47] M. Lainé, E. Balan, T. Allard, E. Paineau, P. Jeunesse, M. Mostafavi, J.-L. Robert, S. Le Caër, RSC Adv. 2017, 7, 526-534.
[48] H. Fricke, E. J. Hart, in Radiation Dosimetry, Vol. 2, Second Edition ed. (Eds.: F. H. Attix, W. C. Roesch), Academic press, New York and London, 1966, pp. 167-232. [49] T. Yanai, D. P. Yew, N. C. Handy, Chem. Phys. Lett. 2004, 393, 51-57.
[50] M. Casanova-Paez, M. B. Dardis, L. Goerigk, J. Chem. Theory Comput. 2019, 15, 4735-4744.
[51] F. Neese, WIREs Comput. Mol. Sci. 2018, 8, e1327. [52] T. Lu, F. Chen, J. Comput. Chem. 2012, 33, 580-592.
[53] O. Vahtras, J. Almlöf, M. W. Feyereisen, Chem. Phys. Lett. 1993, 213, 514-518. [54] S. Grimme, J. Antony, S. Ehrlich, H. Krieg, J. Chem. Phys. 2010, 132, 154104. [55] S. Grimme, S. Ehrlich, L. Goerigk, J. Comput. Chem. 2011, 32, 1456-1465. [56] F. Weigend, R. Ahlrichs, Phys. Chem. Chem. Phys. 2005, 7, 3297-3305. [57] W. Humphrey, A. Dalke, K. Schulten, J. Mol. Graph. 1996, 14, 33-38.
23
Table of Contents Graphic
In neat fluoroethylene carbonate, an additive commonly used in lithium-ion batteries, excess electrons formed upon radiolysis primarly undergo attachment compared to solvation. The formation of the cyclic radical anion is no longer observed when fluoroethylene carbonate is a solute in other solvents.