HAL Id: hal-01336285
https://hal.archives-ouvertes.fr/hal-01336285
Submitted on 24 Nov 2016
HAL is a multi-disciplinary open access
archive for the deposit and dissemination of
sci-entific research documents, whether they are
pub-lished or not. The documents may come from
teaching and research institutions in France or
abroad, or from public or private research centers.
L’archive ouverte pluridisciplinaire HAL, est
destinée au dépôt et à la diffusion de documents
scientifiques de niveau recherche, publiés ou non,
émanant des établissements d’enseignement et de
recherche français ou étrangers, des laboratoires
publics ou privés.
HC(NH2)2PbI3 by MD simulations and group theory
Marcelo Carignano, Y Saeed, S. Assa Aravindh, I. S. Roqan, Jacky Even,
Claudine Katan
To cite this version:
Marcelo Carignano, Y Saeed, S. Assa Aravindh, I. S. Roqan, Jacky Even, et al.. A close examination of
the structure and dynamics of HC(NH2)2PbI3 by MD simulations and group theory. Physical
Chem-istry Chemical Physics, Royal Society of ChemChem-istry, 2016, Physical chemChem-istry of hybrid perovskite
solar cells, 18 (39), pp.27109-27118. �10.1039/C6CP02917E�. �hal-01336285�
Close examination of the structure and dynamics of HC(NH
2)
2PbI
3by MD
simulations and group theory
M.A. Carignano,1, a)Y. Saeed,1S. Assa Aravindh,2 I. S. Roqan,2J. Even,3, b) and C. Katan4, c)
1)Qatar Environment and Energy Research Institute, Hamad Bin Khalifa University, Qatar Foundation,
P.O. Box 5825, Doha, Qatar
2)Physical Sciences and Engineering, King Abdullah University of Science and Technology (KAUST), Thuwal,
Saudi Arabia
3)Fonctions Optiques pour les Technologies de L’Information, FOTON UMR6082, CNRS, INSA de Rennes,
35708 Rennes, France
4)Institut des sciences chimiques de Rennes; ISCR, CNRS, Universit´e de Rennes 1, 35042, Rennes,
France
The formamidinium lead iodide hybrid perovskite is studied using first principles molecular dynamics simula-tions and further analyzed using group theory. The simulasimula-tions are performed on large supercells containing 768 atoms under isothermal and fully anisotropic isobaric conditions. Two trajectories, one at 300 K and another at 450 K, were extended for over 50 ps in order to perform a detailed assessment of the rotational dy-namic of the organic cations. The characteristic rotations of the cation are analyzed by defining two rotation axes. It is found that the formamidinium molecules rotate preferentially around the direction parallel to the line connecting the two nitrogen atoms. The rotational dynamics shows some characteristics already observed in methylammonium lead iodide, like a heterogeneous dynamic at room temperature that disappears at 450 K. The orientational probability of the molecules is explored in terms of an expansion in cubic harmonics up to the 12th order. It reveals a strong directionality at room temperature that relaxes when increasing the temperature. These findings are further rationalized using Landau and group theories suggesting a mixed displacive/order-disorder structural instability at lower temperatures.
I. INTRODUCTION
The realization a few years back of solar cells em-ploying the unconventional hybrid organic inorganic per-ovskite (HOP) as the active material and displaying high conversion efficiency triggered a tremendous devel-opment e↵ort mainly aimed to achieve a commercially viable device1–9. In spite of the always important com-mercial application, the material responsible for this re-search presents many interesting properties that repre-sent a challenge for the current state of the art in mate-rials science from experimental10–16 and theoretical17–23 points of view. In both cases, the main thrust of the re-search activity has been around the methylammonioum (MA) lead iodide perovskite, but the interest has broad-ened to include other compounds not only by replacing and/or mixing the halides24,25 but also exploring the ef-fect of other organic cations26,27. In particular, a for-mamidinium (FA) lead iodine perovskite solar cell hav-ing a maximum conversion efficiency greater than 20 % has recently been achieved by Yang et al.28. Also, Sal-iba et al.29have demonstrated that a triple cation recipe (Cs, FA, MA) allows to improve the stability and repro-ducibility of the cell while reaching an efficiency of 21.1 %.
The complex physical chemistry of the hybrid per-ovskites, in particular for those compounds having
a)Electronic mail: mcarignano@qf.org.qa b)Electronic mail: jacky.even@insa-rennes.fr c)Electronic mail: claudine.katan@unv-rennes1.fr
CH3NH3 as organic cation, was recognized long ago af-ter a series of detailed experiments30–37. The picture emerged from these pioneering papers is that of a mate-rial evolving from a low temperature towards one or two phases in which the mobility of the organic cation gained rotational degrees of freedom. Moreover, the possibility of orientational disorder in the intermediate phases was also suggested. Recent experiments38–40 and large scale molecular dynamics simulations23,41–43 are in line with those earlier works. Noteworthy, the system size and complexity of the interactions prohibit a full thermody-namic characterization using first principles methods and more e↵orts are needed in order to have an overall picture with atomistic detail.
The structure of HC(NH2)2PbI3, also referred to as FAPI, was first studied by Stoumpos et al.44using single crystal X ray di↵raction. Two phases were identified. A black trigonal (P 3m1) phase, which is also referred to as quasi cubic, was found to be stable at temperature over 60 C and a yellow hexagonal phase that appeared as the stable phase at room temperature. Nevertheless, it was noted that the properties of these materials in general depend of the preparation method. Further refinements by Weller et al.39 obtained from high resolution neutron di↵raction suggested that the so called black phase is in-deed cubic (P m¯3m) with a lattice parameter a = 6.3620 ˚
A. Interestingly, the orientation of the formamidinium molecules is reported as formally disordered with 24 pos-sible orientations. The inorganic lead iodide framework is characterized as soft, and iodine atoms display a strong anisotropic motion in the plane perpendicular to the Pb-I-Pb direction. By means of low temperature dielec-tric measurements, Fabini et al.40studied comparatively
CH3NH3PbI3 (MAPI) and FAPI and reported, for both systems, the characteristic signatures of a (rotational) glassy system: the broad peak in the frequency depen-dent dielectric loss shows a dramatic dynamic slowing down as the system approached the glass temperature.
Such a glassy behavior is consistent with our recent analysis of large scale first-principles molecular dynam-ics simulations on MAPI43. More generally, based on the experimental and theoretical understanding of hybrid perovskites we proposed that a natural and comprehen-sive perspective to theoretically analyze these systems is to place them at the intersection of three distinct classes of materials: First, and related to its intended applica-tion, HOP touch the realm of conventional semiconduc-tors. Second, due to their underling atomic organiza-tion the HOP should be considered as an extension of fully inorganic perovskites, for which much of the cur-rent density functional theory methodology finds many successful applications. Finally, and because of the rota-tional degrees of freedom of the organic cation, the HOP are plastic crystals and exhibit many of their complex dynamical behavior. With this overall scenario in mind, this paper presents a first principles molecular dynam-ics study of HC(NH2)2PbI3 along with a group theory analysis. It is an important intermediary step before considering more complex composition such as the triple cation29 or 2D/3D perovskite composition45 that have demonstrated clear improvements with stabilized output power under operational conditions as compared to the prototype CH3NH3PbI3.46
II. COMPUTATIONAL DETAILS
The molecular dynamics simulations were per-formed using periodic boundary conditions and under isothermal-isobaric conditions. All simulations were per-formed using the CP2K package47–49 as in our previ-ous works on similar systems. The time step for the integration of the dynamic equations was set to 1 fs. The temperature was controlled using the Nos´e-Hoover thermostat50,51with three chains and a time constant of 50 fs. The volume fluctuations were controlled by impos-ing a fully anisotropic pressure couplimpos-ing as implemented by the NPT–F option of CP2K, which follows the method of Martyna et al.52. The reference pressure was set at 1 atm and the barostat time constant at 50 fs.
The electronic density is represented in CP2K by a combination of Gaussian basis functions and plane waves in the GPW method. The PBE functional was used to calculate the electronic structure properties and the Grimme D3 correction scheme was included to account for the dispersion interactions53,54. DZVP-MOLOPT ba-sis sets55 were used to expand the Kohn-Sham orbitals, complemented by the auxiliary plane wave set that were defined by an energy cuto↵ of 300 Ry. Norm-conservative GTH pseudopotentials56,57were used to complete the in-ter atomic inin-teractions.
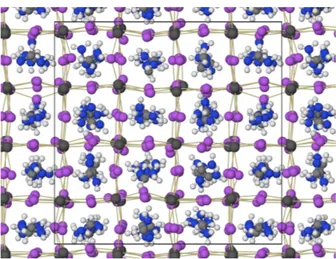
FIG. 1. Snapshot of the system corresponding to 450 K after 58.9 ps of simulation. The thin yellow lines are drawn between bonded Pb and I atoms. The I atoms are in general displaced from their ideal position along the Pb-Pb connecting lines. The rotational degrees of freedom of the FA molecules are clearly visible and the nearly perfect cubic supercell is shown in fine black lines.
The main simulated system contains 64 cubic unit cells and the initial configuration were obtained by replicating the experimentally determined coordinates39 to form a 444 supercell with an edge of 25.448 ˚A. Therefore, the ini-tial state contains all the FA molecules oriented in exactly the same way. Four sets of simulations are presented in this paper. Based on the 444 system we performed an MD simulation at 300 K that extended to 50.7 ps and a second one at 450 K that was extended to reach 58.9 ps. The analysis of the two trajectories shows that for this supercell size and for the particular conditions im-plemented here, the system requires about 25 ps to relax and reach an equilibrium state where the cell parameters cease to drift in a systematic way. For that reason, all the analysis presented below relies on the second half of the simulated trajectories. A snapshot of the simulation box corresponding to t = 58.9 ps at 450 K is displayed in Figure 1. The structure shows that although the inor-ganic atoms do follow a regular pattern, the orientation of the FA molecules appears to be random.
In our previous work, based on simulations of the MAPI perovskite, we observed a strong odd-even ef-fect in the results related to the relaxation of the MA molecules43. The origin of this persistent e↵ect was at-tributed to two possible causes, one related to the dipolar coupling of the MA molecules between neighboring cells, the second related to limitations imposed by the -point sampling of the simulations. The small dipole moment of the FA molecules o↵ers the possibility to discern which of these two e↵ects dominates the observed odd-even ar-tifacts. Then, a 333 supercell (324 atoms) was also simu-lated at 300 K. For the smaller system 333, we performed a single simulation run at 300 K covering a total of 20 ps.
The smallest supercell alternative, the 222 system with only 96 atoms, was also simulated at 300 K in order to asses the magnitude of the fluctuations associated with its small size.
III. RESULTS
At room temperature, the experimental unit cell con-tains a single FA molecule in the cubic inorganic cage and therefore the replication process to create a 444 system results in a low entropy structure with all FA molecules having identical orientation. The start of the NPT simu-lations, which was performed by assigning random veloc-ities consistent with the Maxwell distribution at 300 K, reflects the unphysical initial condition by undergoing a fast expansion accompanied by rotations of the organic molecules. This initial expansion, which can be observed in Figure S1, relaxes in about 10 ps to the equilibrium cell dimensions. This procedure of a sudden shake up of the system at the start of the simulation is the same that we used in our previous work for MAPI, and although it requires an extra equilibration time with respect to a slow heating protocol it has the benefit to automatically introduce a random orientational entropy of the organic components. The MD trajectory is continued up to 50.7 ps, and only the second half of the simulation is used for the collection of results. The equilibrium structure of the FAPI resulting from the simulations is cubic, with an av-erage lattice parameter a = 6.39 ˚A. The fluctuations of the three independent cell edges follows nicely a normal distribution with a standard deviation 0.025 ˚A. Similarly, the distribution for the simulation cell angles is centered in 90 and have a standard deviation of 0.55 (detailed information is provided in the Supporting Information file).
A second simulation at 450 K was started by setting the initial coordinates and velocities to those of an equili-brated conformation from the simulation at 300 K (frame corresponding to t = 25 ps). In this case, the simula-tion cell expanded smoothly from its initial size until it reached larger equilibrium dimensions after 30 ps of sim-ulation. The analysis of equilibrium properties on this system are based on the lapse going from 30 ps to 58.9 ps. The simulation cell fluctuates with a larger ampli-tude than for the case at the lower temperature, but the system remains cubic with an average lattice parameter a = 6.50 ˚A.
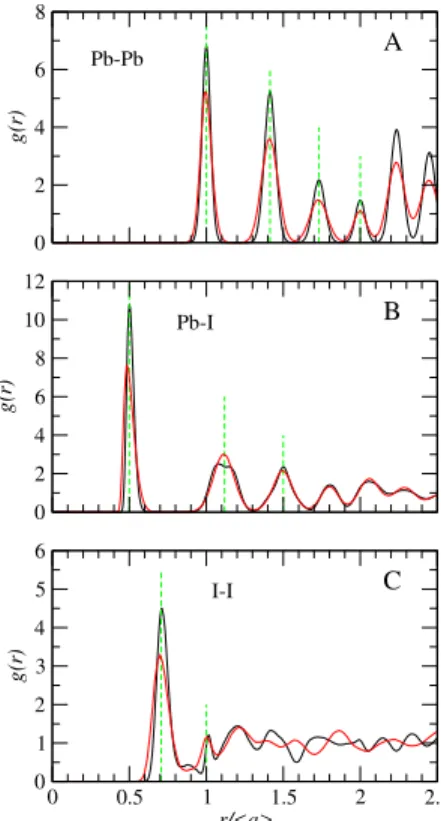
The analysis of the structure of the system, performed by calculating the radial pair distribution functions g(r), is shown in Figures 2 and 3. The figures display the re-sults for 300 K and 450 K, and in order to perform an adequate comparison, the radial distances are scaled by the corresponding cell parameter a. For the atoms defin-ing the inorganic cage, the picture that emerges is that of a crystalline material with the Pb atoms having a neatly defined simple cubic structure and the I atoms display-ing a larger degree of local mobility. In Figure 2-A the
0 2 4 6 8 g(r) 0 2 4 6 8 10 12 g(r) 0 0.5 1 1.5 2 2.5 r/<a> 0 1 2 3 4 5 6 g(r) Pb-I I-I Pb-Pb A B C
FIG. 2. Radial distribution functions for the atoms forming the inorganic cage. Panels A, B and C correspond to Pb-Pb, Pb-I and I-I, as indicated. The radial coordinate r is normalized by the average lattice parameter obtained for each temperature. The black curves correspond to 300 K and the red curves to 450 K, respectively. The green vertical lines are located at the ideal position of the peaks for the di↵erent cases.
g(r) for the Pb-Pb pairs is reproduced. It stands out the perfect cubic order of the succession of peaks at a,p2a, p
3a, 2a and so on. Even though in this work the sim-ulation conditions allows for the independent variation of all the cell edge dimensions and angles, the overall fluctuation of the systems are sufficiently small to nicely reproduce the experimental cubic crystal structure with a small noise. Larger simulation cells, which will de-crease the local fluctuations even more, are prohibitively expensive for our current resources. Figure 2-B displays the radial distribution function for the Pb-I pairs that show, first of all, peaks that are not symmetric. Indeed, the first peak at r = a/2 is slightly skewed towards larger values of r. The origin of the e↵ect lies in the anharmonic character of the equilibrium position of the I atoms that can explore the region normal the the Pb-Pb connect-ing lines at a much lower energetic cost than along those lines, see snapshot in Figure 1. This e↵ect is reflected as a nearly double second peak for the 300 K case, but as a single wide peak for 450 K. The di↵erence between the two temperatures has to be related to the character-istic times for the slow fluctuations of the I atoms across the Pb-Pb connecting lines that decreases significantly
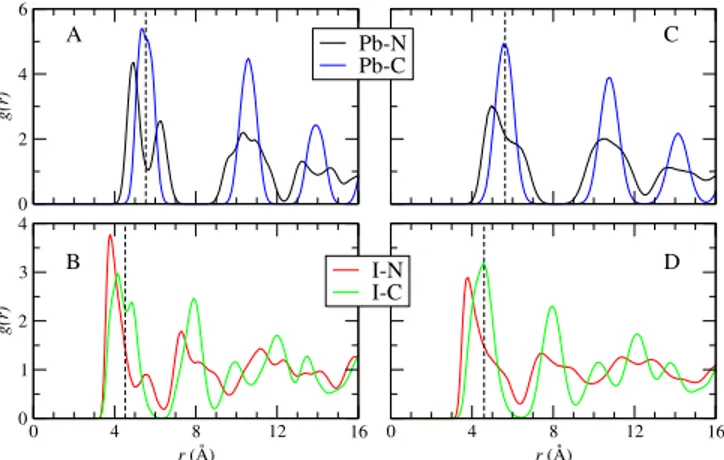
0 4 8 12 16 r (Å) 0 2 4 6 g(r) Pb-N Pb-C 0 4 8 12 16 r (Å) 0 1 2 3 4 g(r) I-N I-C A B C D
FIG. 3. Radial distribution functions for the pairs Pb-N (black lines), Pb-C (blue lines), I-N (red lines) and I-C (green lines). Panels A) and B) correspond to 300 K. Panels C) and D) correspond to 450 K. The vertical dashed lines indicate the ideal center of the inorganic cage.
as the temperature is increased (see average structures, Figure 4). Finally, in Figure 2-C we show the g(r) corre-sponding to the I-I pairs, which display almost a liquid character beyond the second peak. The reason for this is the above mentioned higher mobility of these atoms in addition to the fact that they are more numerous, it result in a succession of overlapping peaks showing a fast approach to the asymptotic limit. For reference, Figure S5 gives the g(r) for the inorganic atoms pairs obtained for the smaller 222 supercell size.
The pair distribution functions of the pairs involving N and C having Pb and/or I as the reference atom are useful to display the average location of the FA molecules inside the cubic inorganic cages. These results are shown in Figure 3. As expected by the geometry of the overall system and the FA molecule, the C atoms occupy the central region of the cages. Nevertheless, for the 300 K case, the C atom is in average slightly o↵ the geometric center of the cage as revealed by the maximum of the Pb-C pair distribution function. By increasing the tem-perature to 450 K the C atom distributes almost evenly around the geometrical center. Considering the I atoms as the reference point, then the I-C pair distribution func-tions display a double peak at 300 K, which is related to the displacements of the I atoms from their ideal posi-tions (see Figure 4). The N atoms are o↵-centered in the cage at both temperatures. For 300 K, the first peak is lo-cated at rc 0.62 ˚A and rc 0.73 ˚A for the Pb and I cases, respectively, with rcbeing the ideal geometrical center of the inorganic box represented by the vertical dashed lines in the figures. Considering that the CN bond is of 1.3 ˚A, the average radial distribution functions do not o↵er a clear picture of the preferred orientation of the molecule inside the inorganic cage.
The average structure of the inorganic frame of FAPI, calculated over the whole production part of the sim-ulated trajectory, is displayed on Figure 4. At 300 K
FIG. 4. Structure obtained by averaging the position of the Pb and I atoms over the production section of the trajec-tory at 300 K (left) and 450 K (right). The deformations are in line with the known anharmonic response of the I atoms which have a relatively long characteristic time (⇠ 10 ps). The higher temperature simulation average out the anharmonicity resulting in a cubic structure.
the Pb-I-Pb lines are not straight, but follow a zig-zag pattern that define elongated cavities to host the FA molecules. By increasing the temperature to 450 K the mobility of the I atoms increases substantially and the corresponding average structure displays only a minor departure from the perfect cubic structure with all cavi-ties having essentially the same regular shape. This reg-ularity in the structure is also reflected in the pair dis-tribution functions displayed above in Figure 2 for the Pb-I case, which shows the disappearance of the bimodal second peak at 450 K. Noteworthy, the projections of the average structure displayed in Figure 4 correspond to the plane normal to direction a, but the projections on the other two planes display essentially the same pat-tern. The question that arises is whether there is a cou-pling between the lattice distortions and the orientation of the molecules. A simple qualitative answer can be ob-tained by averaging the coordinates corresponding to the molecule’s atoms over the whole production run, as done for the inorganic frame. The results indicate a strong coupling at 300 K that vanishes at 450 K, as is explained in the Supporting Information file.
In order to quantify the tilting of the PbI6 octahedra we calculate the angles (✓, ) defined by the octahedral axes with respect to the fixed reference coordinate sys-tem of the simulations. The polar angle ✓ is measured with respect to the positive direction of z axis, and the azimuthal angle is measured on the xy-plane from the positive direction of the x axis. Each one of the three axes define an orientation, that we denote by the indexes 1, 2 and 3. The orientation 1 is nearly parallel to the x axis, orientation 2 is close to the y axis and orienta-tion 3 follows the z axis. Then, the three pairs of an-gles calculated along the MD trajectories represent devi-ations from the ideal positions of the cubic phase that are ✓1 = ⇡/2, 1 = 0; ✓2 = ⇡/2, 2 = ⇡/2 and ✓3 = 0,8 3. In Figure 5-A we present a schematic representation of a tilted octahedron and the three characteristic
direc-x y z A) ✓3, 3 ✓2, 2 ✓1, 1 B) C N1 N2 ~r2 ~r1 ~r+ ~r
FIG. 5. A) Scheme of the tilting of the PbI6 octahedron
defining the three characteristic set of angles. The directions (✓1, 1), (✓2, 2) and (✓3, 3) represent departures from the
ideal orientations along the x, y and z Cartesian axes, respec-tively. B) Scheme of the FA molecule and the characteristic vectors ~r1 , ~r2, ~r+ and ~r used to describe the molecular
orientations.
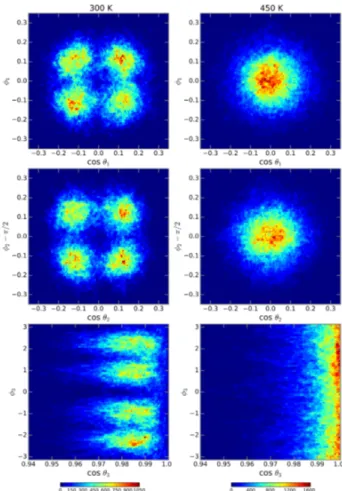
tions. The distributions for the three pairs of angles is shown in Figure 6 for 300 K and 450 K as a color map. The color scale represents the residence time for a par-ticular orientation and is proportional to the probability density of finding any given molecule in a particular ori-entation. At the lower temperature, the tilting of the octahedra define distinctive angles as follow: for the ori-entation 1, the four spots are centered athcos ✓i = ±0.12, h i = ±0.11. For orientation 2, the average centers are hcos ✓i = ±0.12, h i = ⇡ ±0.12. Finally for orientation 3, the average centers arehcos ✓i = 0.98, h i = ±0.90 and ±2.26. By increasing the temperature to 450 K the four spots coalesce into a single one centered around the ideal orientation of the perfect cubic crystal with no tilting, as represented in the right panels of Figure 6.
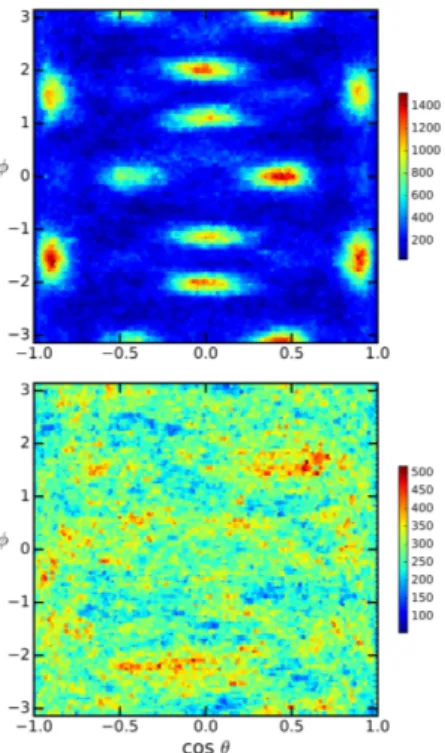
The orientation of the FA molecules in their cages can be discerned by monitoring characteristic directions in terms of the three heavy atoms of the molecules. First, we consider the vectors defined by the molecular bonds, ~r1 = (~rN1 ~rC) and ~r2 = (~rN2 ~rC). Second, we look at the vector defined by the sum of the two CN bonds: ~r+= ~r1+ ~r2. Finally, using the direction defined by the line joining the two N atoms of the molecule we define ~r = ~r1 ~r2. A schematic representation of these direc-tions is presented in Figure 5-B. In order to characterize the directions of ~r1, ~r2, ~r+and ~r , we compute the polar angle ✓ and the azimuthal angle for each one of them. In this way we can represent the distribution of orienta-tions using a color scale in the plane (cos ✓, ). It is im-portant to note that the two N atoms are indiscernible and therefore the di↵erence vector has arbitrary direc-tion. Namely, it is equally correct to choose the direction pointing from one N to the other, or vice-versa. In order to have a systematic approach we always chose the di-rection that corresponds to a positive value for cos ✓. We display on Figure 7 the distributions for ~r+ and ~r ob-tained from the simulated trajectories at 300 K and 450
K. At both temperature the orientation of sum vector is parallel to the edges of the simulation cell, and isotropi-cally distributed towards each of the six directions. How-ever, the color maps show a very strong contrast in the lower temperature case, indicating a very high proba-bility for the molecules to have their r+ vector oriented according to (100) directions. The intensity of the distri-bution drops to essentially zero between the bright spots, suggesting that the molecules are quite static or under-going sudden reorientations between the most probable directions. Vectors ~r+ and ~r point approximately to-wards the center of the cube faces. At 450 K the same pattern can be distinguished, but all directions in the plane are well populated implying a more uniform rota-tional dynamics than in the low temperature case. The corresponding distributions for the di↵erence vector ~r display essentially the same pattern, but in this case only half of the space is represented because of the arbitrarity in the labeling of N1 and N2.
Besides, the orientational distributions in a cubic lat-tice can be interpreted in terms of cubic harmonics58,59.
FIG. 6. Orientational maps describing the tilting of the PbI6
octahedrons. The left column corresponds to the simulation at 300 K, and right column is for 450 K. From top to bottom, the rows describe the orientations case 1, 2 and 3, respectively, as explained in the text.
FIG. 7. Distribution for the orientations of the vectors bond sum (~r+) and di↵erence (~r ) vectors. At 300 K (top panels)
the high contrast figure reflects the persistent directionality of the molecules that are oriented in such a ways that the two perpendicular vectors are in (100) directions. At 450 K (bottom panels), the overall pattern persists, although with a very small contrast arising from a more uniform rotational pattern of the molecules.
For a characteristic direction u within a system with an underlying cubic symmetry the probability distribution f (u) can be expressed as
f (u) = 1 4⇡ " 1 + n X i=4 ciKi(u) # (1) where ci are the coefficients associated with each cu-bic harmonic Ki. The number of terms required to de-scribe is small for smooth distributions, but increases for sharper distributions like the one we observed for 300 K. In Figure 8 we reproduced the results obtained by fit-ting the orientational map corresponding to ~r+using the expansion in cubic harmonics up to the n = 12 (see Sup-porting Information for details). The coefficients of the expansions are reproduced in the Supporting Information file. A three dimensional representation of the fits is also included in Figure 8. For 300 K the directionality of the orientational pattern is much stronger that for 450 K. Also, it evident from the comparison with Figure 7 that there is a certain degree of departure from a perfect cu-bic symmetry at 300 K, which cannot be capture by the fit based on cubic harmonics. This is evident by looking at the bright spots corresponding to = 0, ⇡ and ⇡, which are horizontally elongated. (A corresponding ver-tical elongation is present for = ⇡/2, ⇡/2, although it
FIG. 8. Distribution for the orientations of the vectors bond sum (~r+) obtained by fitting the data from the simulation
trajectories at 300 K and 450 K using a 12thorder expansion
on cubic harmonics, see Eq. (1). The figures on the right are 3D representations of the orientational probability and reveal the higher contrast at 300 K.
is not appreciable due to the chosen plotting range) The origin of this deformation is related to the tilting of the PbI6 octahedron, which does not randomize within the simulated time scale. For the higher temperature case, the tilting average to zero and this e↵ect disappears in the corresponding color maps.
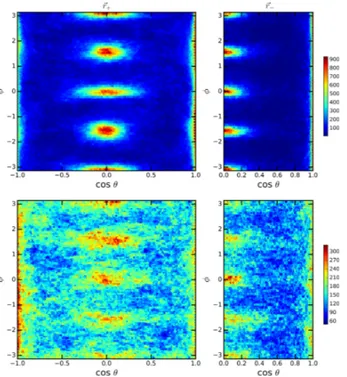
On Figure 9 we present the bonds orientational maps obtained from the two simulated trajectories. Namely, the orientation defined by the direction of the CN bonds, represented by the vectors ~r1 and ~r2 defined above in Figure 5-B. For the case corresponding to 300 K, the slow rotational dynamics translates to 12 very well defined spots. As the temperature is increased to 450 K, the pattern is completely lost and no clear directions can be recognized as the most likely ones.
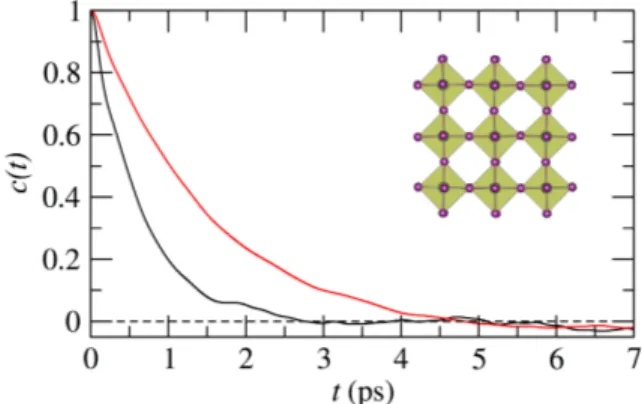
The characterization of the rotational dynamics of the FA molecules can be done by studying the time de-pendent self correlation functions of the type c(t) = h~r(0).~r(t)i, where r is any of the above described vec-tors. In Figure 10 we show the relaxation curves cor-responding to ~r+ and ~r that define the corresponding self correlation curves c+(t) and c (t). First of all, it is clear that the rotation of the molecules is not isotropic at any of the two temperatures since c+(t) relaxes faster than c (t). Since these two vectors are nearly orthogo-nal, then one vector can be considered as the rotational axis for the other one and vice-versa. The results imply
FIG. 9. Distribution of the orientation of the two bonds of the FA molecules, ~r1 and ~r2, calculated from the simulations
at 300 K (top panel) and 450 K (bottom panel).
that for 300 K the rotations are almost exclusively about the ~r direction. At 450 K, the mobility increases in such a way that both directions of rotation are clearly visible at the timescale of our simulations. The results at 450 K can be fitted very well with a simple exponential function, yielding relaxation times of 0.5 ps and 1.2 ps for c+(t) and c (t), respectively. The case for 300 K is di↵erent, and a stretched exponential fits c+(t) with a stretching param-eter = 0.77, resulting in a relaxation time of 4.3 ps. For c (t) at 300 K, the strong correlation does not permit to calculate any accurate relaxation time. The behavior at
0 2 4 6 8 10 12 t (ps) 0 0.2 0.4 0.6 0.8 1 c(t)
FIG. 10. Time dependent self correlation function for ~r+
(black lines) and ~r (red lines) at 300 K (solid lines) and 450 K (dashed lines).
300 K captured by a stretched exponential resembles the results for the MAPI in the cubic phase. In that case, the relaxation of the individual molecules reveals a heteroge-neous dynamics. Similarly, in the case of the FAPI we observe that in the timescale of the simulations there are molecules having very little or no rotations, while other undergo a relatively fast rotation (see Figure S7).
On the origin of the odd-even e↵ect
In our previous work related to the MAPI system, we observed that the results alternate in behavior depend-ing on the number of unit cells contained in the simu-lation supercell. This e↵ect was observed to appear in the relaxation of the MA molecules time dependent self correlation function, in the heterogenous character of the rotational degrees of freedom of the MA molecules, and in the average structure of the inorganic cage. Two pos-sible explanations for this odd-even e↵ect were proposed: (i) the dipolar coupling of the MA molecules between neighboring cells, or (ii) the impossibility of the MD odd-supercell to properly represent e↵ects that are related to Brillouin zone (BZ) folding as the used MD technique re-lies only in -point sampling. In the case of the FA the dipole moment is very small and therefore provides an adequate example to discriminate on the importance of the two possible origins of the odd-even e↵ect.
In order to further explore this e↵ect we studied a 333 system composed by 27 FA molecules resulting for the triple replication of the cubic unit cell along the three Cartesian directions. The simulation settings were the same as in the simulations of the 444 systems presented above and the temperature was set to 300 K. In Figure 11 we present the results that show that the FAPI system with odd number of cells behaves similarly to equivalent MAPI systems. Namely, the 333 system has a faster homogeneous dynamics than the 444 system simulated at the same conditions. The average inorganic cage re-flects the faster fluctuations by producing a nearly perfect cubic structure, contrary to the corresponding averages performed using the supercell with even number of cells. Due to the small magnitude of the dipole moment of the FA molecules, we conclude that the odd-even e↵ect is re-lated to the inadequate description of of the electronic wave-function at the edge of the BZ resulting from the
-point sampling43,60.
IV. DISCUSSION
The structural instabilities in conventional perovskites can be usually inspected on the basis of Landau theory using the theory of group symmetry. A low temperature phase may appear after the condensation of a phonon mode of the P m3m parent phase at a critical transition temperature. Some of these classical structural instabili-ties have been characterized in halide perovskites leading
FIG. 11. Time dependent self correlation function for ~r+
(black lines) and ~r (red lines) at 300 K for a 333 system. In the insert, average structure of the inorganic atoms that show a nearly perfect cubic arrangement
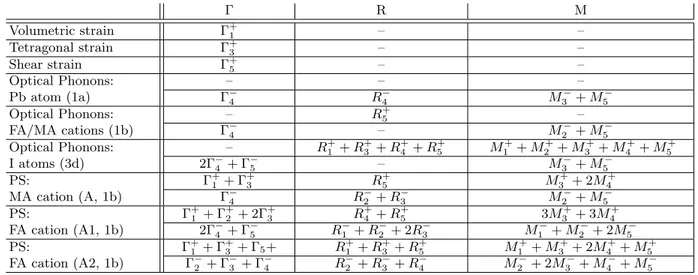
to tetragonal centered I4/mcm (MAPbI3), orthorhom-bic P nma (MAPbI3) or tetragonal P 4/mbm (CsPbCl3) (Figure 12). Using Landau theory, it is straightforward to predict that these various instabilities are related either to phonons with R+4 or M3+symmetries, or simultaneous condensations of R+4/M3+ phonon modes for the P nma case. The symmetries of the collective atomic displace-ments of metal and halide atoms, as well as molecular centers of mass, can be predicted from group theory as well (Table 1). R+4 or M3+ irreducible representations (IR) only appear in the decomposition of halide atoms motions. M3+ and R4+ optical phonon modes are indeed associated respectively to in-phase and anti-phase
rota-FIG. 12. Schematic diagram indicating the group-subgroup relationship between some of the space groups observed in HOP and AIP (solid red lines). The tilt systems are given using Glazer’s notation, as well as the P m3m IR related to the lattice instabilities. M3+ and R+4 order parameters are related to pure in-phase and anti-phase PbI6 octahedra tilts,
respectively. The dashed red line indicates that a transition from I4/mcm to P nma space groups must be a first order phase transition.
FIG. 13. (a) Schematic diagram showing one of the 12 posi-tions for the PS A1 and PS A2. The molecule is represented schematically with the C, N1 and N2 atoms discarding the H atoms. In both cases, the C atom is pointing toward a face. For PS A1 and A2, the (C, N1, N2) plan corresponds respec-tively to the h and d symmetry planes of the Oh point
group. (b) Symmetry operations of the Oh point group.
tions of MX6 octahedra. From molecular dynamics sim-ulation of FAPI (Figure 4), we deduce that the structural instability is associated to the simultaneous and progres-sive (Figure 9) condensations of three M3+pure in-phase modes. It corresponds to an Im3 averaged structure (Figure 12), related to an eight-fold increase of the cubic cell size.
We have shown in our previous theoretical study of MAPI that stochastic molecular reorientations can be also analyzed using a symmetry analysis of the molecular orientational probability. It is possible either to choose simplified pseudospin (PS) descriptions of the discrete molecular orientations or continuous rotator functions. The symmetries of the collective molecular orientational distributions can be derived at various points of the Bril-louin zone by analogy to the phonon modes. The con-densation of a PS mode at a structural phase transition is indicative of an order-disorder character by contrast to a displacive character for phonon modes. A vecto-rial PS was defined in our previous study of MAPbX3 by considering the C-N molecular axis, thus focusing on the tumbling modes of the MA+ cation. PS scenario A for MAPbX3 compounds was defined as the case where the C-N axes are pointing toward the faces of the cu-bic cell (Table 1). As mentioned in the section devoted to MD results, a discrete PS description of the stochas-tic rotation of the FA+ cation in FAPbX3 compounds requires to account for its specific shape and planar ge-ometry (Figure 5-B). In scenario A, where the C atoms are pointing toward the faces of the cubic cell, two
sub-TABLE I. IR decompositions for the strain tensor, phonons and MA or FA pseudospins excitations (PS) in HOP compounds at the , R and M points of the P m3m BZ. The contributions from each site (1a, 1b, 3d) are indicated. The symmetric (+) and antisymmetric (-) PS IR correspond to elastic and electric multipoles, respectively.
R M Volumetric strain +1 – – Tetragonal strain +3 – – Shear strain +5 – – Optical Phonons: – – – Pb atom (1a) 4 R4 M3 + M5 Optical Phonons: – R+ 5 – FA/MA cations (1b) 4 – M2 + M5 Optical Phonons: – R+ 1 + R+3 + R+4 + R+5 M1++ M2++ M3++ M4++ M5+ I atoms (3d) 2 4 + 5 – M3 + M5 PS: +1 + +3 R+5 M3++ 2M4+ MA cation (A, 1b) 4 R2 + R3 M2 + M5 PS: +1 + +2 + 2 +3 R+4 + R+5 3M3++ 3M4+ FA cation (A1, 1b) 2 4 + 5 R1 + R2 + 2R3 M1 + M2 + 2M5 PS: +1 + +3 + 5+ R+1 + R + 3 + R + 5 M + 1 + M + 3 + 2M + 4 + M + 5 FA cation (A2, 1b) 2 + 3 + 4 R2 + R3 + R4 M2 + 2M3 + M4 + M5
scenarios A1 and A2 may be considered (Figure 13). For PS A1 and A2, the (C, N1, N2) plane corresponds re-spectively to the h and d symmetry planes of the Oh point group. The symmetries of the collective PS modes A1 and A2 can be predicted from group theory (Table 1). From the orientational maps of FA cations (Figure 7), it appears that PS scenario A1 is most likely to de-scribe the stochastic reorientations. As shown on Table 1, the M3+irreducible representation (IR) appears in the decomposition of PS A1. We can thus conclude from this analysis, that the mechanism of the structural instability in FAPI is associated to a linear coupling between col-lective (deterministic) rotations of PbI6 octahedra and collective (stochastic) reorientations of the FA+ cations. A mixed displacive/order-disorder character is expected for the structural instability. More, we may infer that these low-frequency rotational modes of the PbI6 octa-hedra undergo a large broadening related to this coupling mechanism.
V. CONCLUSIONS
In the quest to achieve a theoretical understanding of hybrid organic perovskites that recommenced with the application of these materials for energy harvesting ap-plications, molecular dynamics has been moderately em-ployed. The reasons are several. First, the science in-volved in the solar cells development is essentially of a quantum nature, and therefore an adequate description calls for a computationally expensive density functional theory approach. Second, the system has a molecular component with rotational degrees of freedom that, while making the system more interesting imposes the need for long simulation times. Third, an intrinsic anisotropy in
the dynamic of the halide component further complicates the matter calling also for long simulation times. In spite of this issues requiring very large computational e↵orts, the first principles simulation community performed ini-tial studies with relatively small systems. Increasing the size of the supercell, at least within the approach that we have been employing, revealed an odd-even e↵ect that ac-tually prompted us to work with even larger systems in order to overcome artificial results and at the same time sufficiently reduce the fluctuation associated with small simulation supercells. Our results, using a model sys-tem with a four fold replication of the unit cell in each direction, show a very organized inorganic framework in which the organic cation is located.
The formamidinium rotational dynamics exhibit a het-erogeneous behavior at room temperature, similarly to the behavior previously observed for the methylammo-nium cation. The rotation of the formamidinium is anisotropic, having a preferential axis of rotation along the line connecting the two nitrogen atoms. At room temperature, the rotation is almost exclusively along the NN line. Increasing the temperature results in the ac-tivation of other rotational modes, like the axis defined by the sum of the two CN bonds. We have analyzed the dynamic of the cation in terms of rotator functions, in particular by fitting the rotational pattern in terms of cubic harmonics considering up to the 12th order term. At room temperature, the orientation of the sum vec-tor is essentially (100) and all the directions are equally populated indicating a rotational entropy characteristic of plastic crystals that, together with the heterogeneous dynamics, suggest that the system should form a rota-tional glass at lower temperatures.
Based on Landau and group theories, we further iden-tify a mixed displacive/order-disorder character for the
structural instability, which may lead at low temperature to an Im3 phase. This structural instability in FAPI is predicted to be associated to the simultaneous and pro-gressive condensation of three M3+ modes involving de-terministic rotations of PbI6 octahedra and stochastic reorientations of the FA+ cations.
VI. ACKNOWLEDGEMENTS
For computer time, this research used the resources of the Supercomputing Laboratory at King Abdullah Uni-versity of Science & Technology (KAUST) in Thuwal, Saudi Arabia. Y. Saeed acknowledges the support of the Qatar National Research Fund under the PDRA-1-0119-14119 postdoctoral grant. M. A. Carignano held an in-vited position at University of Rennes 1, which is grate-fully acknowledged. The work was supported by Uni-versity of Rennes 1 within Action Incitative, D´efis Sci-entifiques Emergents 2015. J. E.’s work is supported by the Fondation d’entreprises Banque Populaire de l’Ouest under Grant PEROPHOT 2015.
1A. Kojima, K. Teshima, Y. Shirai and T. Miyasaka. J. Am. Chem. Soc., 2009, 131, 6050–6051.
2J.-H. Im, C.-R. Lee, J.-W. Lee, S.-W. Park and N.-G. Park. Nanoscale, 2011, 3, 4088–4093.
3M. M. Lee, J. Teuscher, T. Miyasaka, T. N. Murakami and H. J. Snaith. Science, 2012, 338, 643–647.
4L. Etgar, P. Gao, Z. Xue, Q. Peng, A. K. Chandiran, B. Liu, Md. K. Nazeeruddin and M. Gr¨atzel. J. Am. Chem. Soc., 2012, 134, 17396–17399.
5H.-S. Kim, C.-R. Lee, J.-H. Im, K.-B. Lee, T. Moehl, A. Mar-chioro, S.-J. Moon, R. Humphry-Baker, J.-H. Yum, J. E. Moser, M. Gr¨atzel, and N.-G. Park. Sci. Rep., 2012, 2, 591.
6N.-G. Park. J. Phys. Chem. Lett., 2013, 4, 2423–2429.
7J.-H. Im, I.-H. Jang, N. Pellet, M. Gr¨atzel and N.-G. Park. Nat. Nano, 2014, 9, 927–932.
8Y. Zhao and K. Zhu. J. Phys. Chem. C, 2014, 118, 9412–9418. 9N. J. Jeon, J. H. Noh, W. S. Yang, Y. C. Kim, S. Ryu, J. Seo
and S. I. Seok. Nature, 2015, 517, 476–480.
10G. Xing, N. Mathews, S. Sun, S. S. Lim, Y. M. Lam, M. Gr¨atzel, S. Mhaisalkar and T. C. Sum. Science, 2013, 342, 344–347. 11S. D. Stranks, G. E. Eperon, G. Grancini, C. Menelaou, M. J. P.
Alcocer, T. Leijtens, L. M. Herz, A. Petrozza and H. J. Snaith. Science, 2013, 342, 341–344.
12V. Roiati, E. Mosconi, A. Listorti, S. Colella, G. Gigli, and F. De Angelis. Nano Lett., 2014, 14, 2168–2174.
13L. Bertoluzzi, R. S. Sanchez, L. Liu, J.-W. Lee, E. Mas-Marza, H. Han, N.-G. Park, I. Mora-Sero and J. Bisquert. Ener. Environ. Sci., 2015, 8, 910–915.
14Q. Lin, A. Armin, R. C. R. Nagiri, P. L. Bur, and P. Meredith. Nat. Photon, 2015, 9, 106–112.
15P. L¨oper, M. Stuckelberger, B. Niesen, J. Werner, M. Filipiˇc, S.-J. Moon, S.-J.-H. Yum, M. Topiˇc, S. De Wolf and C. Ballif. J. Phys. Chem. Lett., 2015, 6, 66–71.
16A. A. Bakulin, O. Selig, H. J. Bakker, Y. L. A. Rezus, C. M¨uller, T. Glaser, R. Lovrincic, Z. Sun, Z. Chen, A. Walsh, J. M. Frost and T. L. C. Jansen. J. Phys. Chem. Lett., 2015, 6, 3663–3669. 17F. Brivio, A. B. Walker and A. Walsh. APL Mater., 2013, 1,
042111.
18J. M. Frost, K. T. Butler, F. Brivio, C. H. Hendon, M. van Schilfgaarde and A. Walsh. Nano Lett., 2014, 14, 2584–2590. 19Y. Wang, T. Gould, J. F. Dobson, H. Zhang, H. Yang, X. Yao
and H. Zhao. Phys. Chem. Chem. Phys., 2014, 16, 1424–1429.
20R. Lindblad, D. Bi, B.-W. Park, J. Oscarsson, M. Gorgoi, H. Siegbahn, M. Odelius, E. M. J. Johansson and H. Rensmo. J. Phys. Chem. Lett., 2014, 5, 648–653.
21E. Mosconi, C. Quarti, T. Ivanovska, G. Ruani and F. De Angelis. Phys. Chem. Chem. Phys., 2014, 16, 16137–16144.
22Y. Wang, B. G. Sumpter, J. Huang, H. Zhang, P. Liu, H. Yang and H. Zhao. J. Phys. Chem. C, 2015, 119, 1136–1145. 23A. Mattoni, A. Filippetti, M. I. Saba and P. Delugas. J. Phys.
Chem. C, 2015, 119, 17421–17428.
24J. Qiu, Y. Qiu, K. Yan, M. Zhong, C. Mu, H. Yan and S. Yang. Nanoscale, 2013, 5 3245–3248.
25K. T. Butler, J. M. Frost and A. Walsh. Materials Horizons, 2015, 2, 228–231.
26J.-H. Im, J. Chung, S.-J. Kim and N.-G. Park. Nanoscale Res. Lett., 2012, 7, 1–7.
27A. A. Zhumekenov, M. I. Saidaminov, Md. A. Haque, E. Alarousu, S. P. Sarmah, B. Murali, I. Dursun, X.-H. Miao, A. L. Abdelhady, T. Wu, O. F. Mohammed and O. M. Bakr. ACS Ener. Lett., 2016, 4, 32–37.
28W. S. Yang, J. H. Noh, N. J. Jeon, Y. C. Kim, S. Ryu, J. Seo and S. I. Seok. Science, 2015, 348, 1234–1237.
29M. Saliba, T. M., J.-Y. Seo, K. Domanski, J.-P. Correa-Baena, M. K. Nazeeruddin, S. M. Zakeeruddin, W. Tress, A. Abate, A. Hagfeldt and M. Gr¨atzel. Ener. Environ. Sci., 2016,
30R. E. Wasylishen, O. Knop and J. B. Macdonald. Solid State Commun., 1985, 56, 581–582.
31A. Poglitsch and D. Weber. J. Chem. Phys., 1987, 87, 6373– 6378.
32N. Onoda-Yamamuro, T. Matsuo and H. Suga. J. Phys. Chem. Solids, 1990, 51, 1383 –1395.
33O Knop, R. E. Wasylishen, M. A. White, T. S. Cameron and M. J. M. Vanoort. Can. J. Chem., 1990, 68, 412–422.
34Q. Xu, T. Eguchi, H. Nakayama, N. Nakamura and M. Kishita. Z. Naturforsch. A, 1991, 46, 240–246.
35H. Mashiyama, Y. Kurihara and T. Azetsu. J. Korean Phys. Soc., 1998, 32, S156–S158.
36Y. Kawamura, H. Mashiyama and K. Hasebe. J. Phys. Soc. Japan, 2002, 71, 1694–1697.
37H. Mashiyama, Y. Kawamura, E. Magome and Y. Kubota. J. Korean Phys. Soc., 2003, 42, S1026–S1029.
38T. Baikie, Y. Fang, J. M. Kadro, M. Schreyer, F. Wei, S. G. Mhaisalkar, M. Graetzel and T. J. White. J. Mat. Chem. A, 2013, 1, 5628–5641.
39Mark T. Weller, Oliver J. Weber, Jarvist M. Frost and Aron Walsh. J. Phys. Chem. Lett., 2015, 6, 3209–3212.
40D. H. Fabini, T. Hogan, H. A. Evans, C. C. Stoumpos, M. G. Kanatzidis and R. Seshadri. J. Phys. Chem. Lett., 2016, 7, 376– 381.
41M. A. Carignano, A. Kachmar and J. Hutter. J. Phys. Chem. C, 2015, 119, 8991–8997.
42S. Meloni, T. Moehl, W. Tress, M. Franckevicius, M. Saliba, Y. H. Lee, P. Gao, M. K. Nazeeruddin, S. M. Zakeeruddin, U. Rothlisberger and M. Graetzel. Nat. Commun. 2016, 7 10334. 43J. Even, M. Carignano and C. Katan. Nanoscale, 2016, 8, 6222–
6236.
44C. C. Stoumpos, C. D. Malliakas and M. G. Kanatzidis. Inorg. Chem., 2013, 52, 9019–9038.
45H. Tsai, W. Nie, J.-C. Blancon, C. C. Stoumpos, R. Asadpour, B. Harutyunyan, R. Verduzco, J. Crochet, S. Tretiak, L. Pedesseau, J. Even, M. A. Alam, G. Gupta, J. Lou, P. M. Ajayan, M. J. Bedzyk, M. G. Kanatzidis and A. D. Mohite, Nature, 2016 (in press).
46W. Nie, J.-C. Blancon, A. J. Neukirch, K. Appavoo, H. Tsai, M. Chhowalla, M. A. Alam, M. Y. Sfeir, C. Katan, J. Even, S. Tretiak, J. J. Crochet, G. Gupta and A. D. Mohite. Nat. Commun., 2016, DOI: 10.1038/ncomms11574
47G. Lippert, J. Hutter and M. Parrinello. Mol. Phys., 1997, 92, 477–488.
48J. VandeVondele, M. Krack, F. Mohamed, M. Parrinello, T. Chassaing and J. Hutter. Comput. Phys. Commun., 2005, 167,
103–128.
49J. Hutter, M. Iannuzzi, F. Schi↵mann and J. VandeVondele. Wi-ley Interdiscip. Rev.: Comput. Mol. Sci., 2014, 4, 15–25. 50S. Nos´e. J. Chem. Phys., 1984, 81, 511–519.
51W. G. Hoover. Phys. Rev. A, 1986, 34, 2499–2500.
52G. J. Martyna, M. E. Tuckerman, D. J. Tobias and M. L. Klein. Mol. Phys., 1996, 87, 1117–1157.
53S. Grimme. J. Comput. Chem., 2006, 27, 1787–1799.
54S. Grimme, J. Antony, S. Ehrlich and H. Krieg. J. Chem. Phys., 2010, 132, 154104.
55J. VandeVondele and J. Hutter. J. Chem. Phys., 2007, 127, 114105.
56S. Goedecker, M. Teter and J. Hutter. Phys. Rev. B, 1996, 54, 1703–1710.
57M. Krack. Theor. Chem. Acc., 2005, 114, 145—152.
58S. L. Altmann and A. P. Cracknell. Rev. Mod. Phys., 1965, 37, 19–32.
59R. Chelli, G. Cardini and S. Califano. J. Chem. Phys., 1997, 107, 8041–8050.
60C. Katan, L. Pedesseau, M. Kepenekian, A. Rolland and J. Even. J. Mater. Chem. A, 2015, 3, 9232–9240.