Clinical Feasibility of Raman Spectroscopy for
Quantitative Blood Glucose Measurement
by
Chae-Ryon Kong
B.S., Johns Hopkins University (2001)
M.S.E., Johns Hopkins University (2003)
Submitted to the Department of Electrical Engineering and Computer Science in partial fulfillment of the requirements for the degree of
Doctor of Philosophy in Electrical Engineering and Computer Science
at theMASSACHUSETTS INSTITUTE OF TECHNOLOGY
June 2011
@
Massachusetts Institute of Technology 2011. All rights reserved.
Author ...
Department ot Electrical hnEineerin anai uomputer !cience
May 16, 2011
Certified by...
Ramachandra R. Dasari
Associate Director, G. R. Harrison Spectrosco pyatory
Certified by...
f7
itajeev J. Ram
Professdr of Electrical Engineering
Associate Director, Research Laboratory of Electronics
)
Thai.q
,iinervisor
Accepted by...
LLesliWAV Kolodziejski
Professor of Electrical Engineering
Chair, Department Committee on Graduate Students
Clinical Feasibility of Raman Spectroscopy for Quantitative
Blood Glucose Measurement
by
Chae-Ryon Kong
Submitted to the Department of Electrical Engineering and Computer Science on May 16, 2011, in partial fulfillment of the
requirements for the degree of
Doctor of Philosophy in Electrical Engineering and Computer Science
Abstract
Diabetes mellitus is a leading cause of morbidity and mortality worldwide, and close monitoring of blood glucose levels is crucial for its diagnosis and management. Cur-rently, blood glucose monitoring is done by blood withdrawal or through invasive access to the interstitial fluid. While Raman spectroscopy has been studied as a possible non-invasive optical technique for measuring blood glucose, it still faces sev-eral practical difficulties. These include tissue turbidity and autofluorescence, the lag between blood and interstitial fluid glucose concentrations, and the inherently weak intensity of aqueous glucose Raman signatures with respect to those of the interfering tissue.
This thesis investigates the feasibility of using Raman spectroscopy as a non-invasive technique for blood glucose monitoring, and studies different strategies to overcome the barriers to clinical application. In particular, the study proposes a dynamic con-centration correction scheme to correct for the calibration errors arising from the lag between glucose concentrations in the bloodstream and the interstitial fluid. In addition, Monte Carlo simulations were employed to study the differences in the distribution of Raman scattered photons along the depth of the tissue between back-scattered and transmission mode Raman spectroscopy. Finally, a portable clinical Ra-man spectroscopy unit was developed utilizing a non-imaging optical element called a compound hyperbolic concentrator (CHC). The CHC coupled with a matching focus-ing lens efficiently collects and collimates Raman light from highly scatterfocus-ing tissues, while maintaining much smaller physical dimensions than a compound parabolic con-centrator.
Using the clinical instrument, skin Raman spectra were collected from healthy hu-man subjects undergoing oral glucose tolerance tests, while the corresponding refer-ence blood glucose concentrations were measured simultaneously with a conventional finger-stick glucose meter. From these datasets, linear and non-linear multivariate cal-ibration techniques were used to relate the Raman spectral intensities to the glucose
concentrations. The calibrated algorithms were then tested to demonstrate clinical accuracy as required by the Food and Drug Administration and the International Organization for Standardization. Despite the remaining challenges, the promising results obtained in this study provide important insights required in the clinical trans-lation of Raman spectroscopy for non-invasive blood glucose monitoring.
Thesis Supervisor: Ramachandra R. Dasari
Title: Associate Director, G. R. Harrison Spectroscopy Laboratory
Thesis Supervisor: Rajeev J. Ram Title: Professor of Electrical Engineering
Acknowledgments
My research at the Spectroscopy Laboratory would not have been possible without the help from many people. First of all, I would like to thank the late Professor Michael Feld, whose vision and pioneering spirit opened up many different possibilities in the field of biomedical optics and spectroscopy. Even until his last few months, he expressed his enthusiasm for this work and challenged us with the most relevant and difficult questions. I am indebted to the Spectroscopy Laboratory associate director and thesis supervisor Dr. Ramachandra Dasari, who has provided invaluable guidance in research, logistics and many other aspects with great patience and care since my first day at the Spectroscopy Laboratory. I am also grateful to Professor Rajeev Ram for agreeing to co-supervise my thesis when I was an orphaned graduate student who has just lost his thesis supervisor. I would also like to thank Professor Erich Ippen and Professor Cardinal Warde for serving on my thesis commitee and providing helpful advice and encouragement.
I thank Dr. Ravi Thadhani, Catherine Ricciardi, Ilene Horvitz and Helene Cyr who generously provided access to the MIT General Clinical Research Center facili-ties and assistance with human subject experiments. I would also like to thank the current and former members of the Spectroscopy Laboratory for their help during various stages of my research and other responsibilities in the laboratory, ranging from designing an intravascular spectroscopic probe for atherosclerosis detection, in-vestigating the use of Brillouin scattering for biological tissues, developing clinical instruments for donation to clinical investigators, and finally the clinical feasibility study for Raman glucose detection: Obrad S6epanovi6, Zoya Volynskaya, Gajendra Singh, Ishan Barman, Luis Galindo, Chung-chieh Yu, Wonshik Choi, Yongjin Sung, Zahid Yaqoob, Niyom Lue, Narahara Chari Dingari, and Jeon-woong Kang. In partic-ular, Luis Galindo played a very important role in the clinical instrument development and Ishan Barman has provided tremendous help in developing and understanding the scientific concepts. Jeon-woong Kang, Narahara Chari Dingari and Yongjin Sung helped with the human subject studies by either recruiting volunteers or participating
in the study as a subject. I would also like to thank Mark Belanger who patiently taught me how to operate the CNC machines at the Edgerton Student Machine Shop and Stephen Fulghum for his assistance and advice on Zemax simulations.
I thank Professor Terry Orlando for helping me deal with difficult times by being a great Graduate Officer at the EECS department as well as a Housemaster at Ashdown House, and Dr. Simon Lejeune for helping me cope with many series of adversities
during my life in graduate school.
Finally, I would like to thank my parents, my brother and friends for their love, prayers and support.
This research was supported by National Institutes of Health Laser Biomedical Research Center grant P41-RR02594. Part of the study was also supported by the MIT EECS department teaching assistantship and research assistantship support, as well as the Mogam Science Scholarship Foundation. The clinical study was conducted at the Clinical Research Center (CRC) at the Massachusetts Institute of Technology, supported by Harvard Clinical and Translational Science Center (UL1 RR025758), from the National Center for Research Resources. The content is solely the responsi-bility of the author and does not necessarily represent the official views of the National Center for Research Resources or the National Institutes of Health.
All clinical study protocols involving human subjects were conducted after re-ceiving approval by the MIT Committee On the Use of Humans and Experimental Subjects (COUHES).
Contents
1 Introduction 17
1.1 Objectives . . . . 18 1.1.1 Address the issue of lag between blood and ISF glucose
concen-trations . . . . 18 1.1.2 Design and construct a high-throughput and portable clinical
Raman spectroscopy system . . . . 19 1.1.3 Demonstrate clinical feasibility through human subject studies 19 1.2 Major accomplishments . . . . 19 1.3 Thesis outline . . . . 20
1.3.1 Chapter 2 Background and significance . . . . 20 1.3.2 Chapter 3 Correcting for the lag between blood and interstitial
fluid glucose . . . . 20 1.3.3 Chapter 4 Monte Carlo study of transmission mode Raman
spectroscopy . . . . 21 1.3.4 Chapter 5 Development of clinical Raman spectroscopy
instru-m ent . . . . 21 1.3.5 Chapter 6 Human clinical study . . . . 21 1.3.6 Chapter 7 Conclusion and future directions . . . . 22
2 Background and significance 23
2.1 Diabetes mellitus . . . . 23 2.2 Non-invasive and minimally-invasive glucose
2.3 NIR Raman spectroscopy for transdermal glucose detection . . . . 27
3 Correcting for the lag between blood and interstitial fluid glucose 33 3.1 Introduction . . . . 33
3.2 Dynamic concentration correction . . . . 35
3.3 Formulation of prediction uncertainty arising from physiological lag 41 3.3.1 Limiting uncertainty due to physiological lag without DCC . 42 3.3.2 Limiting uncertainty due to physiological lag with DCC . . . . 45
3.4 Materials and methods . . . . 46
3.4.1 Implementation of DCC on simulated Raman spectra . . . . . 47
3.4.2 Implementation of DCC on Raman spectra measured from hu-man subjects . . . . 50
3.5 Results and discussion . . . . 52
3.5.1 Implementation of DCC on simulated Raman spectra . . . . . 52
3.5.2 Implementation of DCC on Raman spectra measured from hu-man subjects . . . . 56
3.6 Conclusion . . . . 59
4 Monte Carlo study of transmission mode Raman spectroscopy 61 4.1 Introduction . . . . 61
4.2 Estimation of transmitted and back-scattered light power . . . . 64
4.3 Monte Carlo simulation of Raman scattering in thin multi-layered skin tissue . . . . 66
4.4 Results and discussion . . . . 70
4.4.1 Effect of tissue scattering coefficients . . . . 71
4.4.2 Effect of tissue thickness . . . . 71
4.4.3 Effect of Raman scattering coefficient . . . . 75
4.5 Conclusion . . . . 77
5 Development of clinical Raman spectroscopy instrument 79 5.1 Introduction . . . . 79
5.2 The compound parabolic concentrator 5.3 The compound parabolic concentrator .
5.3.1 Designing the CPC . . . . 5.4 The compound hyperbolic concentrator
5.4.1 Advantage of CHC over CPC . 5.4.2 Designing the CHC . . . . 5.5 Manufacturing the CPC and CHC . . . . 5.6 The clinical Raman spectroscopy system 5.7 System performance . . . .
5.7.1 Throughput . . . . 5.7.2
5.7.3
Minimum detectable glucose conce Clinical data collection . . . .
. . . . 81 . . . . 84 . . . . 86 . . . . 86 . . . . 89 . . . . 92 . . . . 97 . . . . 101 . . . . 101 ntration . . . . 104 . . . . 104 5.8 Conclusion . . . . 6 Human clinical study 6.1 Introduction . . . . 6.2 Materials and methods . . . . 6.2.1 Reference blood glucose measurements . . . . 6.2.2 Arrangement of instruments and the human subject 6.2.3 Data acquisition and OGTT protocol . . . . 6.3 Results and discussion . . . . 6.3.1 Tissue autofluorescence removal . . . . 6.3.2 Calibration model development . . . . 6.3.3 Verification of calibration . . . . 6.3.4 Leave-one-out cross validation . . . . 6.3.5 Prospective prediction on different days . . . . 6.4 Conclusion . . . . 7 Conclusion and future directions 7.1 Review of objectives and accomplishments . . . . 105 107 .. . .. ... 107 . . . . 108 . . . . 108 . . . . 109 . . . . 110 . . . . 111 ... .. .... 111 . . . . 113 ... .. .... 113 .. ... ... 119 . . . . 122 . . . . 127 131 131 . . . . 80
7.1.1 Address the issue of lag between blood and ISF glucose concen-trations . . . . 131 7.1.2 Design and construct a high-throughput and portable clinical
Raman spectroscopy system . . . . 132 7.1.3 Demonstrate clinical feasibility through human subject studies 132 7.2 Future directions . . . . 133
A List of abbreviations 135
B Optical fiber bundle for CHC-based transmission mode Raman
spec-troscopy setup 139
List of Figures
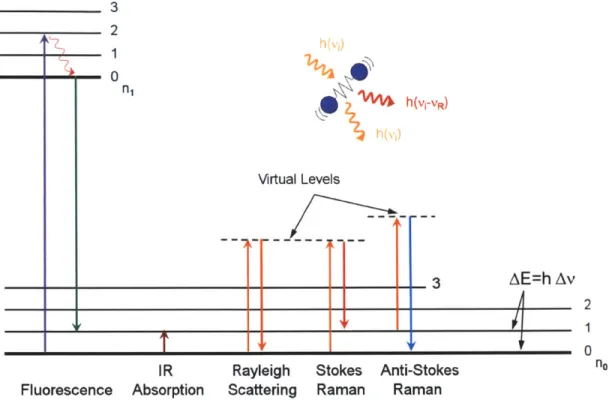
2-1 Jablonski diagram describing the transition of electronic states for
var-ious spectroscopic modalities. . . . . 27
2-2 The molecular vibrational and rotational modes of aqueous D-glucose Raman spectrum. . . . . 28
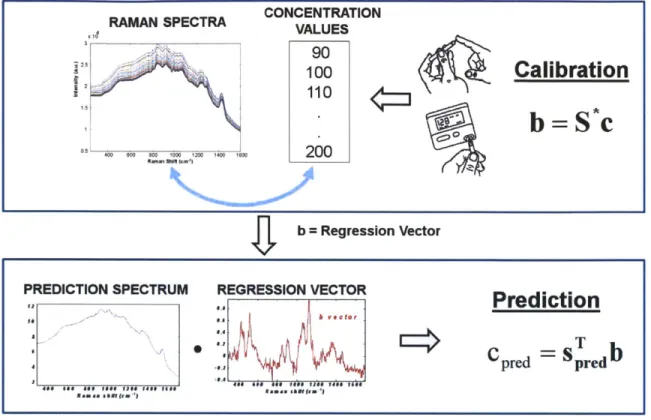
2-3 Spectral calibration and prediction by partial least squares regression. 29 3-1 Conventional linear regression flowchart. . . . . 36
3-2 DCC-based linear regression flowchart. . . . . 37
3-3 Uncertainty in glucose prediction due to physiological lag. . . . . 44
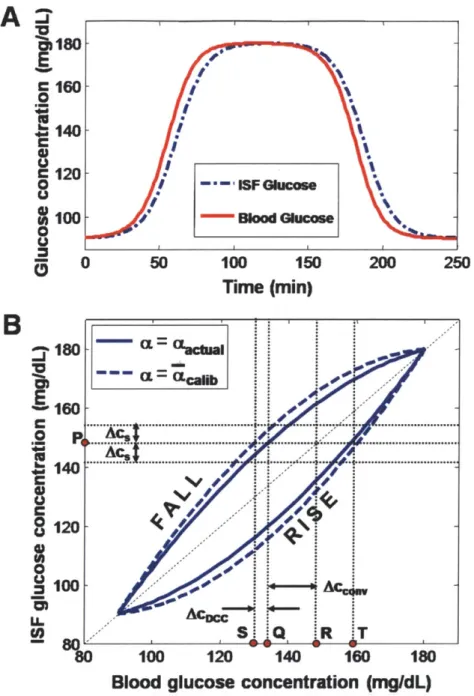
3-4 Blood and ISF glucose concentration-time profiles. . . . . 48
3-5 ISF glucose concentrations plotted against the corresponding blood glucose concentrations. . . . . 49
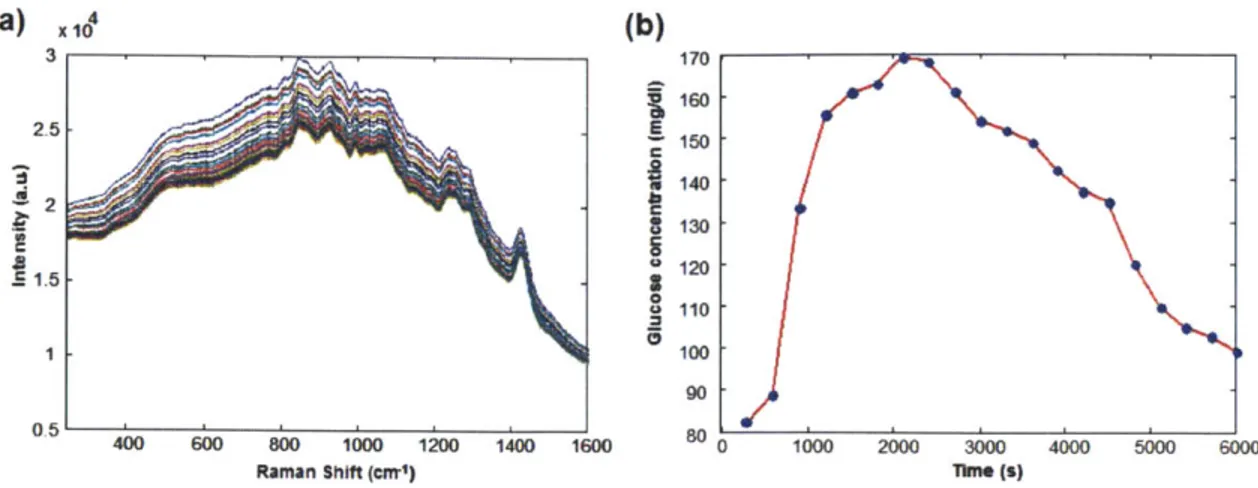
3-6 Raman spectra and glucose profile during OGTT. . . . . 51
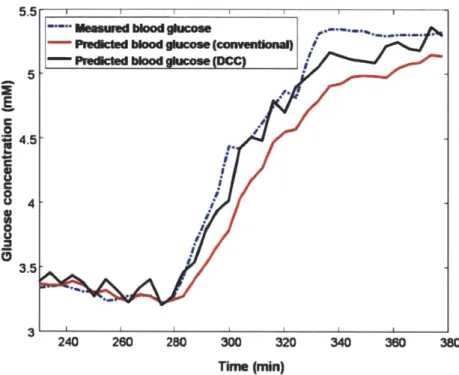
3-7 Cross-validation results of conventional and DCC calibration methods. 53 3-8 Prospective prediction results of conventional and DCC calibration m ethods. . . . . 54
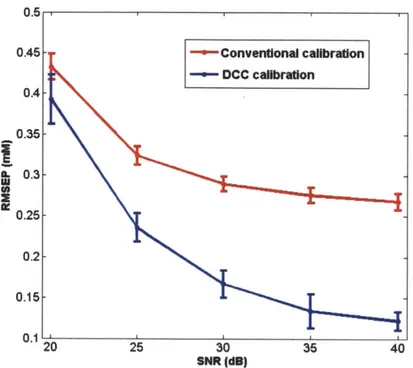
3-9 RMSEP vs. SNR with and without DCC. . . . . 55
4-1 The multiple layers of human skin tissue. . . . . 62
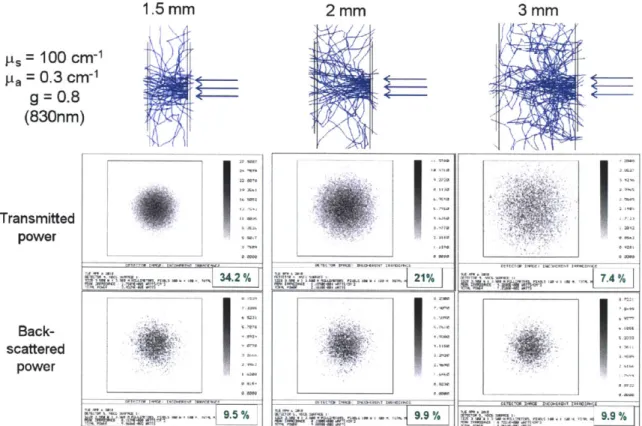
4-2 Zemax simulations of light transmission and back-scattering in thin skin tissues. . . . . 65
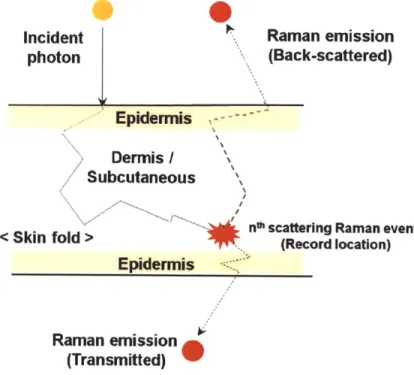
4-3 Photon migration in skin tissue during a Raman scattering event. . . 66
4-4 Flowchart for Monte Carlo simulation of photon transport and Raman scattering in skin tissue. . . . . 68
4-5 Tissue depth profile of the locations of Raman scattering for a typical thenar skin fold. . . . . 4-6 Skin tissue fold depth profile of the locations of Raman scattering for
different scattering coefficients. . . . . 4-7 Skin tissue fold depth profile of Raman scattering for different tissue thicknesses. . . . . 4-8 Skin tissue fold depth profile of Raman scattering for different Raman
scattering coefficients. . . . .
5-1 Compound parabolic concentrator (CPC) coupled to an optical fiber
5-2 5-3 5-4 5-5 5-6 5-7 5-8 5-9 5-10 5-11 5-12
bundle for enhanced Raman light collection. . . . . Compound parabolic concentrator (CPC). . . . . rMajor for 6tendue conservation and CPC. . . . .
rminor
Ratio of quantities described in Fig. 5-3. . . . . Comparison of collection performance in different reflectors. Optimization of CPC input aperture radius. . . . . CPC lengths vs. maximum collimation half angles... Comparison of CPC and CHC. . . . . CHC Design parameters. . . . . ZEMAX simulation for design verification. . . . . Manufacturing the CPC and CHC. . . . . Testing the performance of CPC. . . . .
5-13 Transmission mode clinical Raman spectroscopy setup with CHC. . . 5-14 CHC-based clinical Raman spectroscopy instrument used for human
subject studies. . . . . 5-15 Back-scattered mode Raman spectroscopy system with an optical fiber probe. . . . . 5-16 Estimation of minimum detectable glucose concentration. . . . .
6-1 Glucose analyzers used for reference blood glucose measurements. 6-2 Calibration results for MIT CRC SureStep Flexx glucometers...
80 81 . . . . . 83 . . . . . 84 85 . . . . . 87 . . . . . 89 . . . . . 90 . . . . . 91 . . . . . 93 . . . . . 94 . . . . . 95 98 100 102 103 108 109
6-3 The clinical Raman spectroscopy instrument located next to a hospital bed at the MIT CRC. . . . . 110 6-4 Thenar skin fold Raman spectra collected from one human subject
during OGTT. . . . .111 6-5 PLS calibration performed on clinical Raman spectroscopy and blood
glucose concentration data . . . . 112 6-6 Verification of calibration by predicting on calibration data. . . . . . 116 6-7 Verification of calibration with DCC by predicting on calibration data. 117 6-8 Time course of glucose concentrations measured during an oral glucose
tolerance test. . . . . 118 6-9 Leave-one-out cross-validation performed on clinical data. . . . . 120 6-10 Leave-one-out cross-validation with DCC performed on clinical data. 123 6-11 Prospective prediction performed on one human subject. . . . . 124 6-12 Prospective prediction performed with DCC on one human subject. 125 6-13 Prospective prediction performed on 5 human subjects. ... 128 6-14 Prospective prediction performed with DCC on 5 human subjects. . . 129
List of Tables
3.1 Summary of cross-validation results with and without DCC. ... 56
4.1 Reflectance, transmittance and Raman scattering in tissues with dif-ferent thicknesses (3 mm, 4 mm and 5 mm). . . . . 74
5.1 System throughput comparison. . . . . 101
A.1 List of abbreviations I . . . . 136
Chapter 1
Introduction
Diabetes mellitus is a debilitating disease characterized by the impaired blood glucose regulation, and it continues to affect increasing number of people worldwide. A close monitoring of blood glucose level is essential for effective diagnosis and management of the disease, but currently this is achieved by frequent blood withdrawal and other invasive methods. This is not only inconvenient for most diabetics, but also presents tremendous difficulties to individuals with needle phobia and Type I diabetic children. Clearly, a non-invasive glucose monitoring technique would significantly improve the patients' quality of life, as well as compliance to glucose monitoring.
Raman spectroscopy has been studied as a promising candidate for non-invasive optical blood glucose measuring technique. During a Raman event, the inelastic scattering causes the incident photon to lose energy by the amount specific to the particular vibrational and rotational modes of the interacting molecule. As such, the resulting Raman spectrum provide exceptional chemical specificity. In addition, since the intensity of Raman spectrum is proportional to the concentration of the interact-ing molecule, analyzinteract-ing the aggregate Raman spectrum by multivariate calibration techniques allows for an accurate quantification of the individual chemical compo-nents. Many laboratory based, proof-of-principle experiments have been performed to demonstrate the potential of Raman spectroscopy to accurately measure blood glucose concentrations in a non-invasive manner.
seen in the daily clinical setting due to many remaining practical challenges. For example, the non-invasive nature of transdermal Raman spectra collection precludes direct measurement of blood glucose and this limits the optical tissue sampling vol-ume to the interstitial fluid (ISF) space. While the blood glucose concentration is the clinically relevant parameter, the ISF glucose level as measured by non-invasive Raman spectroscopy is an indirect indicator for blood glucose. This leads to com-plications in calibration steps during rapid changes in glucose levels, such as after a meal or insulin administration, due to the time lag between the blood and interstitial fluid glucose concentrations during these non-equilibrium states. In addition, sponta-neous Raman scattering is an inherently weak phenomenon, and collection of Raman spectra from humans in a clinical setting requires specially designed high-throughput spectroscopic instruments that are also compact enough to be portable. Previous human subject studies for glucose detection have mainly been conducted using a sta-tionary laboratory-based Raman spectroscopy setup.
This thesis aims to demonstrate the clinical feasibility of accurate and non-invasive glucose concentration measurements by Raman spectroscopy on a population of hu-man subjects. For this purpose, a high throughput and portable clinical Rahu-man spectroscopy system is designed and constructed. In addition, potential solutions are provided for the aforementioned challenges.
1.1
Objectives
1.1.1
Address the issue of lag between blood and ISF glucose
concentrations
The effect of the lag between blood and ISF glucose concentrations on the spectro-scopic calibration and prediction performance had to be characterized. Based on the insight provided by this analysis, a potential solution to the problem needed to be presented.
1.1.2
Design and construct a high-throughput and portable
clinical Raman spectroscopy system
This objective required satisfying two seemingly conflicting goals of achieving high throughput while maintaining compactness for practical clinical application. Previous laboratory-based Raman spectroscopy setups had to be studied in order to identify the targets of optimization, while new non-imaging optical elements were to be in-vestigated for their potential to enhance light collection efficiency. In addition, the implications of collecting tissue Raman spectra in the transmission mode had to be investigated.
1.1.3
Demonstrate clinical feasibility through human subject
studies
The completed clinical instrument was to be used for collecting Raman spectra from human subjects in a clinical setting. The collected Raman spectroscopy and blood glucose data were to be analyzed to determine the glucose measurement performance
and clinical feasibility.
1.2
Major accomplishments
*
The problem of the time lag between blood and ISF glucose concentrations was investigated and a viable solution has been developed. The new calibration scheme was termed "dynamic concentration correction" (DCC) which showed significant improvement in spectroscopic calibration and glucose prediction per-formance during rapid changes in glucose levels.* A high throughput and portable clinical Raman spectroscopy instrument has been designed and constructed using a compound hyperbolic concentrator (CHC). The distribution of Raman scattering events along the depth of the skin tis-sue was simulated by Monte Carlo methods for both back-scattered mode and
transmission mode. The simulation studies revealed potential advantages of transmission geometry over back-scattered mode.
o The clinical instrument was used successfully for collecting Raman spectra from human subjects undergoing OGTT. Different calibration and prediction schemes were used on the same data to compare their relative performance. The analysis of the clinical data indicated that when used for the measurement of glucose concentrations on the same skin tissue site under identical measurement condi-tions, the performance of the Raman spectroscopy instrument was good enough to meet the requirements of the U.S. Food and Drug Administration as well as the International Organization for Standardization. However, the study also revealed potential difficulties arising from the change in measurement site and conditions.
1.3
Thesis outline
1.3.1
Chapter 2 Background and significance
This chapter describes the prevalence and types of diabetes and motivates the need for a non-invasive glucose monitoring technique. It also reviews other minimally invasive and non-invasive glucose monitoring techniques, and introduces NIR Raman spectroscopy as a promising candidate while emphasizing its advantages over other techniques.
1.3.2
Chapter 3 Correcting for the lag between blood and
interstitial fluid glucose
This chapter describes the presence of the lag between blood and interstitial fluid glucose concentrations during rapid changes in glucose levels, and how it affects spec-troscopic calibration and prediction accuracy, as well as the uncertainty in the pre-dicted glucose concentration. Then DCC was derived and presented as a potential
solution to this problem, and a new expression was derived to describe the prediction uncertainty under DCC implementation.
1.3.3
Chapter 4 Monte Carlo study of transmission mode
Raman spectroscopy
In this chapter, a numerical simulation study was designed and performed to gain a better understanding of the differences between Raman spectra collected in back-scattered mode and transmission mode geometries. Particular emphasis was placed on observing the distribution of the Raman scattering events along the depth of the tissue, under the two different collection geometries.
1.3.4
Chapter 5 Development of clinical Raman spectroscopy
instrument
This chapter elaborates the design and construction of a portable clinical Raman spectroscopy instrument. In particular, the purpose and the design of the non-imaging optical element, CHC, was described in detail. The clinical instrument shown in this chapter was used in the human subject studies described in Chapter 6.
1.3.5
Chapter 6 Human clinical study
This chapter describes the human subject study conducted at the MIT Clinical Re-search Center (MIT CRC) using the clinical instrument shown in Chapter 5. The Raman spectra and blood glucose concentration values were used to create calibra-tion models by partial least squares (PLS) regression and support vector regression (SVR). Also, the effect of implementing DCC and removing tissue autofluorescence in the Raman spectra by low order polynomial fitting was observed when performing glucose calibration and prediction analyses.
1.3.6
Chapter 7 Conclusion and future directions
In this chapter, the objectives and major accomplishments were reviewed. Potential future directions are suggested based on the new insights obtained from this study.
Chapter 2
Background and significance
2.1
Diabetes mellitus
Diabetes mellitus represents a leading cause of morbidity and mortality worldwide, affecting nearly 285 million people in 2010, and expected to affect 438 million by 2030 [1]. In 2010 alone, 4 million people died from diabetes worldwide [1]. Diabetes is characterized by an impairment of blood glucose regulation. In Type I diabetes, a pathology in the pancreas causes insufficient production of insulin, which is normally secreted in response to high blood glucose levels in order to promote glucose uptake by the tissues. These patients typically require external administration of insulin for proper blood glucose management. Type II diabetes is caused by the body's re-duced sensitivity to insulin, usually arising as a complication of obesity [2]. Finally, gestational diabetes can occur in pregnant women who were not diabetic prior to the pregnancy. While gestational diabetes normally resolves with the end of preg-nancy, in some cases it may have adverse effects on the fetus such as macrosomia, in which the baby becomes overweight due to abnormally high blood glucose levels. Prolonged exposure to high levels of blood glucose accompanies many morbid com-plications such as blindness and a variety of neurovascular diseases. Therefore, it is essential to frequently monitor the blood glucose levels for successful management of the disease. Currently, blood glucose monitoring is achieved by frequent withdrawal of blood or other invasive means. Due to the inconvenience and invasiveness of these
methods, many diabetics fail to comply with glucose monitoring. In particular, at least 10% of the U.S. population is affected by needle phobia that can trigger fainting episodes with needle piercing [3], and needle-phobic individuals who are also diabetic have extreme difficulty in managing their conditions [4]. Therefore, a non-invasive method of measuring blood glucose level would greatly benefit the increasing number of diabetics worldwide.
2.2
Non-invasive and minimally-invasive glucose
monitoring techniques
Most electrochemical glucose sensors currently used in the clinic employs the glucose oxidase enzymatic reaction:
#-D-glucose+0
2 -+ D-glucono-1,5-lactone+
H202where gluconic acid and hydrogen peroxide (H202) are generated. The hydrogen
peroxide can then be detected with a platinum electrode. These sensors have been adapted in the form of a needle, which can be implanted subcutaneously for continu-ous glucose monitoring (e.g., Minimed by Medtronic Inc. and FreeStyle Navigator by Abbott Laboratories). However, these minimally invasive sensors need to be replaced about once a week due to build up of biomaterial residues on the sensor surface, which interferes with glucose measurement. Another commercial continuous glucose monitoring device, the GlucoWatch by Animas, used reverse iontophoresis to ex-tract interstitial fluid from the skin tissue and measured glucose with electrochemical sensors [5]. However, this sensor faced practical problems of frequent disruption in glucose sensing by sweating, and is no longer in production.
Many researchers have looked into optical techniques for non-invasive glucose de-tection [6]. For example, Esenaliev et al. proposed the use of optical coherence tomography for glucose detection, by observing the variation of tissue optical scatter-ing parameter (p-,) induced by changes in the glucose concentration [7]. The optical scattering coefficient
j,
and the reduced scattering coefficient p' depend on themis-match of the refractive index of the interstitial fluid (1.348 to 1.352 in near infrared [8]) and the cell membranes (1.350 to 1.460 in near infrared [9]). Change in the blood glucose concentration would alter the interstitial fluid glucose concentration, which would subsequently affect the refractive index and the optical scattering pa-rameters. This effect was demonstrated in tissue phantoms [10] as well as in vivo using reflectance measurement systems [11].
King et al. suggested that glucose concentration can be measured by observing the changes in light polarization in the aqueous humor of the eye [12]. When a linearly polarized light interacts with a solution containing molecules that have a distinct chi-rality due to its asymmetric molecular structure, the plane of the linearly polarized light undergoes rotation about the axis of propagation. Since glucose molecules are
chiral (the naturally occurring D-glucose being dextrarotatory), the amount of rota-tion of the linearly polarized light depends on the concentrarota-tion of glucose present
in the tissue. However, this effect is difficult to observe in typical turbid tissues, since the scattering effects dominate over polarization effects. Therefore, King et al. suggested the observation of light polarization change by shining a linearly polarized light to the anterior chamber of aqueous humor of the eye, which is a transparent tissue with little turbidity.
Others have studied changes in the photoacoustic effect induced by different glu-cose concentrations [13, 14]. The photoacoustic effect measures the optically gener-ated acoustic signal, where a laser pulse fired onto the tissue sample gets absorbed and heats up the illuminated region, which thermally expands to generate an acoustic pressure wave that can be detected with a piezoelectric sensor. Since the viscosity of aqueous glucose solution increases with glucose concentration, the photoacoustic sig-nal would also change due to the changes in tissue glucose concentrations. Measuring and analyzing the changes in the photoacoustic signal from the tissue could lead to the detection of changes in glucose concentrations. An in vivo study involving 62 human subjects using a potentially commercializable Aprise' sensor (Glucon Inc., Boulder, CO) showed promising results [14]. In addition, Wadamori et al. showed that the measurable tissue depth can be controlled by changing the modulation frequency [15],
which can be useful for detecting glucose from tissues with layered structures such as the skin.
Evans et al. [16] investigated the glucose-induced changes in tissue autofluores-cence mediated by variations of reduced nicotinamide adenine dinucleotide (NADH) or its phosphorylated derivative, NAD(P)H from glucose metabolism. The produc-tion of these coenzymes by the skin fibroblasts and adipocytes is mediated by their glucose metabolism, and their measured autofluorescence intensity and lifetime have
been found to be indirect markers for the extracellular glucose concentration [16].
All of these techniques attempt to find glucose sensitivity by observing the glucose-induced optical changes that can be detected non-invasively. However, these tech-niques often face significant challenges from the fact that the glucose-induced optical changes are not glucose-specific, and can be influenced by other physiological and anatomical variations.
In contrast, vibrational spectroscopy techniques look for glucose-specific molec-ular vibrational markers in the observed spectrum. For example, infrared absorp-tion spectroscopy is widely used in chemistry to study the vibraabsorp-tional modes of the molecular bonds, such as "stretching", "twisting", and "scissoring" modes. Since
different molecules are uniquely identified by their molecular structures, vibrational spectroscopy techniques such as infrared absorption spectroscopy and Raman spec-troscopy provide a molecularly specific marker for the target analyte. Infrared ab-sorption spectroscopy was employed in the mid-infrared (MIR) region (2.5 to 25 pm) by Heise et al. to detect glucose from the oral cavity
[17],
but faced difficulty due to limited tissue penetration depth of MIR light and person-to-person variations in MIR absorption spectra. As near infrared (NIR) light (800 nm to 2.5 tm) offers greater tissue penetration depth and generates relatively low amount of tissue aut-ofluorescence, many researchers have used NIR absorption spectroscopy to investigate non-invasive glucose detection from human subjects. Burmeister et al. and Marbach et al. employed NIR absorption spectroscopy to detect glucose from the oral cavity [18, 19], while other groups targeted the forearm [20, 21] and fingertip [22, 23]. While NIR absorption spectroscopy provides molecularly specific information with highop-3 2 0 h(Vi-VR) Virtual Levels
T
v
3
AE=h AvA
T_
i
Fluorescence IR AbsorptionRayleigh Stokes Anti-Stokes Scattering Raman Raman
Figure 2-1: Jablonski diagram describing the transition of electronic states for various spectroscopic modalities.
tical intensities, its broad spectral features often limit its specificity. This was the main reason behind the failure of Diasensor by Bico, which was a NIR absorption spectroscopy based glucose monitoring device that was briefly introduced commer-cially in Europe, only to be abandoned eventually. On the other hand, NIR Raman spectroscopy provides similar molecular vibrational and rotational information while also offering much sharper spectral features and superior molecular specificity than NIR absorption spectroscopy.
2.3
NIR Raman spectroscopy for transdermal
glu-cose detection
Raman spectroscopy can be performed with light at any wavelength, and its spectral intensity increases with the light frequency to the fourth power. Also, ultraviolet
S A ~6(C-C-0) stretch (1200-1500cm1) 2 - 6(0-C-H), 6(C-C-H) , CH2, 6(C-0-H) bending 1.5- 0.5-20o 600 800 100 12'00 100 1600 Wavenumber (cmr')
Figure 2-2: Raman spectrum of aqueous D-glucose with the molecular vibrational and rotational modes labeled based on [24].
resonance Raman spectroscopy can provide very high spectral intensities. However, the NIR spontaneous Stokes Raman spectroscopy is often preferred for biological tissue analysis, for similar reasons as in the case of NIR absorption spectroscopy:
" Deeper tissue penetration depth.
" Relatively weaker tissue autofluorescence.
" Less photodamage to the tissue.
Unlike NIR absorption spectroscopy, NIR Raman spectroscopy does not suffer from the adverse effect of NIR light absorption by water. While the large absorption of NIR light can attenuate tissue NIR absorption spectral features, NIR Raman features of water are not strong components of the tissue Raman spectrum. The molecular vibrational and rotational modes of aqueous D-glucose Raman spectrum is shown in Fig. 2-2. Despite its excellent chemical specificity, the disadvantage of NIR Raman spectroscopy is that its optical signal is very weak, as typically less than one out of
RAMAN SPECTRA CONCENTRATIONVALUES 100
Calibration
110bS~c
200 b = Regression VectorPREDICTION SPECTRUM REGRESSION VECTOR
1a #8o Prediction
C
pred=Sb
pred 460 go at* lot ee 0,. 0#~ 16#0.ANO shllfew'Ran as abst(e*'J
Figure 2-3: Spectral calibration and prediction by partial least squares regression.
a million photons undergo a spontaneous Raman scattering event. To make matters worse for transdermal glucose detection, the Raman cross section of aqueous glucose is very small (5.6 x 10⁻³⁰ cm2 molecule-1 sr-', at 514.5 nm [25]). For this rea-son, recent studies have suggested the use of surface enhanced Raman spectroscopy to amplify the glucose sensitivity [26]. Since surface enhanced Raman spectroscopy alone would amplify all chemical species near the gold or silver substrate, this study increased the glucose sensitivity by functionalizing the silver substrate surface with a layer of molecules of high affinity to glucose molecules (specifically, 1-decanethiol [HS(CH2)9CH3] [26]). Since the Raman surface enhancement effect needs close
prox-imity to the silver or gold substrate surface, the increased glucose affinity of the functionalized substrate would allow for a selective enhancement of glucose detection
[26].
Early attempts to detect blood glucose concentration by Raman spectroscopy in-volved a direct analysis of whole blood samples [27, 28]. These studies used partial
least squares (PLS) regression to analyze the blood constituents. Figure 2-3 shows a schematic diagram describing the PLS calibration and prediction procedures. The Raman spectral intensities were related to the corresponding reference blood glucose values by a regression vector called the "b" vector during the calibration procedure. Once calibrated, the b can be used on a prospective Raman spectrum to extract its corresponding blood glucose concentration. More advanced and sophisticated cali-bration techniques were developed later on, in order to improve the robustness and glucose specificity of the calibration [29, 30]. These include the Hybrid Linear Analysis (HLA) [29] and Constrained Regularization (CR) [30]. Ideally, if the concentrations for all constituents of the tissue Raman spectra are known, an explicit calibration method such as ordinary least squares can be used to construct a comprehensive and accurate calibration algorithm. However, these explicit calibration methods break down when the tissue constituents are misrepresented due to lack of accurate infor-mation about the tissue constituents. On the other hand, implicit calibration methods such as PLS only require the concentration of the analyte of interest, and therefore tend to be more robust. Since the Raman spectrum of a pure glucose solution can be measured separately, HLA attempts to extract the advantages of both explicit and implicit calibration algorithm, by incorporating the information about the glucose Raman spectrum into the implicit calibration [29]. This can be done by subtracting the glucose Raman spectrum (appropriately scaled according to the known glucose concentration of the calibration samples) from the tissue Raman spectra to remove the glucose contribution to the overall tissue Raman spectra:
Sb = S - ka (2.1)
where S is the matrix of Raman spectra obtained from the calibration samples, a is the Raman spectrum of unit concentration of glucose, and k is the concentration of glucose present in the calibration samples [29]. Then the principal components of Sb are used to generate a matrix of orthogonal basis spectra V. The residual portion of
a that is orthogonal to V is calculated as:
r = a - aVTV (2.2)
which can be used to obtain the HLA regression vector
b = r/ (a - r). (2.3)
Similarly to HLA, CR performs implicit calibration with explicit constraint specified by the known glucose Raman spectrum, but it attempts to improve robustness by employing Tikhonov regularization [31]. Both HLA and CR showed encouraging results with numerically simulated Raman spectra and tissue phantoms [29, 30].
Eventually, Enejder et al. successfully demonstrated in vivo glucose detection by collecting Raman spectra from the forearms of human subjects undergoing an oral glucose tolerance test (OGTT), while Chaiken et al. used tissue modulation on human finger tip to collect the blood Raman spectrum in vivo, which was subsequently used to estimate glucose concentration [32]. Here, "tissue modulation" refers to the measurement of two separate Raman spectra from the same tissue site, with and without the application of external physical pressure. Applying physical pressure to the tissue squeezes out the blood and interstitial fluid from the tissue site, while removing such pressure restores blood and interstitial fluid perfusion. By measuring the Raman spectra under these two conditions and subtracting one spectrum from the other, the residual Raman spectrum can (in principle) represent the net signal arising from the blood and interstitial fluid alone [32]. Since glucose is present in the blood and interstitial fluid, this tissue modulation method would, if successful, remove the Raman spectral contributions from the interfering tissue constituents and improve the glucose specificity.
More recently, Shih et al. and Barman et al. proposed to use the diffuse re-flectance spectrum to remove the undesirable turbidity-induced Raman spectral in-tensity variations [33, 34, 35]. In addition, it has been suggested that calibration errors introduced by spurious correlations between tissue autofluorescence photobleaching
and the glucose concentration can be reduced by applying autofluorescence removal techniques [36, 37, 38]. Finally, it has been shown that a non-linear regression tech-nique called support vector regression (SVR) could significantly improve the spectral calibration and glucose prediction performance over conventional linear partial least
squares (PLS) technique [39].
However, these promising recent developments still do not cover all remaining issues that need to be resolved before transdermal glucose monitoring by Raman spectroscopy can become a routine clinical practice. The following chapter describes the problem of the lag between blood and interstitial fluid glucose concentrations and presents a potential solution. The later chapters will describe the study of trans-mission mode Raman spectroscopy, efforts for clinical instrument development, and the human subject studies conducted to verify the clinical feasibility of transdermal glucose monitoring by Raman spectroscopy. Finally, the last chapter will discuss the remaining challenges and suggests potential future directions based on the new insights obtained from this study.
Chapter 3
Correcting for the lag between
blood and interstitial fluid glucose
3.1
Introduction
From the thick aorta down to the few micron-thick capillary vessels, the blood circu-latory system permeates most parts of the human body. By the constant pumping action of the heart, the blood never ceases to transport nutrients and waste products to and from the living tissues to maintain homeostasis. For this reason, the glucose metabolism of the entire body can be monitored in the clinic by analyzing the blood samples withdrawn from the finger tip. However, blood is contained within the cir-culatory system, and the exchange of nutrients with the surrounding tissues occurs through the capillary wall by hydrostatic and osmotic pressures, as well as by passive diffusion. This happens in the fluid that fills the space between the capillaries and the surrounding cells, which is called the interstitial fluid (ISF). The exchange of glucose molecules between the blood vessels and the ISF continue until the glucose concentrations in the two compartments reach equilibrium. This equilibrating process takes time (typically on the order of 20 minutes in healthy humans), and the time lag leads to temporary differences between the glucose concentrations in the blood and the ISF, especially during rapid changes in glucose levels such as immediately after a meal ingestion or insulin administration. This leads to challenges in non-invasive
and minimally invasive glucose detection techniques, which typically monitor glucose levels from the ISF. For the case of NIR Raman spectroscopy, the NIR light pene-trates the skin about 1 mm. At this depth, the blood capillaries are not very dense, contributing only about 5% of the skin volume, while the ISF constitutes nearly 45% [40, 41]. Therefore, the optical sampling volume mostly comprises of the ISF glucose. Similarly, minimally invasive electrochemical sensors such as Medtronic Min-imed Guardian and FreeStyle Navigator from Abbott Diabetes Care are implanted under the skin to monitor the ISF glucose. In both cases, complications arise from the fact that reference glucose measurements for calibration are made from blood glu-cose. As pointed out by Cengiz and Tamborlane [42], the physiological lag introduces systematic errors during calibration which adversely impact long-term sensor perfor-mance, even in the presence of a positive correlation between blood and ISF glucose [43, 44, 45]. Such diagnostic errors may lead to unnecessary insulin administration, which could lead to a dangerous degree of hypoglycemia. While this calibration er-ror could be avoided by performing all measurements under equilibrium conditions, obtaining multiple calibration measurements at different glucose levels would require employing sophisticated and riskier glucose clamp techniques, where the glucose is artificially infused into the bloodstream and the infusion rate is carefully controlled to maintain a steady plasma glucose level [46]. Moreover, even if calibration was done accurately, the lack of knowledge of glucose kinetics in prediction samples would in-troduce an uncertainty in the concentration estimates.
In order to account for the differences in blood and ISF glucose, Freeland and co-workers developed a model where the ISF and blood glucose were considered to reside in two compartments [47, 48]. By relating the glucose concentrations in the two compartments with a simple mass transfer model across a semipermeable mem-brane, accurate estimates of blood glucose concentration could be extracted from subcutaneous ISF electrochemical sensor measurements. This chapter introduces a new spectroscopic calibration scheme using dynamic concentration correction (DCC), which is based on a on a similar two-compartment mass transfer model [4 9]t. While
"Ac-Freeland and co-workers developed the two-compartment mass transfer model to ex-plain the glucose lag observed in implantable electrochemical glucose sensors, cur-rently no analogous models exist for spectroscopic calibration algorithms, which are inherently more complex due to the multivariate nature of the data. By using DCC, blood and ISF glucose concentrations are interconverted at the appropriate stages of spectroscopic calibration and prediction to form an accurate and consistent regres-sion model. The resulting regresregres-sion model can then be used on a new set of acquired spectral samples to accurately predict the blood glucose concentrations. In addition, an analytical expression is derived to describe the limiting uncertainty arising from the presence of the lag between blood and ISF glucose concentrations.
3.2
Dynamic concentration correction
Conventional spectroscopic calibration methods use linear regression to map the spec-tral intensities to the glucose concentrations [50], which is represented as a flowchart in Fig. 3-1. During the calibration step, the regression vector b is obtained by
b = ScibCLOd (3.1)
where Sc,,ib is the matrix of calibration spectra, Sjieb is the appropriate pseudo-inverse of Scauib as evaluated by the calibration method of choice, and cblood is the vector of
measured reference concentrations of the blood glucose in the calibration samples. Since the optical spectroscopy measurements are predominantly contributed by ISF glucose, the relevant input concentrations to the implicit calibration method should also incorporate the ISF glucose concentrations for consistency. However, blood glu-cose concentration is the most clinically relevant value and, in a typical clinical set-ting, blood glucose values are used as reference concentrations since blood sample-based glucose analysis is currently the most reliable and readily available method of measurement. This inconsistency creates calibration errors in the regression vector bconventionai, as it is based on both the blood and ISF glucose concentrations which knowledgments" section.
Calibration Scalib bceantion blojod o---P red iction - - - - - - - - - - - - - - - - - - - - - -I. . .. . . . . . . .
bconventional
Vtonal --- - - --Figure 3-1: Conventional linear regression flowchart. Scalib: the matrix of calibration spectra, Sliib: a form of inverse matrix of Scoaib, cbswd: vector of measured reference blood glucose concentrations, bcventionea: regression vector obtained by conventional linear regression, sped: vector of a prediction spectrum, c: predicted glucose concen-tration.
may be significantly different during rapid changes in glucose levels.
In the prediction step, the predicted glucose concentration c, is obtained by a scalar product of the regression vector bcnventiod, and the spectrum acquired from the prediction sample s,ed as shown in the following equation:
c = sTbcoventional (3.2)
where superscript T denotes the transpose of the vector. Due to the calibration errors present in the regression vector bcoventiona, the predicted glucose concentration is
reported as the blood glucose concentration c obtained in the above conventional
-Figure 3-2: DCC-based linear regression flowchart. PC-DCC: Pre-calibration DCC, PP-DCC: Post-prediction DCC, Scabib: the matrix of calibration spectra, Smlib: a form of inverse matrix of Scalib, CboM: vector of reference blood glucose concentrations,
CISF: vector of ISF glucose concentrations, bocc: regression vector obtained by DCC, s,: vector of a prediction spectrum, ci,,d: predicted blood glucose concentration,
cISF: predicted ISF glucose concentration.
framework is not an accurate representation.
In order to correct for this discrepancy, a new calibration methodology is proposed in which the concentrations are appropriately changed to conform to the spectral measurements. Based on a two compartment mass transfer model, the dynamic concentration correction (DCC) performs transformation of glucose concentrations in two stages:
* Pre-Calibration DCC (PC-DCC)
Transform the blood glucose concentrations in the calibration data set into their corresponding ISF values before performing calibration of Eq. 3.1. This
ensures that the regression vector b is solely based on ISF glucose concentra-tions.
9 Post-Prediction DCC (PP-DCC)
After calibration, estimate the ISF glucose concentration from a prediction spectrum using Eq. 3.2. Then transform this ISF glucose concentration into the corresponding blood glucose value.
As conceptually described in the flowchart of Fig. 3-2, the purpose of these conver-sions is to ensure that the core spectroscopic calibration and prediction steps are done in a consistent manner where all glucose concentrations pertains to the ISF glucose concentration. This would reduce the calibration errors arising from the lag between the glucose concentrations in the two compartments. After the calibration and pre-diction, the ISF glucose concentration can be converted back into the corresponding blood glucose value.
In order to convert between blood and ISF glucose concentrations, a model is developed to describe the glucose transfer across the capillary vessel wall. The blood capillary wall is single endothelial cell thick, and has very small tight junction pores (2~80 nm diameter) through which glucose can be transported by osmotic pressure and passive diffusion across an established concentration gradient [51]. The glucose transfer rate is affected by several variables, such as the rate of blood flow, rate of glucose uptake by the surrounding tissue, and capillary permeability which varies in different anatomical sites. Nevertheless, a simple two-compartment model can be used to describe the macroscopic picture of glucose transfer across the capillary membrane [47, 52, 53]. The change in glucose concentrations within the skin ISF volume, VISF,
can be described as follows:
VISF = kM A(CBG - CISF) - kUVISFCISF (3.3)
dt
where CISF and CBG are the ISF and blood glucose concentrations (mol/cm3), km is the glucose mass transfer coefficient (cm/s), A is the effective mass transfer surface area
ku is affected by the amount of insulin present in the bloodstream, it can be assumed to be constant due to the observed results that the glucose uptake in subcutaneous skin tissues is largely unaffected by the local insulin concentrations [52, 47]. In fact, the uptake term itself has been observed to be very small for skin tissues, unlike muscle or adipose tissues, therefore it has been ignored (ku = 0) in the analysis [47]. With these assumptions, eq. 3.3 can then be simplified to
dcISF (4
CBG = CISF + a d (3.4)
where a(= VISF/(kMA)) is a lumped mass transfer parameter having units of time. The parameter o provides a measure of the lag time arising from the glucose transport and from this point it will be referred to as the characteristic lag time constant. By using eq. 3.4, the blood glucose concentration can be estimated from the spectroscopy-based ISF glucose concentration and the knowledge of the lag time constant and the rate of change in glucose levels. This is done during the post-prediction (PP-DCC) step (Fig. 3-2). In practice, eq. 3.4 needs to be discretized in order to be implemented in digital computers. A first-order estimate of the blood glucose concentration can be obtained by using a finite difference approximation for the derivative term of eq.
3.4:
CBG(t) = CISF(t) + a CISF) - CISF(t - At) (3.5)
At
where At is the time interval between spectroscopic measurements and ISF glucose concentration estimates. With this discretized expression, the PP-DCC step can be performed in real time using digital computers. It can also be seen that at least two spectroscopic measurements of ISF glucose (at t and at t - At) are required to determine the blood glucose concentration using eq. 3.5. The time interval of measurement, At, should be short enough to capture the fastest physiological glu-cose variations, and it cannot be arbitrarily short as only a limited number of blood withdrawal is allowed during human oral glucose tolerance tests. Based on the fact that it could take as short as 20~30 minutes to reach peak glucose levels from
fast-ing level durfast-ing oral glucose tolerance tests, At was optimized to be 5-10 minutes. Other research laboratories sample blood glucose at similar time intervals ranging from 2.5 to 10 min [54, 52, 20]. To determine the values of the concentrations and their derivatives at intermediate points, spline interpolation can be employed.
In the other portion of the proposed scheme, the pre-calibration DCC (PC-DCC) step, the glucose concentrations are transformed in the opposite direction, from blood glucose to ISF glucose. In order to obtain the expression for PC-DCC, the differential
equation of eq. 3.4 can be converted into its integral form:
1 1 0f 1
CISF(tf) = cISF(ti) exp (if - ti) + - cBG eXp - (tf - ti)) dt (3.6)
a a e ti(a
where the definite integral is evaluated from time t2 to time tf. Similar to the
PP-DCC, this integral equation needs to be discretized for practical implementation. This can be achieved by performing integration by parts for the second term of eq. 3.6 and using a numerical integration technique called Simpson's rule to obtain the following equation:
CISF(tf) = CBG (tf ) + (cISF (ti) - CBG(ti)) exp
(-
ti) - 6 A (3.7)a, 6
where
A = BG (ti) eXp -tf ti + 4
0BG exp t- t) + BG (tf) (3-8)
a )( 2 2a)
Here, BG(t) refers to the derivative of CBG evaluated at t. A first-order finite
difference approximation similar to that employed in eq. 3.5 for the PP-DCC step can be used to approximate dBG(t). One complication with this formulation is that the initial ISF glucose value CISF(0) needs to be determined for the very first time window [tj = 0, tf]. This initial condition can be determined accurately when the ISF glucose and blood glucose concentrations are completely in equilibrium at the beginning of the spectroscopic calibration measurements. Under such conditions,
assumes zero glucose uptake by the skin connective tissue as in eq. 3.4). This is typically the case because oral glucose tolerance test (OGTT) protocol requires 8-12 hours of fasting so that the physiological glucose concentration would have stabilized to the fasting (steady-state) level at the beginning of the spectroscopic calibration measurements.
3.3
Formulation of prediction uncertainty arising
from physiological lag
The precision of spectroscopy-based calibration models can be quantified by using a prediction error formula derived by Lorber and Kowalski widely known in the chemo-metrics field, which describes the error propagation for linear multivariate prediction algorithms [55]. This formulation was used previously by Sdepanovid et al., to de-scribe the uncertainty in concentration prediction for the limiting case where the noise in the calibration spectra is negligible in comparison to that of the prediction spectra [56]. This is typically the case in most biomedical spectroscopy applications, since CCD or sensor acquisition times can be much longer during calibration than predic-tion. Under such conditions, when the signal-to-noise ratio (SNR) of the calibration spectra is sufficiently high in comparison to that of the prediction spectra, it can be assumed that a perfectly accurate calibration model can be developed from the calibration spectra. Uncertainty in the predicted concentrations then arises primar-ily from the spectral overlap between the analyte of interest (glucose) and the other interfering tissue constituents, and the measurement noise in the prediction spectra. Mathematically, this spectroscopic uncertainty for the analyte of interest (glucose) is given by Ac, [56]:
C = (s ± As)' -b = s' - b ± AsT -b = c ± Ac, (3.9)
where
c- -r (3.10)
![Figure 2-2: Raman spectrum of aqueous D-glucose with the molecular vibrational and rotational modes labeled based on [24].](https://thumb-eu.123doks.com/thumbv2/123doknet/14334642.498530/28.918.134.769.133.492/figure-spectrum-aqueous-glucose-molecular-vibrational-rotational-labeled.webp)