HAL Id: hal-00719803
https://hal.archives-ouvertes.fr/hal-00719803
Submitted on 24 Jul 2012HAL is a multi-disciplinary open access archive for the deposit and dissemination of
sci-L’archive ouverte pluridisciplinaire HAL, est destinée au dépôt et à la diffusion de documents
Optimization of the geopotential heights information
used in a rainfall-based weather patterns classification
over Austria
Pierre Brigode, Pietro Bernardara, Joël Gailhard, Federico Garavaglia, Pierre
Ribstein, Ralf Merz
To cite this version:
Pierre Brigode, Pietro Bernardara, Joël Gailhard, Federico Garavaglia, Pierre Ribstein, et al.. Opti-mization of the geopotential heights information used in a rainfall-based weather patterns classification over Austria. International Journal of Climatology, Wiley, 2012, pp.1097-0088. �10.1002/joc.3535�. �hal-00719803�
Optimization of the geopotential heights information used in a
rainfall based weather patterns classification over Austria.
Pierre Brigode1,2, Pietro Bernardara1,3, Joel Gailhard4, Federico Garavaglia4, Pierre
Ribstein2, Ralf Merz5
1
LNHE, EDF R&D, Chatou, France.
2
UMR 7619 SISYPHE, UPMC, Paris, France
3
Saint-Venant Laboratory for Hydraulics, Chatou, France.
4
DTG,EDF, Grenoble, France
5
Department of Catchment Hydrology, UFZ Helmholtz Centre for Environmental
Research, Halle, Germany
Corresponding author: Email: [email protected]
Key words: weather patterns, Austrian heavy rainfall, bottom-up classification,
COST733, geopotential height field, optimization, comparison, daily precipitation shape
Abstract
Classifications of atmospheric circulation patterns are useful tools to improve the
description of the climate of a given region and the analysis of meteorological
situations. In particular, weather patterns (WP) classifications could be used to improve
the description of spatial heavy rainfall. Here, a bottom up approach, previously used to
build WP classification in France, is applied for the definition of a WP classification
useful for the description of Austrian heavy rainfall. The optimal spatial extent and the
optimal position of the geopotential fields to be taken into account for a WP
classification is studied. The proposed WP classification is shown to be coherent with
the general knowledge on synoptic situations responsible for heavy rainfall over
Austria. Moreover, the classification has good performances in term of heavy rainfall
spatial description compared to 152 COST 733 classifications defined in the same
region. In particular, we show that the choice of spatial extent of the geopotential fields,
their position and their characteristics is relevant for capturing physical information on
synoptic situations responsible for heavy rainfall and that it can improve weather pattern
1. Introduction
The classification of atmospheric circulation and weather patterns is used in climate and
meteorology researches since the beginning of these sciences, see El-Kadi and Smithson
(1992), Yarnal et al. (2001), Huth et al. (2008) and Philipp et al. (2010) for reviews.
The aim of these classifications is to define a limited number of typical synoptic
meteorological situations for a given region. For instance, Kaufmann and Weber (1996)
defined a classification over the Alpine region aiming at describing the typical Alps
wind fields. In general, a circulation pattern classification is based only on geopotential
fields; while a weather pattern (WP) classification is based on one or more geopotential
fields and some other relevant meteorological variables. Here, we focus on weather
pattern classification developed for heavy rainfall spatial explanation. This type of
rainfall based weather pattern classification is able to provide information on heavy
rainfall spatial distribution using geopotential information. Indeed, Littmann (2000)
shows that geopotential fields can provide significant information on heavy rainfall
events. Boé and Terray (2008) proposed a weather pattern classification to explain
winter rainfall fields in France, while Romero et al. (1999), Trigo and DaCamara (2000)
and Martínez et al. (2008) classifications were focused on rainfall description in
Western Mediterranean region. Garavaglia et al. (2010) proposed a weather pattern
classification on France for the estimation of heavy rainfall quantiles based on a
compound distribution. These classification methodologies follow a “bottom-up approach”: the “bottom” part consists of the definition of a given number of classes
based on daily rainfall fields over a given region which are then linked to geopotential
classifications is to be more focused on “where does it rain” information rather than on “how much does it rain” information. An important motivation for using this type of
classification is that the bottom-up approach, consisting in linking the rainfall
information to the geopotential fields, could a priori be very interesting for the
exploration of future climate scenarios, giving the fact that global circulation models are
known to give more robust information on large scale features like geopotential than on
small spatial scale phenomena like rainfall (Räisänen 2007).
Traditionally, the geopotential height fields used in weather patterns classification are
centered on the region for which the classification is done. Moreover, the spatial
coverage of geopotential height fields is chosen depending on the available data and on the spatial extent of the region to be covered. However, the “optimal” classification
could a priori be defined on a geopotential field not centered on the region. We argue
that the spatial extent, the position and the characteristics of geopotential height fields
used to classify weather patterns on a given region are important choices when defining
a classification.
The general aim of the paper is thus to introduce a weather pattern classification useful
for the description of Austrian heavy rainfall spatial distribution. The classification is
based on a bottom up approach. The classification process is improved via the definition
of an optimization procedure for the choice of the geopotential information considered.
A specific aim of the paper is thus to show that the optimization procedure is relevant
for capturing physical information on synoptic situations responsible for heavy rainfall
and that it can improve weather pattern classification performances.
inherited of previous works on quantitative precipitation forecasting, using the analogue
method (Guilbaud and Obled 1998, Obled et al. 2002 and Bontron 2004). Note that the
geopotential grid used in the analogue method results from tests of different locations,
sizes and characteristics (Obled et al. 2002). This methodology was shown to be useful
for the definition of a rainfall compound distribution in France (Garavaglia et al. 2010)
and was also applied to other domains (e.g. by Brigode et al. (2012) over British
Columbia). All methodological hypotheses are listed and verified in the present study.
The proposed optimization procedure consists in finding the size, the location and the
characteristics of the geopotential fields that better explain the spatial distribution of the
rainfall on a given region. The definition of a weather pattern classification over Austria
is then presented. Several classifications were developed in the past for modeling
rainfall over this region (Ehrendorfer 1987, Matulla et al. 2003, Seibert et al. 2006).
Recently, numerous weather pattern classifications have been defined over the region
within the COST 733 action (Harmonisation and Applications of Weather Types
Classifications for European Regions, http://cost733.met.no/about_cost733.htm). The
COST 733 action main objective is to “achieve a general numerical method for
assessing, comparing and classifying weather situations in Europe, scalable to any
European (sub)region with time scales between 12h and 3 days and spatial scales of 200
to 2000 km, applicable for a number of applications”. The performances of the proposed
classification are thus compared to the performances of COST 733 classifications.
The method used for the weather pattern classification is summarized in section 2. The
rainfall and geopotential data used in the study are described in section 3, while in
section 4 the results of the optimization for the definition of Austrian weather patterns
2. Methodology
As introduced in the previous section, a rainfall days classification is first generated as the “bottom” steps. This classification is then linked to different geopotential
informations implementing the “up” steps.
2.1 THE BOTTOM PART OF THE CLASSIFICATION: GENERATING ONE RAINFALL
CLASSIFICATION
This first part of the classification process is the “bottom” part, only dealing with
rainfall information. The main objective of this part is to identify a limited number of
typical rainfall classes characterized by similar heavy rainfall spatial patterns.
The first step consists of the selection of a “rainy days” sub-population. Suppose that a
meteorological dataset is available and is composed of n rainfall series observed on a
given region at daily resolution. Each day j is thus characterized by a rainfall vector of
size n. The rainy days can be selected using an average rain depth threshold (for
example, all the days with more than 5 mm of spatial average precipitation are
considered as rainy days) or using a fixed proportion of all the observed days (for
example, the 20% days with the highest rain depth are then considered as rainy days). The need of a classification more focused on “where does it rain” information than on
“how much does it rain” information is fulfilled by the use of the “shapes” of the
rainfall fields. These rainy day shapes, named Rj, are defined in a rainy days space of
dimension n and obtained with the normalization of each rainy day rainfall field by each
which chooses iteratively the grouping presenting the minimum intra-class inertia
(Cheng and Wallace 1993). The final number of rainfall classes (NRC, which contains all
the rainfall classes and one non-rainy class) is determined by looking at the intra-class
inertia evolution as a function of the number of classes. Finally, the NRC rainfall classes
gather days characterized by rainfall fields with similar spatial distribution.
2.3 THE FIRST “UP” STEPS: OPTIMIZATION OF THE GEOPOTENTIAL INFORMATION
USED
The “up” steps consist now in moving into the geopotential height space and finding
optimal geopotential information explaining the rainfall generating processes coming
from the synoptic scale.
First, the rainfall classes and the non-rainy class centroids are projected onto the
geopotential height space. Like for the rainfall fields, geopotential field shapes are used
and are thus previously estimated with the normalization of each geopotential field by
each day average geopotential height. Each day j is thus characterized by a geopotential
field vector Gjm, where m indicates the dimension of the geopotential field space. The
centroid of the rainfall class A is defined as the mean geopotential field vector of the nA
days composing the class, named GAm in the defined geopotential space.
[1]
A n j m j m A n G G A
1The geopotential height space can be composed of different geopotential fields at
different heights (e.g. 500 hPa, 700 hPa, 1000 hPa, etc.) and recorded at different times
(e.g. 0h, 12h, 24h, etc.) on several geographic locations (i.e. different grid points). For
example, the geopotential height space of day j can be described by a vector Gj1000,
space used by Garavaglia et al. (2010) is characterized by a vector G440, because the
geopotential space is defined at 2 heights (700 hPa and 1000 hPa), for 2 times per day
(0h and 24h) and on 110 points grid covering a spatial extent of around 106 km². Note
that a Principal Component Analysis (PCA) of each potential space is implemented in
order to reduce the number of dimensions of this space to 10. All the optimization
procedure tends to find the optimal geopotential field space m onto which the rainfall
class centroids are projected.
2.4 THE FINAL “UP” STEPS: RE-ATTRIBUTION OF EACH DAY TO ONE WEATHER
PATTERN
The last classification step consists in re-attributing each day (considered as rainy or
not) to a given weather pattern in estimating the Euclidian distances between the
considered day and the class centroids. The considered day is then attributed to the
weather pattern witch is the closest one. Note that some “no-rainy days” can thus be
considered as members of a rainy weather pattern if they are closer of a rainy weather
pattern centroid in the considered geopotential space.
Finally, our classification is no more driven by the prior rainfall information but by the
geopotential field information. Finding rainfall data set with good spatial and temporal
coverage and good data quality over a specific area is harder than geopotential
information. Thus, classifications can be easily extended using only other geopotential
data set, like NOAA 20th Century Reanalysis (6-hourly geopotential height fields from
1871 to 2011, Compo et al. 2011) or EMULATE reanalyses (daily mean sea-level
2.5 CRAMÉR-VON-MISES TEST FOR CLASSIFICATION EVALUATION
Numerous criteria exist for evaluating classification performance. The Cramér-von Mises test (Anderson 1962), named Cramér further, is typically used as a “basic” tool to
check the discriminating power of a weather pattern classification in terms of rain/no
rain occurrence (Bárdossy et al. 1995, Stehlik and Bárdossy 2003, Bliefernicht and
Bárdossy 2007, Garavaglia et al. 2010). The Cramér coefficient can be estimated for
each available rainfall series with a contingency table, constructed with the considered
weather pattern classification (vector with one weather pattern for each day) and a
vector of rain/no rain occurrence (vector with, for each day, either 0 if the rain average
is null or 1 if rainfall is observed). Thus, the Cramér performances of each classification
and each rainfall series are estimated as follows:
[2] d n Cramér 2
where 2 is the result of a classical dependence 2 test between the weather pattern classification and the rain/no rain occurrence vector and nd is the number of classified
days. This score ranges between 0 (no dependence between the classification and the
observed rain/no rain occurrence) and 1 (absolute dependence). To focus on heavy
precipitation, the Cramér coefficient can be estimated on a sub-sample population of
heavy rainfall composed of the days with a precipitation amount greater than a given
threshold. The performances of each weather pattern classification produced are thus
evaluated using this type of score qualifying their discriminating power in terms of
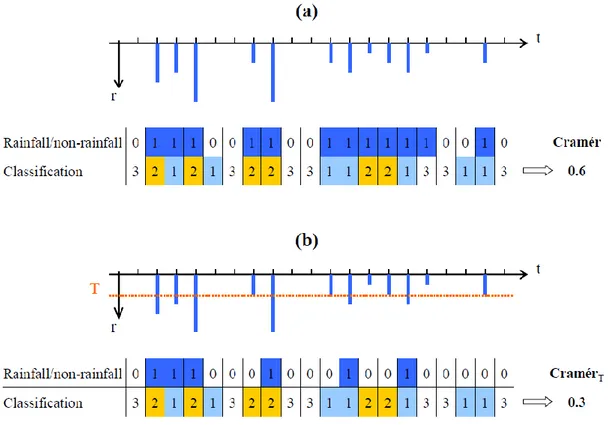
rain/no rain occurrence. Figure 1 presents an example of the evaluation of one
hypothetical classification in three classes with the Cramér test. The considered
rainfall record studied. A threshold T can then be fixed in order to test the
discriminating power of the classification in terms of heavy rainfall.
FIGURE 1. Example of Cramér performances (a) and of Cramér performances focused
on heavy rainfall (over threshold T) (b) obtained by three classes: classes 1 and 2
regroups rainfall days coming from two different situations and class 3 regroups the
3. Data
The two archives used in this study are (i) information on rainfall fields (needed for the
identification of Austrian rainfall classes) and (ii) information on the synoptic scale
(required for the projection of these classes onto the geopotential height space). Weather
pattern classifications defined in the COST action 733 are finally used for analyzing
weather pattern classification performances.
3.1 RAINFALL FIELDS
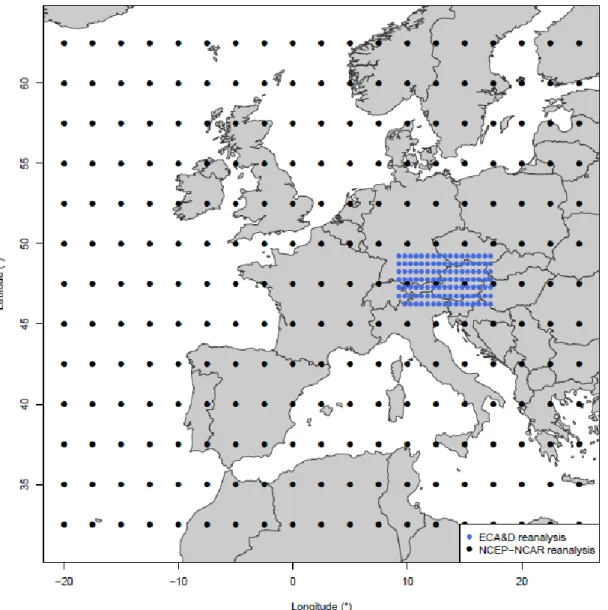
The Austrian daily rainfall field is obtained from the European Climate Assessment and
Data (ECA&D) re-analyses data set (Haylock et al. 2008) providing daily precipitation
amounts (calculated as the sum of rainfall at 18 UT of the current day and rainfall at 06
UT of the next day) with a resolution of 0.5° x 0.5° for the period 1950 to 2008. A
sub-domain of 300 000 km² is extracted to cover the Austrian territory (from 9.25°E to
17.25°E, and from 46.25°N to 49.25°N) and consists thus of 119 rainfall re-analysis
series. This grid is shown with red points in Figure 2.
3.2 GEOPOTENTIAL FIELDS
The geopotential height space is characterized by daily geopotential height fields at 700
and 1000 hPa. These fields, provided by the National Center for Environmental
Prediction (NCEP) and National Center for Atmospheric Research (NCAR) reanalysis
(Kalnay et al. 1996), are defined on a 2.5° resolution grid for 247 points in Western
Europe, at 00 UT and at 24 UT. Thus, each day is described by four geopotential fields
FIGURE 2. Map of the available data of geopotential height (NCEP-NCAR reanalysis,
plotted with black points) and of rainfall data (ECA&D reanalysis, plotted with red
points) used in the present study.
3.3 COST733 WEATHER PATTERN CLASSIFICATIONS
two at a time on the domains D06 (Alps, 3° to 20° E and 41° to 52° N) and D07
(Central Europe, 3° to 26° E and 43° to 58° N) have been extracted in order to compare
these classifications and the Austrian weather pattern classification defined here with a “bottom-up” approach. Note that these classifications have been defined with different
methodologies and are characterized by different number of weather patterns (from 7 to
4. Results
4.1 THE “BOTTOM” STEPS: HIERARCHICAL ASCENDANT CLASSIFICATION OF THE
RAINY DAYS
In this section, some first illustrations of the “bottom” steps, which results in the
definition of one Austrian rainfall classification, are presented. Following the steps
depicted in the section 2, we defined a rainy day as a day with a total rainfall amount
greater than the 80th percentile of the total population.
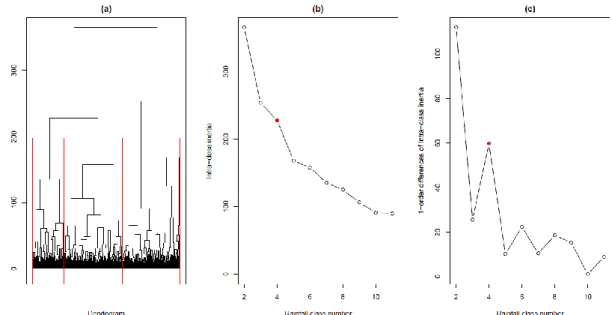
The number of rainfall classes, and consequently the number of weather patterns, is here
chosen by looking at the intra-class inertia evolution in the dendrogram as a function of
the number of classes (Figure 3). Each difference D1 is estimated as the absolute value
of the difference between the intra-class inertia estimated for n+1 rainfall classes and
the inertia estimated for n classes. The intra-class inertia evolution suggests the choice
of 4 rainfall classes and 1 non-rainy class. Note that, to ensure a significant number of
observations in each class and define a simple operational classification, we should
consider a parsimonious number of classes (typically fewer than 10 classes). For instance, in the “French classification” described in Garavaglia et al. (2010), this
number is thereby fixed to 8 classes (7 rainy classes and 1 non-rainy class). Moreover,
the previous works on Austrian rainfall classification result in a number of classes never
FIGURE 3. Dendrogram obtained from HAC of Austrian rainy days. (b) Intra-class
inertia evolution. (c) 1-order differences of intra-class inertia evolution. The red boxes
highlight the 4 rainfall classes identified, red points highlight the intra-class inertia of
these 4 rainfall classes.
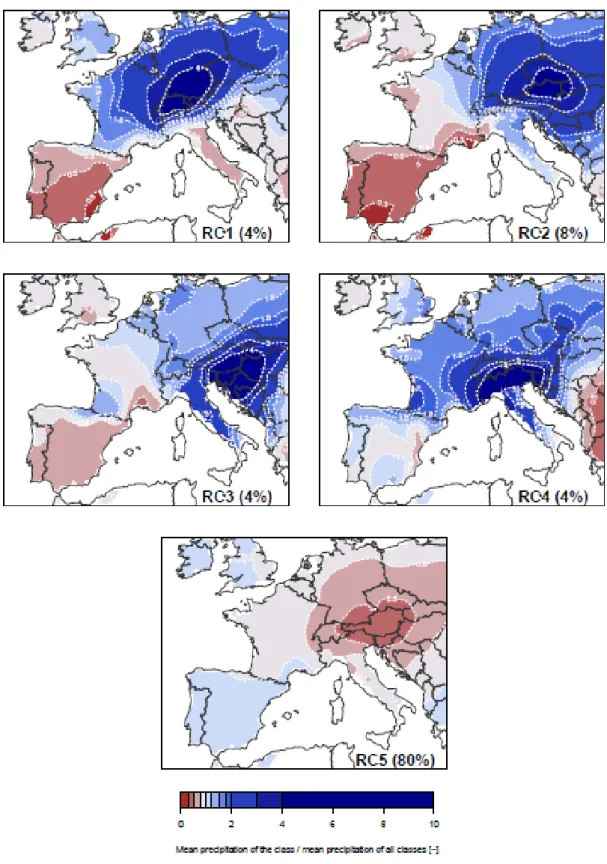
The choice of 5 classes (4 rainy classes and 1 non-rainy class) is also comforted by the
visual analysis of the rainfall fields characterizing the 5 classes and reported in Figure 4.
Indeed, we can observe that class 1 is characterized by a rainfall spatial distribution
centred in the North Western part of Austria, in the North Eastern for class 2, in the
FIGURE 4. Ratio between the mean precipitation amount of each Austrian rainfall
4.2 ON THE “UP” PART OPTIMIZATION (GEOPOTENTIAL FIELDS POSITION AND SPATIAL
EXTENT)
In this section, we search the optimal geopotential space in terms of classification
general performances. Following Garavaglia et al. (2010), we first defined the
geopotential space as constituted by 4 geopotential height fields for each day: the 700
hPa and 1000 hPa fields at 0h and at 24h. Three different sizes of geopotential height
grid are chosen. The first one is of size 3.0x10⁶ km² as used for the French weather patterns classification and further named “Size 1” (S1). A second size of approximately
0.6x10⁶ km² is chosen to entirely cover the Austrian territory, named “Size 2” (S2). The
last one is of size around 0.9x10⁶ km², named “Size 3”, (S3), which is a compromise
between S1 and S2. 403 different classifications of weather types are generated, by
moving the location of the centre of grids characterised by these three different spatial
extents over Europe. Considering the spatial extent of the data set used in this study, the
S1 center grid can thus be positioned in 88 locations, S2 in 165 and S3 in 150. The 5
rainfall classes are projected onto each different geopotential space of dimension 216
(54 geopotential measure points x 2 heights x 2 measure hours), 60 (15 geopotential
measure points x 2 heights x 2 measure hours), and 80 (20 geopotential measure points
x 2 heights x 2 measure hours), respectively, resulting in different weather pattern
classifications. The performances of each weather pattern classification are evaluated by
the Cramér test estimated over the whole rainy days population (named Cramér0
hereafter) and over the heavy rainfall sub-sample exceeding a threshold, as depicted in
section 2. This threshold T is chosen here as 20 mm. This choice is coherent with the
previous results of Seibert et al. (2006) who used the mean precipitation 98th percentile
found a threshold around 20 mm/d. This “heavy Cramér” coefficient is further named
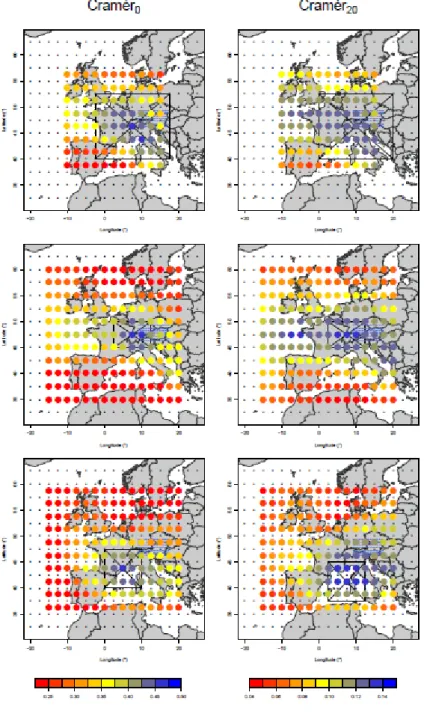
“Cramér20 coefficient”. Figure 5 presents the Cramér0 and the Cramér20 coefficients for
each grid of geopotential heights (from S1 to S3 from top to bottom) and for each
position of the grid. Thus, each colored point represents the barycentre of one grid and
the colors correspond to the mean Cramér performances obtained on all the Austrian
rainfall reanalyzes considered (blue points). Finally, the black box represents for each
grid size and for each coefficient the location of the best geopotential height spatial
FIGURE 5. Cramér0 (left column) and Cramér20 (right column) coefficients for different
positions of the geopotential height field barycentre used in weather pattern definition,
for three spatial extents of the fields (from top to bottom S1 to S3). The spatial extent of
First, note that the geopotential grids centered on Austria are not the best grids in terms
of Cramér0 and Cramér20, for all three sizes. The best performances are obtained for
grids located in the South and in the West of Austria. Then, the West-East flux appears
to have a major role in the Austrian rainfall processes. Thus, the more the geopotential
grid centre moves away latitudinally from Austria the poorer the performances are in
terms of rain/no-rain occurrence. On the contrary, a geopotential grid with very distant
longitudinal locations offers some reasonable performances in terms of rain/no rain
occurrence. For the S1 size for example, a classification based on a geopotential grid
distant approximately from only 200 km North of Vienna (centered near Dresden) offers
a Cramér0 coefficient lower than 0.30 whereas an other classification based on a grid
distant from more than 4000 km (centered off the Bretagne coast and thus 20 times
more distant than the precedent one), is characterized by a Cramér0 coefficient greater
than 0.40. This tendency is more clearly observable for the S2 grid, with a clear
latitudinal threshold of both Cramér coefficients: grid center locations over 55°N and
under 37.5°N lead to weather pattern classifications with poor performances in terms of
Austria rain/no rain occurrence. These results are coherent with those of previous
studies focusing on Austrian heavy precipitations. Ehrendorfer (1987) stated that an
important part of heavy rainfall events in Austria is due to West and South-West
circulations. Moreover, Matulla et al. (2003) showed that the back trajectories for heavy
precipitation days in Austria are coming mostly from West and South-West, like the
dramatic Elba flood in 2002. It is important to note that Eastern or Northern circulations
can equally generate heavy rainfalls. Nevertheless, the best quantity of heavy rainfall
The Cramér0 and Cramér20 performance differences between the optimal grids of each
size are non significant (greater than 0.45 for the Cramér0 and greater than 0.14 for the
Cramér20) and we do not use these scores for the choice of the optimal grid. In order to
cover a larger area and maximizing the potential geopotential information of our
classification, we choose as optimal one a S1 grid (around 3x10⁶ km²). The optimal grid
is approximately centered on the Western Alps and thus not centering on the Austrian
region (first line and first column black box of Figure 5).
4.3 WHICH GEOPOTENTIAL INFORMATION TO BE USED IN OUR WEATHER-PATTERN
CLASSIFICATION?
In this section, we analyze the influence of the choice of the geopotential information used in our “up” steps on the classification performances. Note that we fixed in the
precedent optimization procedure the geopotential space as constituted by 4
geopotential height shape fields for each day: the 700 hPa and 1000 hPa fields at 0h and
at 24h, following Garavaglia et al. (2010) methodology. We used now one grid size (S3
size) and we projected for each location the 5 rainfall classes onto geopotential spaces
with different characteristics: using the shapes or the absolute values of the fields, using
fields at 700 hPa, 1000 hPa or both, and using geopotential fields at 0h, or 0h and 24h.
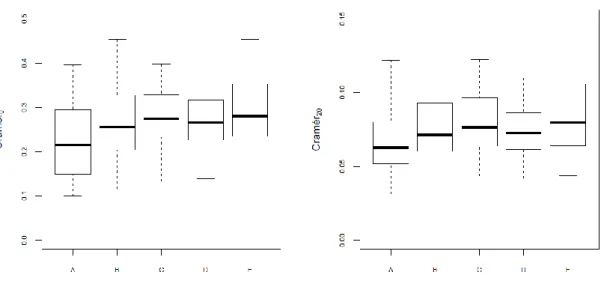
Figure 6 presents the Cramér0 (first column) and Cramér20 (second column)
performances obtained for the 150 locations of S3 grid, using 5 different geopotential
FIGURE 6. Cram´er0 (a) and Cram´er20 (b) performances obtained for 88 S1 grids by
projecting the 5 rainfall classes onto different geopotential spaces: (A) absolute values
of 700 and 1000 hPa geopotential height fields at 0h and 24h, (B) 1000 hPa geopotential
height shapes fields at 0h and 24h, (C) 700 hPa geopotential height shapes fields at 0h
and 24h, (D) 700 and 1000 hPa geopotential height shapes fields at 0h and (E) 700 and
1000 hPa geopotential height shapes fields at 0h and 24h. The boxplots are constructed
with the percentiles 0.10, 0.25, 0.50, 0.75 and 0.90
The first main result is that the two Cramér coefficients present the same “evolution tendencies”. Thus, Cramér0 and Cramér20 performances are clearly higher when shapes
of geopotential height fields are considered (boxplots E) than when absolute
geopotential fields are used (boxplots A). Similarly, using geopotential height fields at
700 and at 1000 hPa (boxplots E) add significant rainfall information compared to using
boxplots D). These results are coherent with the findings of Obled et al. (2002) and
Bontron (2004) in a precipitation forecasting context and validate the general
applicability of the methodology used in Garavaglia et al. (2010).
4.3 FINAL AUSTRIAN WEATHER PATTERN CLASSIFICATION ILLUSTRATION
In this section, we illustrate the final Austrian weather pattern classification defined
with the “optimal geopotential space”: 4 geopotential shape fields (700 and 1000 hPa at
0h and 24h) defined on an area of 3x10⁶ km² centred on the Western Alps.
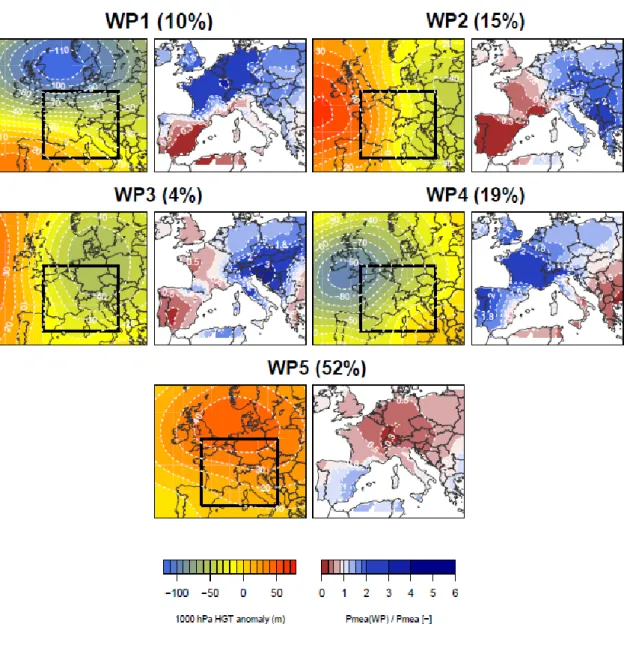
Figure 7 presents the mean geopotential heights (1000 hPa at 0h) and ratio between the
mean precipitation amount and the general precipitation amount (considering all WP)
FIGURE 7. Mean geopotential heights (1000 hPa at 0h) and Ratio between the mean
precipitation amount of each Austrian weather pattern and the general mean
precipitation amount(considering all weather patterns) for each of the 5 Austrian
weather patterns. The black boxes represent the “optimal” geopotentiel space used for the “up” part of the classification
Eastern for WP2, in the South Eastern for WP3, in the South Western for WP4 and the
WP5 is the anticyclonic weather pattern. Logically, the spatial distribution of each
weather pattern is no more concentred on the Austrian area, due to the Austrian rainfall
classes projection into a larger geopotential space. Moreover, rainfall classes were
identified on a rainy days sub-sample while weather patterns are constructed attributing
each day to a weather pattern, anticyclonic or not. Thus, weather patterns can contained
days with no rain observed on Austria and rainy days on the Northern part of Austria
can have the same type of atmospheric circulation that a rainy day in the central part of
Germany.
The evolution of each 5 clusters occurrence frequency, from the 5 original rainfall
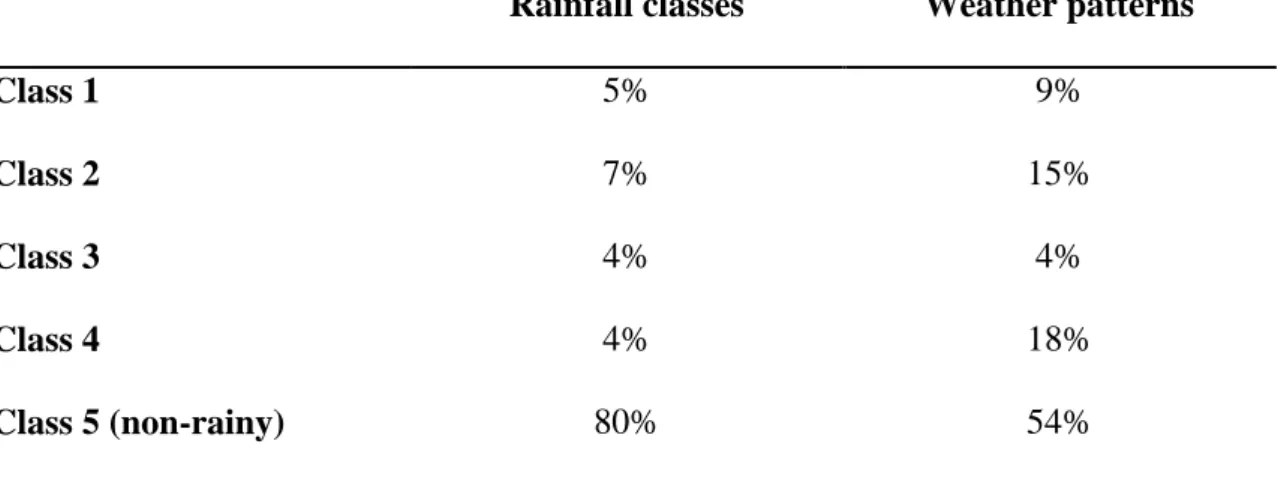
classes to the 5 final weather patterns, is presented in the Table 1.
TABLE 1. Evolution of the classes occurrence percentages from the five original
rainfall classes to the five final WPs.
Rainfall classes Weather patterns
Class 1 5% 9%
Class 2 7% 15%
Class 3 4% 4%
Class 4 4% 18%
Class 5 (non-rainy) 80% 54%
Note that the number of days attributed to the anticyclonic weather pattern (WP5) is lower than the number of days of the “non-rainy” class (RC5), meaning that several
patterns. At the same time, the frequencies of occurrence of each weather pattern are
higher. This tendency has a limited impact on the desired discriminating power of our
classification: the rainy days characterized by heavy rainfall in a particular area are
always regrouped in the same class.
The Austrian weather patterns classification has been checked on a particular region in
the North of Austria, the Kamp catchment at Zwettl in Niederösterreich. This catchment
was particulary studied after the August 2002 extraordinary floods which happened in
this region (Komma et al. 2007, Merz and Blöschl 2008). The spatial rainfall record
observed on this catchment (from 1976 to 2006) contains significant heavy rainy days,
like events in August 2002 which lead to major floods of the Kamp river. Thus, we have
tested the classification on this rainfall record and provided interesting results (not
shown here): the major rainfall records (containing August 2002 and other summer
events: 52 mm the 06/08/1985, 115 mm the 07/08/2002, 81 mm the 12/08/2002, etc.)
are regrouped in one particular weather pattern, the WP2. Moreover, observed synoptic
situations of these particular events showed similarities with the mean synoptic situation
of the WP2, characterized by a continental depression. The Austrian weather pattern
classification can thus provide interesting perspectives for heavy rainfall estimation on
this particular catchment as for other ones.
Our final Austrian weather pattern classification is based on rainfall classes identified
on Austrian rainy days but is at the end only driven by a geopotential height fields
information at a larger scale. This classification can be daily updated by using
4.4 PERFORMANCES OF WEATHER PATTERN CLASSIFICATIONS
The performances of the proposed weather pattern classification (named further “Austrian bottom-up classification”) is compared in terms of Cramér20 score on the
Austrian daily rainfall re-analyses used in this study, to the performances of 76 COST
733 classifications. Each of the 76 COST classifications are defined on two spatial
domains: D06 (Alps, 3° to 20° E and 41° to 52° N) and D07 (Central Europe, 3° to 26°
E and 43° to 58° N). Figure 8 presents (a) the spatial extent of the Austrian bottom-up
classification domain (red color) and the two COST 733 classifications domains (black
color for the D06 and blue color for the D07) and (b) Cramér20 score for each of the 157
classifications (76 COST 733 classifications * 2 spatial domains + 1 Final Austrian
bottom-up classification + 4 bottom-up classifications with different geopotential information used in the “up” steps of the classification).
FIGURE 8. (a) Spatial extents of the two COST 733 domains (D06 in black and D07 in
blue) and of the optimal geopotential heights information used for defining Austrian
bottom-up classification (red). (b) Cramér20 performances obtained by the 152 COST
733 classifications (76 D06 classifications in black and 76 D07 classifications in blue)
by the Austrian bottom-up classification (red) and by using different geopotential height
information for defining Austrian weather patterns (orange lines).
For each classification, the Cramér20 score plotted in Figure 8 (b) is estimated as the
average Cramér20 score estimated on the 119 Austrian ECA&D re-analyses points.
Performances of the Austrian bottom-up classification are similar to the best performing
COST 733 D06 (Alps) classifications in terms of Cramér20 and are better than all the
COST 733 D07 (Central Europe) classifications. Finally, the final Austrian bottom-up
classification performs better than the bottom-up classifications using less geopotential
5. Conclusions
In this paper, a parsimonious (only 5 classes) and discriminating (contrasted classes in
terms of rainfall and geopotential fields) Austrian weather pattern classification, useful
for spatial heavy rainfall description is proposed. The 5 classes are originated from
rainfall information but the final classification is only driven by a geopotential height
fields information (grid of around 3x10⁶ km², centred on the Western Alps). Updating
the classification is then easy to perform by using long geopotential height reanalyse
dataset or future geopotential height fields from General Circulation Models, which are
more robust data sources than punctual (in time and space) rainfall record informations.
This type of classification can lead to different applications, as extreme flood estimation
on a particular catchment (using weather pattern classification as a sub-sample tool for
the characterization of the rainfall risk, SCHADEX (Paquet et al. 2006) approach) or
characterization of future climatic evolution (using weather pattern classification as an
evaluation tool of the future climate model predictions). Moreover, we investigated the
optimal spatial extent, the position and the characteristics of the geopotential fields to be
taken into account for a rainfall based weather pattern classification. We show that the
choice of the spatial extent and the position of the centre of the geopotential heights is
an important issue. It is possible that the optimal geopotential field is not centred on the
studied region and potentially do not exactly cover the studied region. The
performances of the weather pattern classification using optimized geopotential height
spatial extent and size are shown to be good in comparison with COST 733 weather
pattern classifications where the geopotential height field is fixed a priori as two
explained from the physical and climatic phenomena leading to heavy rainfall. In addition to the identification of the “optimal” weather pattern classification, this
approach allows the general comprehension of the synoptic processes involved in the
6. Acknowledgment
We acknowledge the E-OBS dataset from the EU-FP6 project ENSEMBLES
(http://ensembles-eu.metoffice.com) and the data providers in the ECA&D project
(http://eca.knmi.nl). The NCEP-NCAR reanalysis data were provided by the
NOAA-CIRES Climate Diagnostics Center, Boulder, Colorado, USA, from their Web site at
7. Reference list
Anderson, T.W., 1962. On the Distribution of the Two-Sample Cramer-von Mises Criterion. Ann. Math. Statist. 33, 1148-1159.
Ansell, T.J., Jones, P.D., Allan, R.J., Lister, D., Parker, D.E., Brunet, M., Moberg, A., Jacobeit, J., Brohan, P., Rayner, N.A., Aguilar, E., Alexandersson, H., Barriendos, M., Brandsma, T., Cox, N.J., Della-Marta, P.M., Drebs, A., Founda, D., Gerstengarbe, F., Hickey, K., Jónsson, T., Luterbacher, J., Nordli, ø, Oesterle, H., Petrakis, M., Philipp, A., Rodwell, M.J., Saladie, O., Sigro, J., Slonosky, V., Srnec, L., Swail, V., García-Suárez, A.M., Tuomenvirta, H., Wang, X., Wanner, H., Werner, P., Wheeler, D., Xoplaki, E., 2006. Daily Mean Sea Level Pressure Reconstructions for the European– North Atlantic Region for the Period 1850–2003. J. Climate 19, 2717-2742.
Brigode, P., Micovic Z., Bernardara P., Gailhard J., Paquet E., Garavaglia F., and Ribstein P. 2012. Link Between Rainfall-based Weather Patterns Classification over British-Columbia and El Niño Southern Oscillations. EGU General Assembly 2012, 14:8029. Vienna: Geophysical Research Abstracts.
Bárdossy, A., Duckstein, L., Bogardi, I., 1995. Fuzzy rule-based classification of atmospheric circulation patterns. International Journal of Climatology 15, 1087–1097.
Bliefernicht, J., Bárdossy, A., 2007. Probabilistic forecast of daily areal precipitation focusing on extreme events. Natural Hazards and Earth System Sciences 7, 263-269.
Boé, J., Terray, L., 2008. A Weather-Type Approach to Analyzing Winter Precipitation in France: Twentieth-Century Trends and the Role of Anthropogenic Forcing. J. Climate 21, 3118-3133.
Bontron, G., 2004. Prévision quantitative des précipitations: adaptation probabiliste par recherche d’analogues. Utilisation des ré-analyses NCEP/NCAR et application aux précipitations du Sud-Est de la France. PhD Thesis, Polytechnic Institute of Grenoble, pp 286, Grenoble, 2004.
Cheng, X., Wallace, J.M., 1993. Cluster Analysis of the Northern Hemisphere Wintertime 500-hPa Height Field: Spatial Patterns. Journal of Atmospheric Sciences 50, 2674– 2696.
Compo, G. P, J. S Whitaker, P. D Sardeshmukh, N. Matsui, R. J Allan, X. Yin, B. E Gleason, et al. 2011. “The Twentieth Century Reanalysis Project.” Quarterly Journal of the
Royal Meteorological Society 137 (654) (January 1): 1–28. doi:10.1002/qj.776.
Ehrendorfer, M., 1987. A regionalization of Austria’s precipitation climate using principal component analysis. International Journal of Climatology 7, 71–89.
El-Kadi, A.K.A., Smithson, P.A., 1992. Atmospheric classifications and synoptic climatology. Progress in physical geography 16, 432-455.
Garavaglia, F., Gailhard, J., Paquet, E., Lang, M., Garçon, R., Bernardara, P., 2010. Introducing a rainfall compound distribution model based on weather patterns sub-sampling. Hydrol. Earth Syst. Sci. 14, 951-964.
Guilbaud, S., Obled, C., 1998. Daily quantitative precipitation forecast by an analogue technique: optimisation of the analogy criterion. Comptes Rendus de l’Académie des Sciences - Series IIA - Earth and Planetary Science 327, 181-188.
Kalnay, E.C., Kanamitsu, M., Kistler, R., Collins, W., Deaven, D., Gandin, L., Iredell, M., Saha, S., White, G., Woollen, J., others, 1996. The NCEP/NCAR 40-year reanalysis project. Bulletin of the American Meteorological Society 77, 437–471.
Kaufmann, P., Weber, R.O., 1996. Classification of mesoscale wind fields in the MISTRAL field experiment. Journal of Applied Meteorology 35, 1963–1979.
Komma, J., Reszler, C., Blöschl, G., Haiden, T., 2007. Ensemble prediction of floods – catchment non-linearity and forecast probabilities. Natural Hazards and Earth System Sciences 7, 431-444.
Littmann, T., 2000. An empirical classification of weather types in the Mediterranean Basin and their interrelation with rainfall. Theoretical and Applied Climatology 66, 161– 171.
Martínez, C., Campins, J., Jansà, A., Genovés, A., 2008. Heavy rain events in the Western Mediterranean: an atmospheric pattern classification. Advances in Science and Research 2, 61-64.
Matulla, C., Penlap, E.K., Haas, P., Formayer, H., 2003. Comparative analysis of spatial and seasonal variability: Austrian precipitation during the 20th century. Int. J. Climatol. 23, 1577-1588.
Merz, R., Blöschl, G., 2008. Flood frequency hydrology: 2. Combining data evidence. Water Resources Research 44, W08433.
Obled, C., Bontron, G., Garçon, R., 2002. Quantitative precipitation forecasts: a statistical adaptation of model outputs through an analogues sorting approach. Atmospheric research 63, 303–324.
Paquet, E., Gailhard, J., Garçon, R., 2006. Evolution of the GRADEX method : improvement by atmospheric circulation classification and hydrological modelling. La Houille Blanche 80-90.
Philipp, A., Bartholy, J., Beck, C., Erpicum, M., Esteban, P., Fettweis, X., Huth, R., James, P., Jourdain, S., Kreienkamp, F., 2010. COST733CAT-a database of weather and circulation type classifications. Physics and Chemistry of the Earth, Parts A/B/C 35, 360–373.
Räisänen, J., 2007. How reliable are climate models? Tellus A 59, 2-29.
Romero, R., Sumner, G., Ramis, C., Genovés, A., 1999. A classification of the atmospheric circulation patterns producing significant daily rainfall in the Spanish Mediterranean area. International Journal of Climatology 19, 765–785.
Seibert, P., Frank, A., Formayer, H., 2006. Synoptic and regional patterns of heavy precipitation in Austria. Theor. Appl. Climatol. 87, 139-153.
Stehlik, J., Bárdossy, A., 2003. Statistical comparison of European circulation patterns and development of a continental scale classification. Theoretical and Applied Climatology 76, 31–46.
Trigo, R.M., DaCamara, C.C., 2000. Circulation weather types and their influence on the precipitation regime in Portugal. International Journal of Climatology 20, 1559–1581. Ward, J.H., 1963. Hierarchical grouping to optimize an objective function. Journal of the
American Statistical Association 58, 236–244.
Yarnal, B., Comrie, A.C., Frakes, B., Brown, D.P., 2001. Developments and prospects in synoptic climatology. International Journal of Climatology 21, 1923–1950.