HAL Id: hal-02877391
https://hal.archives-ouvertes.fr/hal-02877391
Submitted on 22 Jun 2020
HAL is a multi-disciplinary open access archive for the deposit and dissemination of sci-entific research documents, whether they are pub-lished or not. The documents may come from teaching and research institutions in France or abroad, or from public or private research centers.
L’archive ouverte pluridisciplinaire HAL, est destinée au dépôt et à la diffusion de documents scientifiques de niveau recherche, publiés ou non, émanant des établissements d’enseignement et de recherche français ou étrangers, des laboratoires publics ou privés.
Multi-partner benchmark experiment of fatigue crack
growth measurements
Raphaël Langlois, Raphaël Cusset, Jerome Hosdez, Vincent Bonnand, Benoît
Blaysat, Léa Menut-Tournadre, Jan Neggers, Michel Coret, Joseph Henry,
Véronique Doquet, et al.
To cite this version:
Raphaël Langlois, Raphaël Cusset, Jerome Hosdez, Vincent Bonnand, Benoît Blaysat, et al.. Multi-partner benchmark experiment of fatigue crack growth measurements. Engineering Fracture Mechan-ics, Elsevier, 2020, 235, �10.1016/j.engfracmech.2020.107157�. �hal-02877391�
Multi-partner benchmark experiment of fatigue crack
growth measurementsExperimental benchmark on
fatigue crack growth with mixed mode aspect and
plasticity effect
Rapha¨el Langloisa, Rapha¨el Cussetb, J´erˆome Hosdezc, Vincent Bonnandd,
Benoit Blaysate, L´ea Menut-Tournadref, Jan Neggersh, Michel Coreta,
Joseph Henryf, V´eronique Doquetg, Michel Gr´ediace, Vincent Chiaruttinid, Martin Ponceleth, Henry Proudhonb, Nathalie Limodinc,∗∗, Julien R´ethor´ea,∗
GDR 3651 FATACRACK, CNRS
aResearch Institute in Civil and Mechanical Engineering (GeM)
Centrale Nantes, CNRS UMR 6183, Nantes, France.
bMINES ParisTech, PSL Research University
MAT - Centre des mat´eriaux, CNRS UMR 7633, Evry, France
cUniv. Lille, CNRS, Centrale Lille, UMR9013, LaMcube - Laboratoire de M´ecanique,
Multiphysique et Multi´echelle, Lille, France
dUniversit´e Paris-Saclay, ONERA, Mat´eriaux et Structures, Chˆatillon, France eUniversit´e Clermont Auvergne, CNRS UMR 6602, SIGMA Clermont,
Institut Pascal, Clermont-Ferrand, France
fSafran Aircraft Engine, Villaroche, France gLaboratoire de M´ecanique des Solides, CNRS UMR 7649
Ecole Polytechnique, Palaiseau, France
hLMT, Universit´e Paris Saclay, ENS Paris-Saclay, CNRS UMR 8535, Cachan, France
Abstract
The design of reliable structures and the estimation of the residual fatigue life of industrial parts containing flaws or cracks rely on our ability to predict the propagation of fatigue cracks. Whereas in industrial component cracks might have a complex path due to geometry and loading, lab experiments used for identifying crack propagation law are often in pure mode I. The paper presents a synthesis of an experimental benchmark performed in the
∗julien.rethore@ec-nantes.fr ∗∗nathalie.limodin@centralelille.fr
context of a French national research network. A sample has been designed to produce mixed-mode crack propagation and variation of small scale yielding conditions. Two geometries and two maximum load levels are defined for the two tested materials: a stainless steel and an aluminum alloy. Around ten participants performed experiments using their usual instrumentation. Among the eight possible parameter sets, three are selected for which detailed results are presented. A satisfying overall agreement is obtained. But, some discrepancies are evidenced due either to limitations of the instrumentation or simply because from one lab to the other the applied load is not exactly the same. It is thus concluded that one of the most important issue is boundary conditions, which is confirmed by numerical simulations.
Keywords: Fatigue Crack Growth, Mixed mode, Crack growth rate, Crack path, Stress intensity factors, Digital Image Correlation
Nomenclature
A, B and C DCPD constants
e vertical offset with respect to the hole center
f frequency
F maximum load equals to 16 kN for 316L and to 12 kN for 2074 F F maximum load equals to 22.5 kN for 316L and to 15 kN for 2074 Fmax, Fmin maximum and minimum loads of the fatigue cycle
H height of the specimen between the grips
N number of fatigue cycles
R load ratio
U potential drop
x coordinate of the crack tip along horizontal axis X (taken as the crack length) y coordinate of the crack tip along vertical axis Y
X, Y coordinate system with its origin at mid-height of the notch on the sample surface ∆ KI, ∆ KII amplitudes of the stress intensity factors in modes I and II respectively
CGR Crack Growth Rate
COD Crack Opening Displacement
DCPD Direct Current Potential Drop DIC Digital Image Correlation
FE Finite Element
LEFM Linear Elastic Fracture Mechanics LSA Localized Spectrum Analysis
SENT Single Edge Notched Tensile specimen SIF Stress Intensity Factor
TYS Tensile Yield Strength UTS Ultimate Tensile Strength
1. Introduction
Fatigue damage involves several stages: (i) the development of localized microplasticity on favourably oriented crystallographic slip systems, (ii) ini-tiation of cracks from the surface, through the formation of persistent slip bands, or from internal defects (iii) and the propagation of these cracks. As industrial materials are rarely free of pre-existing defects, the ability to predict fatigue crack growth is a critical issue for sizing structures or compo-nents to ensure their integrity and tolerance to defects. The design of reliable structures and the estimation of the residual fatigue life of industrial parts containing flaws or cracks rely on our ability to predict the propagation of fatigue cracks. Most common prediction methods are based on well-known concepts such as the Stress Intensity Factor (SIF) being a crack driving force in the Linear Elastic Fracture Mechanics (LEFM) framework. The ability of a metal to resist to crack propagation is then computed considering Paris’ law [1]. Paris’ law has been shown to be a very good estimate of what is ob-served in the ideal case of a pure mode I crack propagating under small scale yielding conditions with no variation of the load ratio nor of the frequency. Since this pioneering work by Paris in the 1960s, many improvements have been made to this theory to take into account crack closure [2, 3], plastic-ity [4] or crack branching [5]. Nevertheless, a number of difficulties inherent to the problem of fatigue crack growth remains unresolved. At the origin of most of these difficulties, we find the scale, axial and multi-mechanism aspects of fatigue crack growth in a general context associated with difficulties specific to the problem of fatigue. Indeed, the presence of a crack creates at its tip a complex stress state (non-uniaxial). It is then understandable that only accounting for the stress intensity factor which is a scalar value may have important limitations. In addition, interactions with the microstructure of the material can also influence the behaviour of the crack since this stress is strongly localized at the crack front.
The French CNRS research network, GDR 3651 FATACRACK, was cre-ated in 2014 for a duration of 4 years for the purpose of sharing research experiences related to fatigue crack propagation. About 25 research labs and 5 industrial partners are involved in this network. One of the achievements of the GDR is the definition of an experimental benchmark. To measure fatigue crack growth rates with respect to SIF, one usually refers to the E647 ASTM standard [6]. However it is limited to ideal cracks, i.e. a plane crack with a straight front, propagating inside specimens with standard
ge-50 200 e 5 X Y
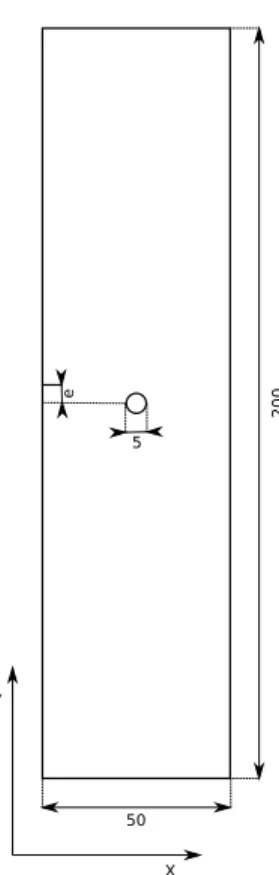
Figure 1: Sample geometry for cyclic tensile loading along Y direction parametrized by the offset e. The dimensions are in mm.
ometries under small scale yielding. Besides the recommended experimental good practices or guidelines that are recommended are limited to Direct Cur-rent Potential Drop (DCPD) and compliance techniques for the crack size measurement while SIF is estimated through analytical expressions. Actually several methods are available to measure the SIF and crack length during a fatigue test but no critical review of these methods applied to a given prob-lem could be found. Thus, one of the goal of this collaborative work was to benchmark the methods used by the different teams on a challenging fatigue crack propagation test as regards the curved crack path due to mode mixity and plasticity effects.
Specimens made of stainless steel (commercial 316L) or aluminum alloy (provided by Constellium) were sent to the participants. A synthetic analysis of the results is proposed herein. The aim of the paper is to present the main outcomesresults arising from the comparison of the results sent by the
par-(a) (b)
Figure 2: Comparison of the crack paths obtained for the 2.5 mm offset and the 6 mm offset (316L steel samples).
ticipants and to try and analyse the discrepancies. In the next Section, the benchmark setup is described in details. Then, Section 3 describes the instru-mentation used by each of the participants. Before the concluding section, Section 4 presents the results for some selected experimental configurations and the analysis of the results is developed.
2. Benchmark description 2.1. Sample geometry
The samples geometry for the benchmark is defined in Figure 1. The samples are 200 mm long, and 4 mm thick. The width of the sample is 50 mm. A hole of 5 mm in diameter is drilled at the center of the specimen and a notch of 1 mm × 5 mm is machined on the left side of the sample with a vertical offset e with respect to the hole center. Two configurations are tested (see Figure 1).
1. e = 2.5 mm: in this configuration the notch is at the same height as the top hole point.
2. e = 6 mm: in this configuration the notch is above the hole.
In both configurations, it is expected that the hole influences the crack path by inducing mixed mode loading. This effect might also be different for the two offsets as the interaction between the near tip fields with the hole free surface are different. In the first case (see Figure 2(a)), a crack is expected to initiate from the notch and then to deviate just before it goes into the
hole. In the second configuration (b), the crack is expected to deviate when it goes around the hole and then to continue straight until final fracture (see Figure 2(b)). However, the mode mixity is expected to remain very low (below 5%) and no emphasis is laid on this aspect. The participating labs were asked to monitor crack propagation at least on one side of the specimen with the notch on the left-hand side and the hole below the notch, this side is named ’frontrecto’ hereafter (Figure 1). The opposite side, with notch on the right-hand side and the hole below the notch is thus named ’backverso’. 2.2. Materials
A 316L stainless steel and a 2074 aluminum alloy with a T8 tempering, which was provided by Constellium, were used as model materials for indus-trial applications. Concerning 316L, the nominal elastic properties used later on are 190 GPa for the Young’s modulus and 0.3 for the Poisson’s ratio. The main properties of the 2074-T8 plates from which specimens were machined with the TL orientation are given in Table 1. The elastic properties used later on are i.e. 79 GPa for the Young’s modulus and 0.305 for the Poisson’s ratio.
Alloy Temper. Thickness L UTS L TYS L Elong. LT UTS LT TYS LT Elong.
mm MPa MPa % MPa MPa %
2074 T8 4.2 432 402 13.4 424 372 12.6
Table 1: Main properties of the 2074 aluminum alloy provided by Constellium.
2.3. Loading conditions
The participants were asked to follow some of the test conditions listed below:
• Load ratio: R = Fmin
Fmax = 0.1
• Frequency: f = 2 to 10 Hz
• 316LSteel maximum load: Fmax = 16 kN (denoted by F ) or 22.5 kN
(denoted by F F )
Two maximum load values are considered for each material in order to vary the size of the crack tip plastic zone and to emphasize the influence of the hole on the crack path and crack growth.
Among the parameters that were not defined is the length of the sample that is clamped in the grip. This length may vary, from about 35 mm to 50 mm,from one participant to another but also from one experiment to another. This may lead to significant differences in the actual boundary conditions applied to the sample due to different overall flexural stiffness of the testing setup. The crack path and the SIF history may be affected by this parameter.
3. Participants 3.1. Summary
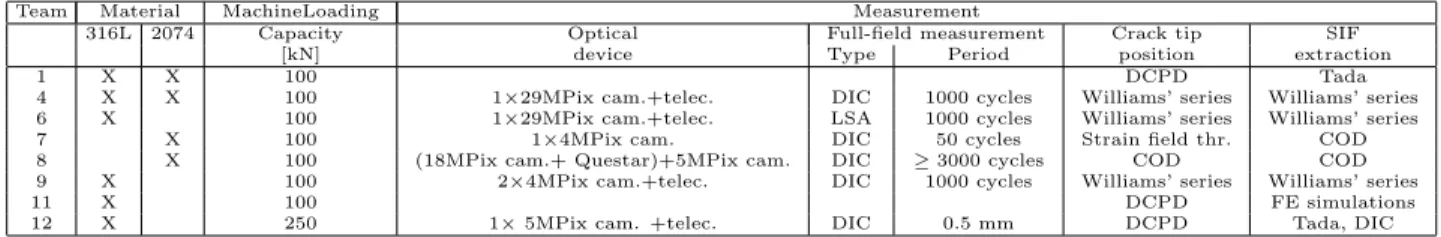
Among the labs affiliated to the GDR, 8 participated to the benchmark. About 100 samples of each material were sent. Some were used by the ticipant for checking their setup. In the remaining of this section, each par-ticipant describes his own setup and instrumentation. All the parpar-ticipants used a servo-hydraulic machine mounted with hydraulic grips (only Team 8 used 50 mm width wedge-shaped grips to clamp the specimens over a 50 mm height). The following Table 2 describes the main features of the experiments performed by each participant.
Team Material MachineLoading Measurement
316L 2074 Capacity Optical Full-field measurement Crack tip SIF
[kN] device Type Period position extraction
1 X X 100 DCPD Tada
4 X X 100 1×29MPix cam.+telec. DIC 1000 cycles Williams’ series Williams’ series
6 X 100 1×29MPix cam.+telec. LSA 1000 cycles Williams’ series Williams’ series
7 X 100 1×4MPix cam. DIC 50 cycles Strain field thr. COD
8 X 100 (18MPix cam.+ Questar)+5MPix cam. DIC ≥ 3000 cycles COD COD
9 X 100 2×4MPix cam.+telec. DIC 1000 cycles Williams’ series Williams’ series
11 X 100 DCPD FE simulations
12 X 250 1× 5MPix cam. +telec. DIC 0.5 mm DCPD Tada, DIC
Table 2: Main experimental equipment and measurement devices used by each participant.
While the measurement methods (crack tip position, SIF) are detailed hereafter, crack paths were measured post-mortem on broken samples or at the end of the fatigue test on one (frontrecto) or both sides of the specimen (frontrecto and backverso).
3.2. Team 1: Centre des Mat´eriaux MINES ParisTech
Team 1 used Direct Current Potential Drop to monitor crack growth. Alignment was adjusted using a dedicated alignment fixture mounted on top of the load cell. Each specimen was initially polished in front of the notch zone. To monitor the crack length during the fatigue tests, 4 threaded holes were added on the notch side of each sample to connectmount a potential drop measurement setup, following the ASTM E647 protocol [6]. A 3 Amps current was injected in the two holes close to the notch and the potential drop was acquired every cycle (10 Hz) at the two other holes. The crack length x can be related to the potential drop U by the following equation:
x(U ) = (A log(U ) + B)1/2+ C. (1)
This non linear function was used to relate the crack length projected on the horizontal axis x to the potential drop U . The three parameters A, B and C are identified by fitting one experimental crack length curve x(U ) for both materials. A better fit was obtained using this function than with a polynomial function or the Johnson model. During the first fatigue tests, the crack length was also measured optically which allowed to identify con-stants A, B and C for each material tested. The crack length evolution as a function of the number of fatigue cycle x(N ) is obtained for each test using Equation (1) and the measured potential drop signal U (N ). Crack growth rate curves are then obtained using a finite difference scheme. For estimating the SIF range, the analytic solution from Tada’s handbook is used [7]. 3.3. Team 4: Research Institute in Civil and Mechanical Engineering (GeM)
at Centrale Nantes
This team used Digital Image Correlation (DIC) to extract crack tip position and SIF range by projecting the displacement field amplitude onto Williams’ series [8]. The basis of this methodology was initially described in [9]. The extraction routine is implemented in the open-source software [10]. A 6576×4384 pixel digital camera was used to acquire image of the sam-ple surface. The samsam-ple surface is prepared using black and white spray paints. A telecentric lens, leading to a physical pixel size of 8.7 µm is used in order to accommodate possible out-of-plane movements. To follow crack propagation, images are acquired every 1000 cycles at Fminand Fmax. DIC is
performed using a finite element description of the searched displacement [11] on a regular mesh of 20 pixels quadrangular elements. The initial image ac-quired before any loading is used as the reference picture for DIC analysis.
The displacement field amplitudes are reconstructed by taking the difference between the displacements obtained at Fmax and Fmin. This displacement
field amplitude is then projected on the Williams’ solution over a circular re-gion of radius 300 pixels (excluding a circle of 90 pixel radius) centered at the crack tip. A non-linear least squares projection is used to progressively cor-rect the crack tip position until a minimum difference between the projected Williams’ solution and the measured displacement amplitude is reached. 3.4. Team 6: Institut Pascal of the Clermont-Auvergne University
The experiments were conducted at GeM by members of Team 4. For these experiments, the Localized Spectrum Analysis (LSA) [12, 13] in which Team 6 has expertise, is used instead of DIC. LSA is a spectral method used to extract displacement fields from images of periodic patterns such as the grids used in this study. It is shown in [14] that while DIC consists in minimizing the optical residual over small zones in the spatial domain, LSA minimizes the same optical residual in the Fourier domain. The advantage is threefold: i- this minimization is quasi-direct, which leads to much reduced computing times compared to DIC, ii- the effect of sensor noise in the result-ing displacement and strain maps is generally lower than with DIC, and iii-the pattern-induced bias recently introduced in [15, 16] is lower with peri-odic patterns than with the random ones classically used with DIC [16, 17]. The drawback of this technique is that a periodic pattern has to be deposited onto the sample, which is much less convenient than spraying random pat-terns used with DIC, and that only flat specimens can be used. In the present study, a grid is transferred onto the sample surface. The pitch size is 11.7427 pixel and the orientation of the grid axis with respect to the sample reference frame is 0.24 rad∼ 13.75o. The obtained displacement field is then projected onto Williams’ series using the exact same methodology as for the other cases.For the spectral method, a grid is transferred on the sample sur-face. The pitch size is 11.7427 pixel and the orientation of the grid axis with respect to the sample reference frame is 0.24 rad∼ 13.75o.
3.5. Team 7: Laboratory of Mechanics, Multiphysics, Multiscale (LaMcube) at Centrale Lille
This team used DIC to extract crack tip position and SIF range. A paint speckle pattern was applied to the specimen surface. A digital camera with a 2048×2048 pixels field of view and a pixel size of 27.8 µm was used to acquire images at both the minimum and maximum loads of a given cycle every 50
cycles. DIC was performed using Optical Flow Integrated per Block [18] with a 16 pixels window size and an 8 pixels pitch; a median filter with a 5 windows diameter was used as regularization. DIC computation between the images acquired respectively at Fmin and Fmax of the considered cycle yields
directly the displacement field amplitude of this cycle. The displacement field is then derived to compute the strain field in the loading direction and highlight the crack discontinuity, which is thresholded to identify the crack tip position as detailed in [19]. The evolution of the crack length, i.e. the crack tip position along X direction, with the number of cycles was fitted with polynomial curves before computing the crack growth rate in order to reduce the noise. Then, the mode I SIF range was measured by fitting the Crack Opening Displacement (COD) profile derived from the measured displacement field as a function of the distance to the crack tip.
3.6. Team 8: Laboratoire de M´ecanique des Solides (LMS), at Ecole Poly-technique
Team 8 also used DIC and COD to identify SIF and crack tip position at a higher spatial resolution than Team 7 but with a lower acquisition frequency. One side of the samples was polished and covered with speckle painting for DIC. A Questar travelling microscope fitted with a 4864 × 3847 pixels cam-era captured images of a mobile 4.8 × 3.8 mm field, manually centered on the crack tip, at minimum and maximum load during selected cycles (with an interval of 3 000 to 10 000 cycles). The spatial resolution of these im-ages was approximately 1 µm/pixel. The other side was just polished, and a fixed 32.5 × 28 mm area was monitored by a 2448 × 2046 pixels camera fitted with a Tokina macro 100 F2.8 D objective. The resolution of the im-ages was 13 µm/pixel. The Vic2D software was used for DIC, with a subset size between 80 and 120 pixels, and a step between 25 and 50 pixels (25 to 50 µm), depending on the local density of the speckle painting. To determine the stress intensity factors, the amplitude of the relative opening and sliding displacements between 2 rows of virtual extensometers, 100 to 150 µm apart, above and below the crack (denoted by COD and CSD, respectively) were plotted as a function of the square root distance to the crack tip. The am-plitudes of the effective stress intensity factors ∆KI and ∆KII were deduced
from the slope of such plots, using the expressions of the displacement given by linear elastic fracture mechanics in plane stress. The main cause of error was the exact localization of the crack tip, and the error was estimated as ± 5 percents. The fracture surfaces were observed with a digital optical
micro-scope and topographic reconstructions showed that in the aluminum alloy, crack growth became slanted only several millimeters after passing above or through the center hole. While an R ratio of 0.1 was used for the tests at the lowest peak force (F ) of 12 kN, an R ratio of 0.5 was used for those at the highest peak force (F F ) of 16 kN, in order to avoid shear lips development that was encountered by the other teams at R = 0.1, since wider shear lips are generally observed at lower R ratio, for a given Kmax[20].
3.7. Team 9: Laboratoire de M´ecanique et Technologie (LMT) Cachan at ENS Paris-Saclay
This team followed an experimental protocol very close to the other teams. For the crack propagation assessment (crack tip position and SIF value), Team 9 aimed at using DIC techniques identical to the Team 4 ones, with images acquired every 500 cycles at Fmin and Fmax.
The main difference with the other teams is the study of both sides of the specimen to see to which extent the case can be considered as a plane one. Both main surfaces of the specimen are thus sprayed with a black and white speckle, and two 2048 × 2048 pixel cameras (AVT MANTA G418B, 12-bit digitization) equipped with ×0.25 telecentric lenses are used. Both cameras were tilted with a 45◦ angle along the optical axis to increase the observable crack length. The same DIC analyses as performed by Team 4 were performed. However, the resolution of the images being lower, the DIC element size has been changed in pixel in order to keep the same physical element size. The radius of the extraction zone was reduced as well but not by the same factor for keeping the projection as robust as possible. One consequence is that the validity of the extraction when the crack goes above the hole can be questioned because the extraction domain intersects the hole. 3.8. Team 11: ONERA, Universit´e Paris-Saclay
The fatigue crack length is determined by the DCPD method in accor-dance with ASTM Standard E647 [6]. Nevertheless, the calibration curve is obtained by Finite Elements Method in order to overcome the limitations of analytic solutions for complex geometries, as the studied perforated spec-imen. If the crack path is known, this approach initiated by Ritchie and Bathe [21] allows to access directly to the crack length while the fatigue test is performed. In practice, the DCPD acquisition is triggered at the maximum loading point in order to avoid crack closure effect. Knowing the crack path and the crack length, SIF can be estimated by a numerical approach.
Prescribed uniform pressure Adjusted resulting force
Prescribed uniform vertical displacement
Loading condition 1 Loading condition 2 F ree zo ne hei gh tH
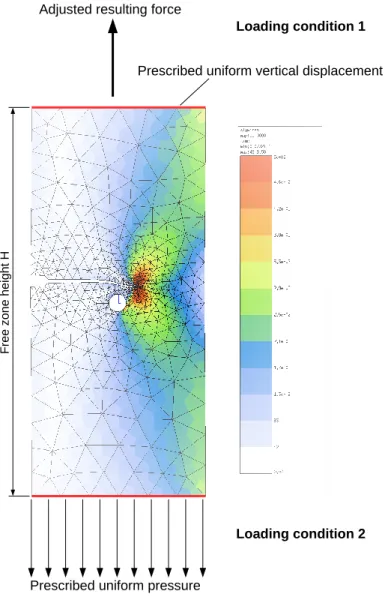
Figure 3: Representation of the two studied loading conditions, FE on a von Mises isovalues FE simulated mesh and von Mises equivalent stress contours (for illustration purpose): type (1) illustratedapplied on the upper surface, type (2) illustratedapplied on the lower surface.
In this respect, in the same way as [22], a complementary numerical mod-elling study has been performed, using the Z-cracks finite element analysis suite for 3D crack growth simulation (based on advanced adaptive remesh-ing techniques, efficient domain integral post-processremesh-ing and mesh transfer algorithms). During such kind of analysis, it has been observed that the type of boundary conditions that were applied on the specimen was critical in order to obtain a SIF value corresponding to the one applied using the testing machine.
The most critical aspect is related to the way of applying the prescribed force on the simulated zone between the grips (which height is designated as H). Two kinds of boundary conditions have been studied (see figure 3):
• Loading condition of type 1: a uniform vertical displacement is applied on the upper and lower surfaces. The amplitude of the displacement is adjusted so that the resulting force matches the prescribed force amplitude.
• Loading condition of type 2: a prescribed uniform pressure is applied on the upper and lower surfaces.
While the type (1) seems the most representative of the actual testing conditions, such an approach produces very low SIF values, compared to type (2), when the crack length increases (see figure 4). This is due to the fact that for type (1) the overall bending (along the Y axis) of the specimen is prevented thus leading to lower crack opening values and subsequently lower SIF values than for type (2) for which the two end sections are free to rotate. For type (1), the overall compliance in terms of crack opening per unit load is thus lower.
The influence of the grips distance has also been studied.: a larger dis-tance appears to reduce the differences between the calculated SIF values for boundary conditions 1 and 2. For type (1), the length between the grips has a strong influence on the SIF as this distance strongly affects the bending compliance of the specimen (a factor of about 2 is obtained between the two tested lengths). For type (2), this length clearly has a more limited influence because this condition hinders less the sample deformation. The distance between the grips thus has less influence than in the previous case. As ex-pected, increasing the distance between the grips reduces the discrepancy between the two types of conditions. In practice, type (1) condition cannot be guaranteed due to a lack of perfect adherence between the grips and the
0 10 20 30 40 50
x [mm]
0 50 100 150K
I[MPa.m
1/2]
Type 1, H=200 mm Type 1, H=110 mm Type 2, H=200 mm Type 2, H=110 mmFigure 4: 316L steel samples - Comparison between the computed SIF range values (F F ) during the propagation for type 1 (displacement imposed) and type 2 (pressure imposed) loading conditions and different grips distance H. The shaded area corresponds to the locationabscissa of the hole.
specimen, the actual condition may thus be in between type 1 and type 2 as it will be further illustrated in the results of Section 4.2.3.An explanation about this effect could be due to a lack of perfect adherence between the grips and the specimen which could allow a non uniform displacement along the upper and lower surfaces.
3.9. Team 12: Safran Aircraft Engines, Villaroche
Team 12 usually performs high temperature tests for crack propagation using classic DCPD methods. Apart from the DCPD, a 25 mm based exten-someter (centered on the crack side) and DIC were used on each specimens. The jAi BM500 2456 × 2048 pixel camera was equipped with a Navitar tele-centric lens which allows a complete view of the width of the specimens. For the entire test, peak-valley is registered for force, displacement, strain and DCPD signals. Asas for the DIC, every 0.5 mm (measured from DCPD), a complete loading-unloading is performed at a reduced frequency when images are taken. The images were sent to Team 4 for DIC and fracture parame-ters extraction. The same element size scaling as for the images of Team 9 was applied. However, estimating the CGR (Crack Growth Rate) from the DIC analysis when the images are acquired at a varying frequency (be-cause they were acquired every 0.5 mm of crack propagation) turns out to be difficultreveals difficult. Thus, only SIFs were kept from the DIC analysis. 4. Results
4.1. Aluminum alloy 4.1.1. Crack path
On the aluminum alloy, specimens with a 6 mm offset of the hole show a high disparity in crack paths from one participant to the other or even among the tests run by a single participant. For the tests performed at a 16 kN maximum load (F F ) (see Figure 5b), the crack may deviate towards the hole and then grow abruptly into the hole when it arrives above it (Team 7) or it may not go into the hole at all and even deviate in the opposite direction at different crack lengths for the different teams (Teams 1, 4, 8). As stated in the benchmark description, some variation, irrespective of the material, can also occur due to variation in the specimen length clamped in the grips and/or misalignment between the specimen and loading axis. Be-sides, although crack paths in the aluminum alloy show much more twisting than in steel specimens (see the difference between crack paths on frontrecto
and backverso evidenced by Team 7 and 8 in Figure 5a), the crack twisting (shear lips development) does not seem sufficient to explain these differences in behaviour larger than those observed for steel. The test performed by Team 8 at a higher stress ratio has indeed allowed to postpone the crack twisting observed by Teams 4 and 7 to longer crack length but the crack path is still complex with a crack that first deviates towards the hole, then away (Figure 5b). Maybe the influence of the microstructure (hot rolling tex-ture) is much more important than for steel; the elongated grains structure is clearly visible in the fracture surface. For the tests performed at a 12 kN maximum load (F ), Teams 7 and 8 both observed that the crack deviates away from the hole after about 12 mm until it twists at 15 mm (Team 7 R=0.1) or 27 mm (Team 8 R=0.5). Specimens with a 2.5 mm offset of the hole show more consistent crack paths between the participating lab. For either 12 kN (Teams 7 and 8) or 16 kN (Teams 1, 4, 7 and 8) maximum load, the crack goes into the hole after a slight deviation. While at a 12 kN maximum load, crack twisting occurs after passing the hole, at 16 kN it oc-curs after about 10 (Teams 4, 7 with a load ratio R=0.1) or 15 mm (Team 8 with R=0.5). Crack paths until the hole location are quite similar among the different teams (Figure 5a) even when crack twisting occurs. Consequently, the comparison of the crack growth rate and SIF obtained by Teams 1, 4, 7 and 8 will be focused on the specimen with a 2.5 mm offset tested at a 16 kN (F F ) maximum load.
The data obtained by Teams 1, 4, 7 and 8 on specimens with a 2.5 mm offset of the hole at the F F maximum load are plotted as CGR-da/dN −∆KI
curves in Figure 6. The ∆KI range was limited to a maximum of 40 MPa
√ m, i.e. the value that is reached when the crack suddenly reaches the hole. All the results lie on a same Paris’ curve but with some scatter; the largest gap is observed between the Paris’ curve from Team 1 and that from Teams 4, 7 and 8. To understand the origin of this scatter for a same material and a given specimen geometry, the CGR and SIF range evolution with the projected crack length along the horizontal axis are analyzed in the following paragraphs.
4.1.2. Crack growth rate
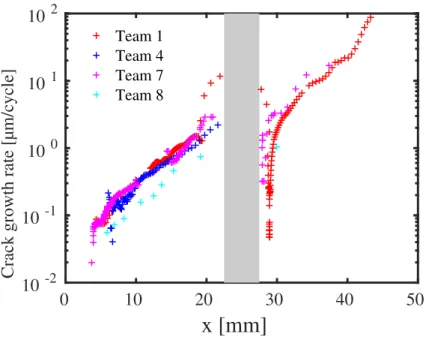
The CGR measured by Team 1, 4, 7 and 8 are plotted on Figure 7 as a function of the crack tip position along the horizontal axis. The crack growth rates measured by the DCPD technique (Team 1), from the projection of the measured displacement field onto Williams’ series (Team 4) and by
Team 1 Team 4 Team 7 back Team 7 front Team 8 (R=0.5) back Team 8 (R=0.5) front (a) Team 1 Team 4 Team 7 back Team 7 front Team 8 (R=0.5) (b)
Figure 5: Aluminum alloy samples: comparison of the crack path obtained for the 2.5 mm offset (a) and the 6.0 mm offset (b) at the F F maximum force.
100 101 102
K
I[MPa.m
1/2]
10-2 10-1 10 0 10 1Crack growth rate [µm/cycle]
Team 1 Team 4 Team 7
Team 8 from Tada (R=0.5) Team 8 from COD (R=0.5)
Figure 6: Aluminum alloy samples: comparison of the CGR v.s. SIF range plot obtained for the 2.5 mm offset and the F F maximum force.
thresholding the discontinuity in the measured displacement field (Team 7) are similar. At a given crack length before the hole, the CGR measured by Team 8 is systematically less than that measured by the others; this may be due to the larger load ratio R which was set to 0.5 instead of 0.1 to postpone crack twisting. On the one hand, the nominal ∆K was smaller for R = 0.5, on the other hand, crack closure effects were certainly reduced. The superposition of those effects led to a slight reduction in crack growth rate. The CGR measured by Team 8 is almost twice less than that measured by the others but the load ratio R was 0.5 instead of 0.1 to postpone crack twisting. The CGR increase is quite linear with the crack length on a semi-log plot. Small differences between the CGR measurement methods occur when the crack initiates and is small compared to the notch, i.e. between 4 and 7 mm, and also close to the hole when the crack accelerates before sinking into the hole. At crack initiation, it is difficult to tell which method is the most accurate. Both the crack discontinuity method and the Williams’ series method assume a long through-crack that does not exist at the beginning of the test. Besides the crack discontinuity was barely visible for short cracks (Team 7), which makes the estimation of crack tip position and growth rate
0 10 20 30 40 50
x [mm]
10-2 10-1 10 0 10 1 10 2Crack growth rate [µm/cycle]
Team 1 Team 4 Team 7 Team 8
Figure 7: Aluminum alloy samples: comparison of the CGR obtained for the 2.5 mm offset and the F F maximum force. The shaded zone corresponds to the hole.
rather inaccurate. Meanwhile the potential drop method is assumed to enable to follow or detect cracks as short as 50 µm [23]. The larger acceleration detected by Team 1 than by Team 4 when the crack goes close to the hole, although the crack paths are the same (Figure 5), may be explained as the DCPD technique allows to measure a crack length increase that is averaged through the specimen thickness while measurements of the crack length based upon the displacement fields measured at the surface only give access to a local estimate of the crack length. When the crack re-initiates from the hole, the CGR is initially close to that at the beginning of the fatigue crack propagation test before it steeply increases from the hole border to x = 31 mm (Teams 1, 7).
4.1.3. SIF
The SIF range in mode I, ∆KI, is plotted in Figure 8 as a function of the
crack tip position along the horizontal axis for the specimen with a 2.5 mm offset of the hole tested at the F F maximum force. For Team 7, because of an interruption in data acquisition during the test, values could only be plotted up to a crack length equal to 10 mm. The SIF values obtained from
the COD (Team 7), Williams’ series (Team 4) or from the Tada’s analytic formula [7] for a SENT specimen (Team 1) are very similar. At x = 10 mm, the maximum discrepancy reaches about 16 percents between the results ob-tained at a given 0.1 stress ratio. Indeed,Indeed the analytic formula always gives a good estimate of the mode I SIF range measured from displacement fields also for the cases not shown here, i.e. for a 2.5 mm offset with a F maximum load and for a 6 mm offset, as long as the crack is far away from the hole. When the crack comes close to the hole and as it deviates, the ∆KI
measured from displacement fields decreases while that computed from the analytic formula still increases. The reason is that the formula does not con-sidertake into account the interactions of the crack with the hole. Finally, the results obtained at R = 0.5 (Team 8), hence at a lower nominal SIF range, are of course lower than those obtained at R = 0.1 but not as low as one would expect from the sole analysis of R. Despite two different R ratio were used, the Paris’ curves are surprisingly very close when comparing the values obtained from COD (Teams 7 and 8). This could suggests that estimating the SIF from displacement fields at the crack tip yields an effective SIF not a nominal one. Moreover, it is interesting to note that the analytic formula can underestimate the value of the SIF range that can be measured from the near tip displacement field of a bifurcated crack at maximum force when small scale yielding condition no longer prevails.
4.2. Steel
4.2.1. Crack path
For the steel specimens, the disparity is much less pronounced, the typical size of the microstructural features being much smaller. Typical crack paths for the two offsets are shown in Figure 2. In the next paragraphs, the focus is on the 6.0 mm offset configuration because it allows to emphasize the role of plasticity on crack propagation.
As shown in Figure 9, consistency between the participants is really good-nice. A deviation from the initial propagation occurs when the crack tip goes above the hole, from x ≈ 20 mm to x ≈ 30 mm. After this deviation, occur-ring whatever the maximum load level is, the crack continues propagating in a direction perpendicular to the loading axis. Despite some fluctuations, probably due to misalignment between the specimen axis and the loading axis of the testing device and/or variation in the specimen length clamped in the grips, it is clear that for the higher maximum load level F F , the devi-ation induced by the hole occurs earlier (for smaller x) and the crack passes
0 5 10 15 20 25
x [mm]
0 10 20 30 40 50K
I[MPa.m
1/2]
Team 1 Team 4 Team 7Team 8 from Tada (R=0.5) Team 8 from COD (R=0.5)
Figure 8: Aluminum alloy samples: comparison of the SIF range obtained for the 2.5 mm offset and the F F maximum force.
Team 1 FF Team 1 F Team 4 FF Team 4 F Team 11 FF Team 11 F Team 12 FF Team 12 F Team 9 FF
Figure 9: 316L steel samples: comparison of the crack path obtained for the 6 mm offset depending on the maximum force level.
closer to the hole. Of course,Of course this small variation is to compare with the uncertainty in the image analysis used for extracting the crack path post-mortem. However, the procedure being the same for all the samples, the observed change in the crack path with the maximum load level, and thus with the extent of crack tip plasticity, is evidenced. A rough estimation of the cyclic plastic zone size from the Irwin’s formula gives 3 mm for the F case. It is thus smaller than the distance between the crack and the hole all along the propagation. Conversely, the plastic zone size for the F F case exceeds the distance between the crack tip and the hole, leading to strong interaction between the hole and the crack in terms (at least) of plastic zone. 4.2.2. Crack growth rate
The CGRs are plotted in Figure 10 as a function of the crack tip position along the horizontal axis. A strong influence of the maximum load level (F or F F ) is clearly observed. When Fmaxis equal to F F , the CGR is about one
decade higher than when Fmax is equal to F . It is interesting to note that the
hole has a strong influence on the CGR when the crack propagates above the hole whatever the value of the maximum load level. Before reaching the hole (x ≤ 20 mm) the evolution of the CGR appears to be linear in a log scale diagram. Once the hole changes the crack growth rate for x lying between 20 mm and 30 mm, the CGR recovers the same trend.
The hole induces a decrease of the CGR for the two maximum load lev-els. It is clear from Figure 10 that this decrease is higher for the F F case. However,However the relative difference between the CGR before the crack goes above the hole and the minimum CGR above the hole, is around the same level (∼ 15%).
The results of the participants using full-field measurement to extract CGR are very close, especially when the experiments have been carried out with the same testing machine (Team 4 and 6 in Figure 10(b)). The agree-ment between Team 4 and Team 6 is almost perfect, except in the close vicinity of the hole. It can be explained because using LSA, the grid also covers the hole allowing measurement over the hole. However, the displace-ment over this zone is not meaningful even though it is taken into account during the extraction of the SIF range by non-linear least-squares projection onto the Williams’ series. This may explain the difference observed in the vicinity of the hole for these two data sets. Note that the result obtained by Team 9 for the frontrecto face and the backverso face are in very close agreement (within the order of magnitude of the noise affecting this kind of
measurement). The noise in this type of measurement (from full-field data) for the very low CGR is higher than for DCPD but there is a good agreement between CGR obtained from DIC or LSA by Teams 4, 6, 9 and CGR from Team 1, 11, 12 obtained by DCPD at least qualitatively: the variation of the CGR occurs for the same coordinate x. The values obtained from Teams 1, 11 and 12 using the same technique of DCPD are different because the cali-bration technique for obtaining crack tip position from resistivity evaluation is different. Team 12 used a standard formula which does not account for the presence of the hole, Team 1 used a first test and optical observations to calibrate the tension / crack length relation and Team 11 used finite element simulations of the actual sample and crack geometry. However the discrep-ancy between these 3 Teams may also come from the experimental device itself as it was noticed before for full-field measurement results.
Non-linear deformation processes seem to be a limitation of both DCPD and full-field measurement-based techniques. However, DCPD is impacted by the monotonic accumulated plasticity while the projection of the displace-ment amplitude obtained by LSA or DIC is affected only by the plasticity generated within one loading cycle. It is also clear that the influence of the hole is not accounted for with the same level of reliability by the Teams. Some of the implemented techniques completely ignore the influence of the hole (Team 12) while some others include some modification of the usual approach. The propositions by Team 1 and Team 11 seem to be the most reliable but their predictions differ slightly which further emphasizes the po-tential influence of real boundary conditions through the loading device. It seems that ignoring the hole has more influence on the CGR for larger x what is perfectly consistent.
4.2.3. SIF
The SIFs for the specimen with an offset of 6.0 mm are plotted on Fig-ure 11 as a function of the crack tip position along the horizontal axis. Again, the evolution of the SIF range is strongly affected by the presence of the hole whatever the value of the maximum load level. The hole induces a decrease of the SIF range in the same way as for the CGR.
The agreement between the SIF range extracted from full-field measure-ments (Teams 4, 6, 9 and 12) and those deduced from the analytic solution used by Teams 1, is satisfying in the domain where the analytical solution is assumed to be valid (x ≤ 20 mm). The scatter is higher for the F F case, what is not surprising because the level of plasticity is higher, and thus the
0 10 20 30 40 50 x [mm] 10-3 10-2 10-1 100 101 102
Crack growth rate [µm/cycle]
Team 1 Team 4 Team 9, front Team 9, back Team 11 (a) F 0 10 20 30 40 50 x [mm] 10-3 10-2 10-1 100 101 102
Crack growth rate [µm/cycle]
Team 1 Team 4 Team 6 Team 9, front Team 9, back Team 11 Team 12 (b) F F
Figure 10: 316L steel samples: comparison of the CGR obtained for the 6 mm offset depending on the maximum force level. The shaded zone corresponds to the hole.
displacement amplitude measured by DIC or LSA is higher than the am-plitude that can be obtained from an elastic model (on which the analytic solution is based). The displacement amplitude being higher the extracted SIF range values are higher. The values obtained by Team 11 for type 2 boundary conditions (uniform pressure) are also in good agreement with the direct measurement performed by Teams 4 and 6 for x ≤ 20 mm. Then, the influence of the hole in the type-2 simulation is less pronounced. Con-versely, the decrease of the SIF range induced by the hole is well captured by type-1 simulations but the SIF amplitude remains lower than those obtained from full-field measurements. Note that due to the lower resolution of the images (and thus of the measurement itself), the direct extraction performed by Teams 9 and 11 may be less reliable than those for Teams 4 and 6. Again the agreement obtained by Team 9 between the two faces of the sample is very good what is to be related to the fact that no crack twisting is observed on steel specimens.
The conclusion from the data plotted in Figure 11 is that the clamping devices devices are not infinitely stiff compared to the sample as the SIF range measured from the actual displacement by Teams 4 and 6 (direct es-timates from higher resolution DIC measurements) appear to be in between those predicted by type 1 and 2 boundary conditions tested by Team 11. For investigating this boundary condition issue, the displacement amplitude measured by DIC (Team 4) is analyzed in order to estimate the displace-ment amplitude applied along the top edge of the domain of interest (as if the displacement amplitude of the bottom edge was fixed). This displace-ment amplitude is plotted in Figure 12 for different crack tip positions and for the two levels of maximum load. It is evidenced that the rotation of the boundary of the domain of interest is not zero. Although the rotation is very low (∼ 0.1o) and the size of the domain (along Y ) is small (only 23 mm
centered on the notch), it suggests that the actual boundary conditions are between the rotation-free and allowed rotation cases (type 2 and type 1). The displacement amplitudes that would be obtained over the observed zone for a uniaxial tension test are also plotted on the graphs of Figure 12. It is clear that the deviation from this idealized case are not negligible. Actual boundary conditions are however difficult to define (depending on a lot of non-deterministic factors). An alternative to idealized boundary conditions is to prescribe the measured displacement to a numerical simulation. For this purpose, the data obtained by Team 4 are available online [24].
range plot for the two load levels. It is confirmed in Figure 13(a) that for the F case, the main source of discrepancy is the estimation of the SIF range. The estimation of CGR appears consistent between the participants as also shown in Figure 10. Conversely, for the F F case, the unconstrained nature of cyclic plasticity and even more of monotonic plasticity induces inconsistency not only in the SIF range estimation but also in the CGR estimation due to material and geometrically non-linear effects. However, this representation of the data allows to focus on the material behaviour but not on the differences between experimental setups, CGR and SIF ranges being intrinsically related by the material itself.
5. Conclusion
In the context of an experimental benchmark led by the GDR 3651 Fat-acrack, fatigue experiments were performed for two industrial materials (316L and 2074 alloy) on specimens having geometries and loading conditions that induce curved crack path due to mixed-mode and non-small scale yielding conditions. The chosen specimen geometry, i.e. a SENT with a central hole, which position is more or less shifted vertically relative to the notch posi-tion, induces crack deviation when the crack grows towards or above the hole; for steel samples, this deviation depends on the maximum applied load. The tests were performed on similar samples using similar loading conditions, but using different testing devices and the crack growth rate and SIF evolution were measured by different methods in each participating lab.
On aluminum alloy specimens, the methods to estimate the CGR and SIF were compared on a test case where crack paths are similar between labs. The CGR obtained by the DCPD technique or from the measured displacement fields (COD or Williams’ series) are virtually the same. The main scatter in the obtained Paris’ law comes from the measurement of the SIF range. The analytic formula, which does not take into account plasticity nor the interaction with the hole, gives a lower bound that may underestimate the SIF measured from the crack tip displacement fields, especially at high stress ratio.
On stainless steel specimens, the discrepancy between the SIF either mea-sured from displacement fields or computed from DCPD crack lengths and FE modelling of the crack could be quite high and appears to depend strongly on the boundary conditions. The scatter is less pronounced for low load level for
0 10 20 30 40 x [mm] 0 20 40 60 80 100 K I [MPa.m 1/2 ] Team 1 Team 4 Team 9, front Team 9, back Team 11, Type 1 Team 11, Type 2 (a) F 0 10 20 30 40 x [mm] 0 20 40 60 80 100 K I [MPa.m 1/2 ] Team 1 Team 4 Team 6 Team 9, front Team 9, back Team 11, Type 1 Team 11, Type 2 Team 12 (b) F F
Figure 11: 316L steel samples: comparison of the SIF range obtained for the 6 mm offset depending on the maximum force level. The shaded zone corresponds to the hole.
0 10 20 30 40 50
x [mm]
0 0.05 0.1 Displacement [mm] x=8.43 mm x=9.22 mm x=10.15 mm x=11.21 mm x=12.56 mm x=14.23 mm x=16.61 mm x=20.84 mm x=26.70 mm Uniaxial tension (a) F 0 10 20 30 40 50x [mm]
-0.05 0 0.05 0.1 0.15 0.2 Displacement [mm] x=6.91 mm x=7.71 mm x=8.72 mm x=9.76 mm x=11.13 mm x=13.01 mm x=16.16 mm x=23.60 mm Uniaxial tension (b) F FFigure 12: 316L steel samples: evolution, as the crack is propagating, of the effective displacement amplitude applied over the domain analyzed by Team 4 (height of the domain equals to 23 mm).
101 102 KI [MPa.m 1/2] 10-3 10-2 10-1 100 101
Crack growth rate [µm/cycle]
Team 1 Team 4 Team 9, front Team 9, back Team 11, Type 1 Team 11, Type 2 (a) F 101 102 K I [MPa.m 1/2 ] 10-3 10-2 10-1 100 101
Crack growth rate [µm/cycle]
Team 1 Team 4 Team 6 Team 9, front Team 9, back Team 11, Type 1 Team 11, Type 2 Team 12, Tada Team 12, DIC (b) F F
Figure 13: 316L steel samples: comparison of the CGR v.s. SIF range plot obtained for the 6 mm offset depending on the maximum force level.
which the monotonic plasticity remains constrained and the actual loading conditions are closer to the ideal ones.
To allow the fatigue community to test numerical prediction of fatigue crack growth and path, the rich database obtained during this benchmark will be made available online at the following DOI: 10.5281/zenodo.3891441. Acknowledgement
The authors would like to acknowledge the support of CNRS to GDR 3651 FATACRACK. The support of SAFRAN, Saint Gobain CREE, Trelleborg Vibracoustic and Constellium is also acknowledged.
References
[1] P. C. Paris, F. Erdogan, A critical analysis of crack propagation laws, J. Basic Eng., ASME (1963) 528–534.
[2] W. Elber, The significance of fatigue crack closure, in: Damage tolerance in aircraft structures, ASTM International, 1971, pp. 230–242.
[3] J. Newman, A crack-closure model for predicting fatigue crack growth under aircraft spectrum loading, in: Methods and models for predicting fatigue crack growth under random loading, Vol. 748, ASTM Interna-tional, 1981, pp. 53–84.
[4] S. Pommier, P. Lopez-Crespo, P. Decreuse, A multi-scale approach to condense the cyclic elastic-plastic behaviour of the crack tip region into an extended constitutive model, Fatigue & Fracture of Engineering Ma-terials & Structures 32 (11) (2009) 899–915.
[5] M. Meggiolaro, A. Miranda, J. Castro, L. Martha, Stress intensity factor equations for branched crack growth, Engineering Fracture Mechanics 72 (17) (2005) 2647–2671.
[6] ASTM, E647, standard test method for measurement of fatigue crack growth rates (2015).
[7] H. Tada, P. C. Paris, G. R. Irwin, The stress analysis of cracks handbook, Del Research Corporation, Hellertown, PA (1973) 1.
[8] M. Williams, On the stress distribution at the base of a stationary crack, ASME Journal Applied Mechanics 24 (1957) 109–114.
[9] R. Hamam., F. Hild, S. Roux, Stress intensity factor gauging by digital image correlation: Application in cyclic fatigue, Strain 43 (3) (2006) 181–192.
[10] J. R´ethor´e, Ufreckles. (2018). doi:10.5281/zenodo.1433776.
[11] G. Besnard, F. Hild, S. Roux, ‘finite-element’ displacement fields analy-sis from digital images: Application to portevin-le chˆatelier bands, Ex-perimental Mechanics 46 (6) (2006) 789–803.
[12] M. Gr´ediac, F. Sur, B. Blaysat, The grid method for in-plane displace-ment and strain measuredisplace-ment: A review and analysis, Strain 52 (3) (2016) 205–243.
[13] M. Gr´ediac, B. Blaysat, F. Sur, Extracting displacement and strain fields from checkerboard images with the localized spectrum analysis, Experimental Mechanics 59 (2) (2019) 207–218.
[14] M. Gr´ediac, B. Blaysat, F. Sur, A critical comparison of some metrolog-ical parameters characterizing local digital image correlation and grid method, Experimental Mechanics 57 (6) (2017) 871–903.
[15] R. Lehoucq, P. Reu, D. Turner, The effect of the ill-posed problem on quantitative error assessment in digital image correlation, Experimental Mechanics (2017) 1–13doi:10.1007/s11340-017-0360-5.
[16] S. S. Fayad, D. T. Seidl, P. L. Reu, Spatial dic errors due to pattern-induced bias and grey level discretization, Experimental Mechanics 60 (2) (2020) 249–263.
[17] M. Gr´ediac, B. Blaysat, F. Sur, On the optimal pattern for displace-ment field measuredisplace-ment: random speckle and DIC, or checkerboard and LSA?, Experimental Mechanics,Accepted, online. doi:10.1007/s11340-019-00579-z.
[18] R. Seghir, J.-F. Witz, S. Coudert, Yadics - digital image correlation 2/3d software (2014).
[19] J. Hosdez, J.-F. Witz, C. Martel, N. Limodin, D. Najjar, E. Charkaluk, P. Osmond, F. Szmytka, Fatigue crack growth law identification by dig-ital image correlation and electrical potential method for ductile cast iron, Engineering Fracture Mechanics 182 (2017) 577–594.
[20] A. Shanyavsky, Z. Koronov, Shear lips on fatigue fractures of aluminium alloy sheets subjected to biaxial cyclic loads at various r-ratios, Fatigue & Fracture of Engineering Materials & Structures 17 (9) (1994) 1003– 1013.
[21] R. Ritchie, K. Bathe, On the calibration of the electrical potential tech-nique for monitoring crack growth using finite element methods, Inter-national Journal of Fracture 15 (1979) 47–55.
[22] E. Fessler, E. Andrieu, V. Bonnand, V. Chiaruttini, S. Pierret, Relation between crack growth behaviour and crack front morphology under hold-time conditions in da inconel 718, International Journal of Fatigue 96 (2017) 17–27.
[23] L. Doremus, Y. Nadot, G. Henaff, C. Mary, S. Pierret, Calibration of the potential drop method for monitoring small crack growth from surface anomalies–crack front marking technique and finite element simulations, International Journal of Fatigue 70 (2015) 178–185.
[24] R. Langlois, M. Coret, J. R´ethor´e, Fatigue Crack Propagation Bench-mark, GDR 3651 FATACRACK (2018). doi:10.5281/zenodo.2329057.