INVESTIGATION ON ADSORPTION PERFORMANCE OF MESOPOROUS ACTIVATED BIOMASS PREPARED FROM COCOS NUCIFERA HUSK FOR
HARZADOUS CYANIDE WASTEWATER TREATMENT
T. D. Yavini1*, M. H. Yunusa2, K. G. Atiku3, A. A. Musa4and P. K. Ruth4
1
Department of Agricultural and Bio-Resources Engineering, Taraba State University, Jalingo-Nigeria
2
Centre for Energy Research and Training, Ahmadu Bello University, Zaria – Kaduna, Nigeria
2
Chemical Engineering Department, University of Maiduguri, Borno, Nigeria 3
National Agency for Scientific and Engineering Infrastructure (NASENI), P.M.B. 391 Abuja - Nigeria
4
Department of Chemistry, Taraba State University, P.M.B 1167, Jalingo, Taraba-Nigeria
Received: 14 August 2016 / Accepted: 26 December 2016 / Published online: 01 January 2017 ABSTRACT
The influence of various factors namely pH, absorbent dosage; contact time and initial ion concentration was studied to identify the adsorption capacity of the adsorbent. The optimum pH was obtained at pH =3 for all the adsorbent. Other physiochemical parameters, ranging from the surface area to the scanning electron microscope (SEM) were studied and indicate that the cocos nucifera husk is a good precursor for investigation on activated biomass for hardzadous cyanide wastewater. Adsorption data were modeled using Langmuir, Freundlich, Temkin, Henry and Harkin Jura equation. Henry with the correlation coefficient R2 0.875 had a better fit than Freundlich which is R2= 0.836, Temkin; R2= 0.875, Langmuir; R2= 0.742 and Harkin Jura which is R2= 0.471 with maximum monolayer saturation capacity of cyanide ions adsorbed per gram of activated Cocos nucifera husk.
Author Correspondence, e-mail:tsunatu.danlami@yahoo.co.uk doi:http://dx.doi.org/10.4314/jfas.v9i1.22
ISSN 1112-9867
Available online at http://www.jfas.info
Journal of Fundamental and Applied Sciences is licensed under aCreative Commons Attribution-NonCommercial 4.0
Equibrium data were best described by Henry model. Kinetic models were also carried out including pseudo first order with R2= 0.969, Pseudo-second order R2 = 0.998, Intra-particle diffusion R2= 0.909, and Elovich Kinetic model with R2 of 0.814, the kinetic data were best described and seen by Pseudo second order model. It is then proven that the study of the entire adsorbent are most efficient for the removal of cyanide from waste waters and it can be used as low-cost adsorbent for the removal of cyanide ions from wastewater.
Keywords: Cocos nucifera, Kinetics, Adsorbent, Models, Wastewater, Cyanide Ions.
1. INTRODUCTION
Cyanide pollution increase with the advancement in industrialization and urbanization, the release of cyanide poses a significant threat to the ecosystem and public health because of their toxicity (Amuda and Ibrahim, 2006) cyanide are not biodegradable. When they accumulate in the environment and in food chains, they can profound disrupt biological processes. Cyanide is contained in cigarette smoke and the combustion product of synthetic materials such as plastic. In manufacturing, cyanide is used to make paper, textile, and plastics. It is present in the chemicals used to develop photographs, cyanide salts are used in metallurgy for electroplating, metal cleaning, and removing gold from its ore. Cyanide gas is used to exterminate pests (Reed et
al., 1994). Anthropogenic activities such as agriculture, electroplating, metal finishing industries
e.t.c increase the level of heavy metals in the environment one could be exposed to cyanide by breathing air, drinking water, eating food, or touching soil that contains cyanide as a resulting of both natural processes and industrial activities.
When present in air, it is usually in the form of gaseous hydrogen cyanide, smoking cigarettes is probably one or the major sources of cyanide exposure for people who do not work in cyanide-related industries (National Centre for Environment Health, 2013).
Basically, waste water discharged by industrial activities is often contaminated by a variety of toxic or otherwise harmful substance which has negative effect on the water environment. For example, metal finishing industry and electroplating unit is one of the major sources of heavy metals and cyanide pollutants which contribute greatly to pollution load of the receiving water bodies and therefore increase the environmental risk, cassava is also one of the staple food crops in Nigeria and can be processed in various ways, for instance, fermentation. Sometimes this is carried out in isolated locations such as use of pots or in flowing streams and rivers. They
contribute to the cyanide load of the affected water bodies. Also decaying plants can contribute to the cyanide concentrations in natural waters.
Because the discharge of industrial waste water is becoming a serious environmental problem in Nigeria, cyanide and heavy metal ions are reported as prior pollutants due to their mobility in natural water ecosystem and their toxicity. (Nwabanne and Ngbkowe 2012). Due to the demerit of conventional method, biosorption has provided an alternative measure to physiochemical methods. Recently, low cost agriculture by-products have been used to remove heavy metals from aqueous solution. This includes cocos nucifera, corn cobs, cassava waste, sawdust, pumpkin and so on (Faisal and Hasnain, 2004). In this study, the different forms of cyanide have awful health effects on people as well as other living organisms (Dursun et al., 1999). Therefore, cyanide and metal cyanide complexes in industrial waste water must be treated or reduced to lowest levels before being discharged. Several treatment processes such as physical, chemical and biological oxidation have been exploited for the reduction of cyanide levels in wastes solution/slurries in compliance with environmental regulations (Young and Jordan 2004).
Absorption is a simple and attractive method for the removal of toxic compounds from effluents due to its high efficiency, easy handling and economic feasibility and it is the adhesion of atoms, ions or molecules from a gas, liquid, or dissolved solid to a surface, this process creates film of the adsorbate on the surface of the adsorbent. This process differs from absorption, in which a fluid (the adsorbate) permeates or is dissolved by a surface-based process while absorption involves the whole volume of the material. The term absorption encompasses both processes, while desorption is the reverse of it. Adsorption is a surface phenomenon.
However, industrial waste water mainly from electroplating and mining industries normally contains higher cyanide concentration such as 5 – 250mg/l (Patil and Paknikar, 2000) and there is very little literature on the removal of cyanide from water containing cyanide at higher concentration for making adsorption process more feasible and cost effective, there is urgent need of low cost adsorbent with higher adsorption capacities.
Activated biomass has a great potential for cyanide wastewater treatment both in gold extraction, plants and effluent (waste water) from metal finishing plants and hence, it forms the subject of study in this research work.
Characterization of activated biomass shows area has an effect, although the reactivity of the surface is a result of oxygenated functional groups. The highly active surface properties of the
activated carbon are attributed to the chemical functional groups and the internal surface areas, which typically range from 500 to 3000mg/g (Siti -Nur et al., 2013).
The pertinent parameters that influences absorption such as initial cyanide (CN-) concentration [ICC], Agitation time (t), pH and absorbent dosage (AD) were investigated and the study of the investigation on absorption performance of mesoporous activated biomass prepared from cocos
nucifera husk for hazardous cyanide bearing waste water was properly investigated and also
explored due to its eco-friendly nature and availability in Nigeria.
1.1 EXPERIMENTAL PROTOCOL
The experimental protocol of the research was divided into two stages: synthesis of the adsorbent and the analytical aspect. The synthesis aspect involves the modification of the adsorbent cocos
nucifera husk whereas, the analytical aspect involves the characterization, equilibrium and kinetic
isotherms testing to determine the optimum conditions.
2. MATERIALS AND METHOD
2.1 Sample Collection and Synthesis of Mesoporous Activated Biomass
The cocos nucifera husk (coconut husk) was collected at no cost from Taraba State University Round-About, Ardo-Kola Local Government Area of Taraba State, Nigeria, figure 1. The cocos
nucifera were washed severally with surface water to remove attached films such as the mesocarp
(fleshy layers) and dust. The cocos nucifera husk was sized reduced to finely and similar sizes were obtained. The cocos nucifera was washed with tap water and sun dried. After washing it was taken for size reduction and sieved with a mesh of 750μm and was been activated, using 1.0mol of hydrochloric acid (HCl) and left for 24 hours, After then it was washed several times with distilled water to reduce or totally destroy the acidic content in the cocos nucifera in order to obtain result to a neutral point. Then the activated cocos nucifera was oven dried and stored into a container for further usage.
All other chemicals used for the preparation of adsorbent and for adsorption tests were of analytical grade and were used without further purification.
2.2 Simulation of the Synthetic Effluent
A stock solution of potassium cyanide was prepared by dissolving 4.16g of KCN into 1000ml deionized water and 100ml was measured using a measuring cylinder and added into the
adsorbent containers in their respective forms and then introduced into the speed adjusting multipurpose shaker which was left to shake for 90 minutes (i.e.1 hour 30 minutes).
2.3 Characterization of the Cocos nucifera Adsorbent 2.3.1 Surface Area Analysis using Sear’s Method
Specific surface (SSA) of the raw and activated cocos nucifera husk (adsorbent) was estimated according to Sear’s method (Sears, 1981). An activated Cocos nucifera treated with HCl to a pH 3.3 - 5. The volume was made up to 50cm3 with distilled water after the addition of 10.0g of NaCl. The titration was carried out with standard 0.1 moldm-3NaOH to pH from 4.0, and then to pH 9.0 the volume (V) required to raise the pH from 4.0 to 9.0 was noted and the surface area computed from the following equation
S(m2.g-1) = 32V – 25 (1)
Where S and V are the specific surface area in m2g-1and volume of NaoH in cm3respectively.
2.3.2 Scanning Electron Microscopy (SEM)
SEM analysis of the unused Cocos nucifera husk adsorbent and used Cocos nucifera husk adsorbent that absorbed CN- ion was carried out for micro-structure morphologies using JENWAY 3510 machine.
2.4 UV-Visible Spectrophotometric Analysis
T60 UV-Vis spectrophotometer was used for the determination of concentration of the samples using the following procedures. The system was switched on and warmed up for 30 minutes and thoroughly cleaned quartz cuvettes was used. The cuvette was filled with the residual cyanide which was mixed with picric acid for colour detection. Cyanide Ion was detected at λmax=520nm when reacted with picric acid. To get the relationship between concentration and absorbance of the calibration samples, the calibration curves were stored in the system itself and the concentration of the unknown sample was calculated directly from the absorbance.
2.5 Experimental Design
The researcher uses experimental method in the synthesis and characterization of the bio-adsorbent, preparation of cyanide solution, hence investigate the equilibrium model of batch adsorption of free cyanide in the simulated solution using the synthesized adsorbent.
In the current investigation, three sets of batch mode operation were conducted on prepared adsorbent in order to measure the adsorption behavior of cyanide contained before and after adsorption. Thus, in a representative experiment, 2.0g of dried cocos nucifera was shaken with 100ml of stock solution at varying concentration for 90 minutes at 30oC. After equilibrium, the mixture was filtered and the filtrate was treated with the prepared picric acid solution for colorimetric analysis for the residual cyanide ion concentration.
Fig.1. Depicts the plant, fruit and seed of the adsorbent 2.7 Analytical Results Modeling
2.7.1 Percentage Removal of Cyanide Ions
The percentage removal of CN-ion from the synthetic media was computed using equation 2:
where Ci = initial Cyanide ion concentration and Cr = final Cyanide ion concentration in equilibrium. The equation shows the amount of ions adsorbed by the adsorbent from the synthetic media.
2.7.2 Adsorption Capacity of the MSBSH Adsorbent
Adsorption capacity of the MSBSH (adsorbent) was computed using equation 3:
= (3)
where, Ci= initial CN-ion concentration and Cr= final CN-ion concentration in equilibrium, V = volume of CN- ion solution (L), and m = weight of MSBSH (adsorbent) in grams (g). The equation shows the amount of Cyanide ions adsorbed per gram of the adsorbent.
2.7.3 Equilibrium Models (Adsorption Isotherms)
Two important physicochemical aspects for the evaluation of adsorption process as a unit operation are the equilibria of the adsorption and kinetics. The adsorption equilibrium usually presented as adsorption isotherm is useful for predicting the performances of activated adsorbent. According to Wang and Do (1999), adsorption capacity is a prime factor to be considered in the optimization of activated adsorbent. The equilibrium relationships between adsorbate and adsorbent are described by adsorption isotherms usually is the ratio between the quantity adsorbed and that remaining in solution at a fixed temperature at equilibrium (Mohmmed et al., 1998; Masindi et al., 2014). The analysis of isotherm data by fitting them into different isotherm models is an important step to find suitable model that can be used to reproduce experimental result obtained and hence for design purposes.
The Langmuir Model (1918) is valid for monolayer sorption due to a surface with finite number of identical sites with the linearized form of the equation as:
= + (4)
Where, Ce = equilibrium concentration (mg/L), qe = amount of ion adsorbed at equilibrium (mg/g), qmax = maximum amount of ion adsorbed (mg/g) and b = Langmuir constants related to energy of sorption or measure of bond strength (L/mg). A plot of Ce/qe vs Ceshould be linear, if the data are described by the Langmuir isotherm. The value of qmaxis determined from the slope and the intercept of the plot. It is used to derive the maximum adsorption capacity and b is determined from the original equation and it represents the intensity of adsorption.
The Freundlich (1906) adsorption isotherm describes the heterogeneous surface energy by multilayer adsorption and can be expressed in linear form as:
= + (5)
Where, Ce = equilibrium concentration (mg/L), qe= amount of ion adsorbed at equilibrium (mg/g), Kf= biosorption equilibrium constant, representative of the sorption capacity or partition coefficient [mg.g-1(mg/L-1)1/n] and n = a constant indicative of biosorption intensity. i.e. values of n within 1 to 10 signifies favourable adsorption.
Temkin and Pyzhev (1940) studied the heat of adsorption and the adsorbent-adsorbate interaction on surfaces. The linearized form of the equation is represented as:
= + (6)
Where, A = Temkin Isotherm Constant or Equilibrium Binding Constant (L/g), B = Heat of sorption (Jol/mol),= ⁄ ; R = universal gas constant (8.314 kJ/kmol.K); T = Temperature (K) and bT= variation of adsoption energy.
Henry Isotherm in its linearized form is given as:
= ′ (7)
Where, K’ = Constant of adsorption at equilibrium.
The Harkin-Jura (Harkins and Jura, 1944) Isotherm can be expressed in its linear form as:
= + (8)
Where, AH= Isotherm constant; B2= Isotherm constant which accounts for monolayer adsorption and can be explained by the existence of a heterogeneous pore distribution. The fitting of the experimental data to this equation attest to the heterogeneous nature of the adsorbent.
2.7.4 Kinetic Models (Adsorption Kinetics)
The Contact Time models were also investigated, which includes;
Pseudo-First Order kinetic model (Lagergren, 1898) in its linearized form is given as:
( − ) = ( ) − . . (9)
Where, k1 = the rate constant of pseudo-first order model (g/mg.min), t = time taken for the adsorption (min), qe = amount adsorbed at equilibrium time (mg/g) and qt = amount adsorbed at time, t (mg/g). The value of k1can be obtained from the slope of Log (qe- qt) versus t.
Pseudo-Second Order kinetic model (Ho and McKay, 1999) is applied in adsorption when the applicability of the first-order kinetics becomes unfeasible. The equation expressed as:
= + . (10)
Where, k2is the pseudo-second order model adsorption rate constant (g/mg/min).
Intra-Particle Diffusion Kinetic Model (Weber and Morris, 1963), in its linearized form is given as:
= + (11)
Where, ki is the adsorption rate constant of intra – particle transport (g/mg/min-1/2), C is the intercept that gives an idea about the thickness of the boundary layer (mg/g).
Elovich Kinetic Model (Zeldowitsch, 1934; Low, 1960) in its linearized form is given as:
= ln( ) + (12)
Where, α is the initial adsorption rate (mg/g.min) and β is the desorption constant (g/mg).
In this research work, the linear coefficient of determination (Degree of Fitness) (R2) was employed for error analysis. Theoretically, R2values ranges from 0 to 1, with values equal to 1 to depict 100% of the variation of the experimental data.
3. RESULTS AND DISCUSSION
This section gives a valid detail of the result obtain from the investigation on adsorption performance of mesoporous activated biomass prepared from cocos nucifera husk and tends to discuss the effect of Scanning Electron Microscope on the adsorbent as well as the effect of adsorbent dosage (AD), pH, contact time and initial ion concentration on the adsorption of cyanide ions from activated biomass prepared from cocos nucifera husk.
To find out a suitable model kinetic equation predicting the equilibrium adsorption of cyanide ion from waste water, Langmuir, Freundlich, Henry, Temkin, Hakin-Jura isotherm models have been best tested according to (Tsunatu et al., 2015).
3.1 Characterization of the Adsorbent
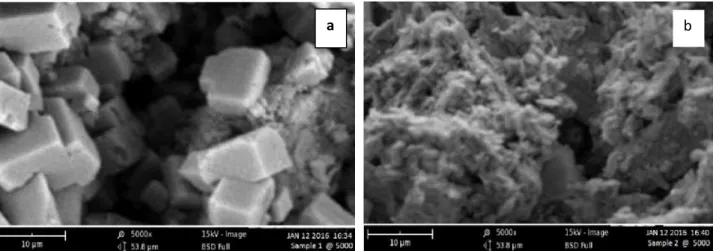
The image of the activated cocos nucifera husk before adsorption from the micrograph of the adsorbent is clear, no formation of any substance on top and also the pores of the adsorbent were visible. Whereas after the absorption of cyanide ion as shown in figure 2 respectively, the micrograph of this adsorbent shows the formation of dark layer on the surface which may be due to adsorption of cyanide ion. From the SEM micrograph analysis of the adsorbent after the adsorption of cyanide ion, it is observed that most of the pores in the adsorbent were covered by cyanide ion. It could also be seen that more uneven and rough surface morphology exist in cyanide ion loaded on the adsorbent. Difference in the adsorption capacity of this adsorbent was mainly due to the difference in their surface porosity.
Fig.2. SEM Analysis of Cocos nucifera Husk Adsorbent Before and after the adsorption of cyanide ion
3.1.2 Surface Area of Raw and Activated Cocos nucifera husk Using Sear’s Method.
Surface area of raw and activated adsorbent were determined using Sear’s method, table 1 shows that specific surface area of the adsorbent increases from raw to that activated, that is, active sites or functional groups of the adsorbent increases due to activation with 1.0M HCl.
Table 1: Surface Area of Raw and Activated Cocos nucifera Husk (Adsorbent)
Adsorbent Raw adsorbent (m2.g-1) Activated adsorbent (m2.g-1)
Cocos nucifera husk 12.56 32
3.2 Effects of pH, Adsorbent Dosage, Initial Cyanide Ion Concentration and Contact Time on Cyanide Ion Removal
The effect of adsorbent dose on cyanide ion removal was investigated and the removal of cyanide ion was found to vary within 82.28 – 84.75% at less than 2.0g. But at exactly 2.0g/100ml there was a significant increase in cyanide ion removal up to 84.82% which remains almost constant at close to 2.5 – 3.0g /ml. Since the increase of adsorbent dosage increases the number of active sites, this enhances the percentage removal up to 2.0g/100ml where the maximum adsorption occurs. The cocos nucifera (coconut) husk in this work is of cause more effective removing about 84.82% cyanide ion in waste water at dose 2.0g/100ml of 100mg/l potassium cyanide solution at 90minute.
Fig.3. Effect of Adsorbent Dosage on Cyanide Ion Removal
The effect of contact time was investigated for the removal of cyanide ions from wastewater, figure 4 shows that at least 90.2% cyanide ion removal was achieved for 100mg/L of cyanide solution at 120 minutes. This implies that, longer time result in favourability of cocos nucifera husk for adsorption of cyanide ion from aqueous solution.
80 81 82 83 84 85 86 0 1 2 3 4 5 6 7 8 9 Pe rc en tag e Cy an id e Re m ov al Adsorbent Dosage (g)
Fig.4. Effect of Contact Time on Cyanide Ion Removal
The influence of varying initial ion concentration (IIC) from 100mg/L to 800mg/L was investigated for the MSBSH adsorbent, figure 5 shows the adsorption results obtained by varying initial ion concentration from 100mg/L to 800mg/L whereas about 88.5% was achieved at lower cyanide ion concentration of 100mg/L. The increase of cyanide ion removal as an efficacy of its concentration can be explained by the increase of available free sites on the adsorbent for the adsorption of cyanide ion with increase KCN-concentration in bulk solution of a fixed mass of the adsorbent (Katyl et al., 2003).
Fig.5. Effect of Initial Cyanide Concentration on Cyanide Ion Removal
The effect of pH was investigated for the adsorption of Cyanide ions onto MSBSH adsorbent, base on figure 6, solution pH played an important role in the removal of cyanide ion from
82 84 86 88 90 92 94 0 20 40 60 80 100 120 140 Pe rc en tag e Cy an id e Re m ov al Time (mins) 0 20 40 60 80 100 0 100 200 300 400 500 600 700 800 900 Pe rc en tag e Cy an id e Re m ov al
aqueous solution using activated biomass. From pH 2 – 9, adsorption kept on decreasing due to the effect created by sulphuric acid used for pH regulation only at pH 10 that the significant drop in percentage removal was noticed sharply. It thus could be assumed that either the hydrogen ion (H+) from hydrochloric acid (HCL) reacted with cyanide from the solution or the hydrochloric acid reactivated the adsorbent (by creation of free sites) for efficient cyanide ion adsorption.
Fig.5. Effect of pH on Cyanide Ion Removal
3.3 Equilibrium Model Test for initial ion concentration using Langmuir, Freundlich, Temkin, Henry and Harkin-Jura Isotherm.
3.3.1 The Langmuir Adsorption Isotherm.
The Langmuir adsorption isotherm for the adsorption of Cyanide Ions onto the MSBS husk adsorbent is presented in Figure 6. The ratio of the equilibrium concentration to the ratio of the amount of iron adsorbed (Ce/Qe) was plotted against the equilibrium concentration of cyanide Ion (Ce).
The linear plot of ce/qe against the equilibrium concentration (ce) shows that Langmuir constant qmax (43.478) and b (0.0112) were determined from the slope and intercept of the plot. Correlation Coefficient (R2) is 0.742 which reveals that the isotherm data fit the Langmuir model. In terms of dimensionless constant, separation factor RLwas determined (Weber et al., 1974) by the equation. RL= (1/(1+bCo)) 13 0 20 40 60 80 100 0 2 4 6 8 10 12 14 Pe rc en tag e Cy an id e Re m ov al pH
Where Co (mg/L) is the highest initial concentration of adsorbent and b (L/mg) is Langmuir isotherm constant, the parameter RL indicates the nature of shape of the isotherm accordingly with value of 0.471 which depicts favourable adsorption.
Fig.6. Langmuir Adsorption Isotherm for the removal of cyanide ion.
(Process condition: pH 3, Temp 300C, Adsorbent Dose 2.0g/100ml; Time 90 min, rpm=120) 3.3.2 Freundlich Adsorption Isotherm
The linear form of the Freundlich Isotherm is represented by the evaluation of equation 5.
Where kf is biosorption equilibrium constant representative of the sorption capacity [mg.g-1 (mg.g-1) 1/n], n is a constant indicative of biosorption intensity i.e values of n within 1 -10 signifies favourable adsorption and qe is the amount of CN- ion adsorbed (mg/L)1/n is the adsorption intensity, the value of kf (1.448) and n (1.692) are calculated from the intercept and slope of the plot of log qe versus log Ce respectively. The high value of 1/n signifies that the forces acting signifies strong rate from the values kf and 1/n, it reveals that activated cocos
nucifera husk is more efficient for removal of cyanide ions. The linearity of the plot and high
correlation coefficient (R2) obtained (0.836) which is also greater than 0.69 reveals that the Isotherm is consistent with Freundlich Model. (Net, 2009) reported that R2 greater than 0.89 shows that the adsorption data confirms to the model as shown in figure 7.
y = 0.023x + 2.046 R² = 0.742 0 1 2 3 4 5 6 7 0 50 100 150 200 Ce /Qe (g /L ) Ce (mg/L)
Fig.7. Freudlich Adsorption Isotherms for Cyanide ion.
(Process condition: AD: 2.0g/100ml, Temp: 300C, Time: 90min pH 3, rpm: 120)
3.3.3 Temkin Adsorption Isotherm Model for Cyanide Ion
A linear relationship was also exhibited from the plot of amount of cyanide ion adsorbent qe at equilibrium against the natural logarithm of Ce. Correlation Coefficient (R2= 0.875) obtained for Temkin adsorption Isotherm models for cyanide ion in figure 8 shows that Temkin Models can also be used to predict the biosorption of cyanide ion using cocos nucifera husk as low cost adsorbent. y = 0.591x + 0.161 R² = 0.836 0 0.2 0.4 0.6 0.8 1 1.2 1.4 1.6 1 1.2 1.4 1.6 1.8 2 2.2 2.4 Lo g Qe Log Ce
Fig.8. Temkin Adsorption Isotherms for Cyanide ion.
(Process condition: AD: 2.0g/100ml, Temp: 300C, Time: 90min pH 3, rpm: 120)
3.3.4 Henry Adsorption Isotherm
The Henry Isotherm Equation is generally expressed as qe = k1ce where k1 is the constant of adsorption equilibrium, qeis quantity of ion adsorbed at equilibrium (mg/g) and Ceis equilibrium ion concentration (mg/L). Figure 9 shows the batch adsorption isotherm of cyanide ion onto
cocos nucifera seed husk adsorbent, this shows that the Henry model can also be used to predict
the adsorption of cyanide ion using cocos nucefera seed husk.
Fig.9. Henry Adsorption Isotherm for the Removal of CN-Ions. (Process condition: AD: 2.0g/100ml, Temp 300C, Time: 90min: pH 3, rpm 120)
y = 0.146x + 6.479 R² = 0.892 0 5 10 15 20 25 30 35 0 50 100 150 200 Qe (m g/ g) Ce (mg/L) y = 8.576x - 16.18 R² = 0.875 0 5 10 15 20 25 30 35 2 2.5 3 3.5 4 4.5 5 5.5 Qe (m g/ g) ln Ce
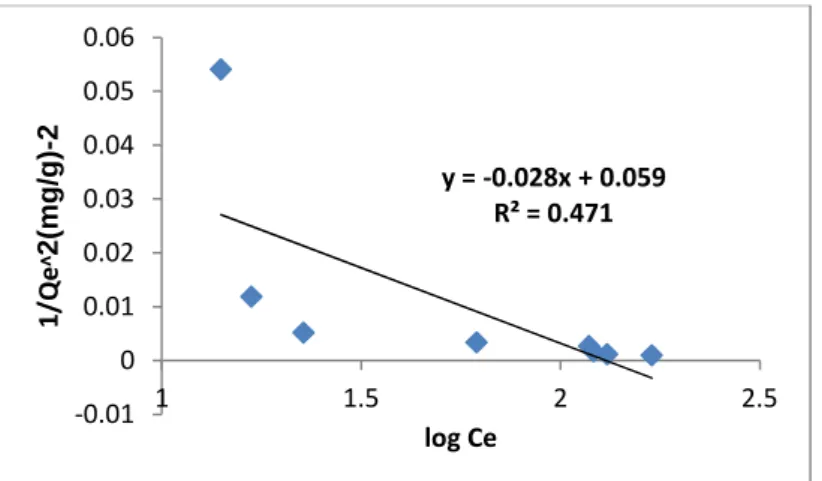
3.3.5 Harkin-Jura Adsorption Isotherm
The Harkin-Jura constant AH (35.714) and B2 (2.107) where determined from the slope and intercept of the linear plot of 1/qe2versus log Ce.
In Figure 10, the Correlation Coefficient R2 (0.471) obtained for Harkin Jura adsorption model, reveals that the equilibrium biosorption data is poorly described by this model which further supported chemisorptions process.
Fig.10. Harkin-Jura Adsorption Isotherm for the Removal of CN-Ion. (Process condition: AD: 2.0g/100ml. Temp 300C, Time 90min, pH 3, rpm: 120)
Table 2: Different Parameters and their Values for Adsorption Isotherms
ISOTHERM PARAMETERS VALUES
Langmuir R2 Qmax(mg/g) B (L/mg) RL 0.742 43.478 0.0112 0.471 Freudlich R2 N 1/n Kf(L/g) 0.836 1.692 0.591 1.448 Temkin R2 B (J/mg) A (L/s) 0.875 8.576 9.39E-09 Henry R2 K1(L/g) 0.892 0.146 Harkin - Jura R2 AH B2 0.471 35.714 1.107 y = -0.028x + 0.059 R² = 0.471 -0.01 0 0.01 0.02 0.03 0.04 0.05 0.06 1 1.5 2 2.5 1/ Qe ᶺ2 (m g /g )-2 log Ce
3.4 Kinetic Model Test for Time Using Pseudo-First Order, Pseudo-Second Order, Intra-Particle Diffusion and Elovich Kinetic Models.
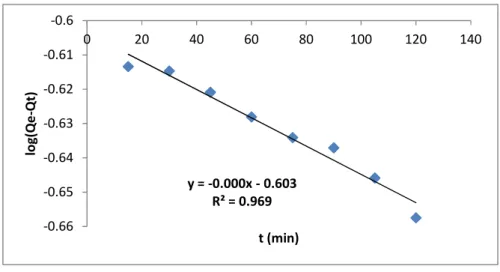
3.4.1 Pseudo-First Order Kinetic Model
Figure 11 shows the batch adsorption model of cyanide ion on cocos nucifera Husk at 300C, the logarithm of amount adsorbed at equilibrium Time (qe) minutes amount at (qt) was plotted against the time (t) of the metal ion adsorbed and a negative slope was obtained. Similarly correlation coefficient (R2= 0.969) obtained for Pseudo-first order kinetic model for cyanide ion adsorption shows that the model cannot be used to predict the biosorption of cyanide ions using cocos
nucifera husk as a low cost adsorbent.
Fig.11. Pseudo First Order Kinetic Model for Cyanide Ion
(Process condition: AD: 2.0g/100ml. Temp 300C, Time 90min, pH 3, rpm: 120)
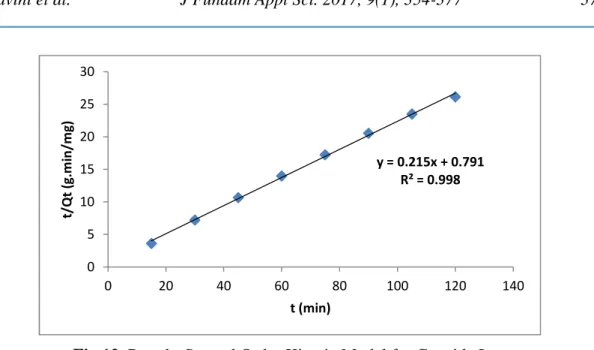
3.4.2 Pseudo-Second Order Kinetic Mode for Cyanide Ion.
Figure 12 shows the batch adsorption of cyanide ion on cocos nucifera husk at 300C. The ratio of Time (t) and amount adsorbed at Time (Qt) (t/qt)was plotted against Time (t) of the cyanide ion adsorbed. The adsorption rate constant (K2) and the amount adsorbed at equilibrium time (qe) are obtained directly from the slope and intercept of the linear plot. The linearity of the plot and high correlation coefficient R2obtained (0.998) for Pseudo-second order adsorption model for cyanide ions which clearly indicated in Figure 12 that this model can be used to predict the biosorption of cyanide ion using cocos nucifera husk adsorbent.
y = -0.000x - 0.603 R² = 0.969 -0.66 -0.65 -0.64 -0.63 -0.62 -0.61 -0.6 0 20 40 60 80 100 120 140 lo g( Qe -Qt ) t (min)
Fig.12. Pseudo-Second Order Kinetic Model for Cyanide Ion. (Process condition: AD: 2.0g/100ml, Temp 300C, Time 90 min pH 3, rpm 120)
3.4.3 Intra-Particle Diffusion Kinetic Model for Cyanide Ion
Figure 13 shows the adsorption model of cyanide ion on cocos nucifera at 300C, the amount adsorbed at Time (qt) was plotted against t1/2 of the cyanide ion adsorbed. Similarly the Correlation Coefficient (R2 = 0.909) obtained for intra-particle kinetic model for cyanide ion adsorption and this shows that, the model can be used to predict the sorption of cyanide ion using cocos nucifera husk.
Fig.13. Intra-Particle Diffusion Kinetic Model for Cyanide Ion. (Process condition: AD: 2.0g/100ml, Temp 300C, Time 90 min pH 3, rpm 120)
y = 0.215x + 0.791 R² = 0.998 0 5 10 15 20 25 30 0 20 40 60 80 100 120 140 t/ Qt (g .m in /m g) t (min) y = 0.060x + 3.849 R² = 0.909 4 4.1 4.2 4.3 4.4 4.5 4.6 4.7 3 5 7 9 11 13 Qt (m g/ g) t^0.5 (min^0.5)
3.4.4 Elovich Kinetic Model for Cyanide Ion
If cyanide ion (CN-) adsorption fits with the Elovich model, a plot of qt and ln (t) should yield a linear relationship with a slope of (1/ β) 0.197 with an intercept of 3.529. The Elovich Model parameters α, β and correlation coefficient R2 are 3.9653E13, 0.197 and 0.814 respectively. The experimental data such as initial adsorption rate (α) adsorption constant (β) and the correlation coefficient R2 calculated from the model indicates that the initial adsorption (α) increase with temperature similar to that of initial adsorption rate in pseudo-second-order kinetic model. This may be due to increase in the pore or active sites on the cocos nucifera husk developed as adsorbent.
Fig.14. Elovich Kinetic Model for Cyanide Ion.
(Process condition: AD: 2.0g/100ml, Temp 300C, Time 90 min pH 3, rpm 120) Table 3: Different Parameters and their Values for Adsorption Kinetic Models
KINETIC MODEL PARAMETERS VALUES
Pseudo-First Order R2 K1(min-1) qe(mg/g) 0.969 -0.00 4.00 Pseudo-Second Order R2 qe(mg/g) K2(mg/g/min) 0.998 4.651 0.058 Intra-particle Diffusion R2 K’ (mg/g/min1/2) 0.909 0.060 Elovich Kinetic Model R2
β α 0.814 0.197 3.9653E13 y = 0.197x + 3.529 R² = 0.814 4 4.1 4.2 4.3 4.4 4.5 4.6 4.7 2 2.5 3 3.5 4 4.5 5 Qt (m g/ g) Ln t
Table 4: Optimum Data Obtained in this Adsorption Study
4. CONCLUSION
The removal of cyanide ion from aqueous solution by an absorbent prepared from cocos nucifera (Coconut) husk was investigated; the absorbent was first prepared through physical
(Carbonization) and chemical (activation) process. The sorption capacity, Characterization of the absorbent effect of pH, contact time, initial cyanide concentration, absorbent dose, equilibrium and kinetic models were explored. From the result and discussion it showed doubtlessly the effectiveness of the prepared and activated absorbent in the decontamination of waste water bearing cyanide ions. The equilibrium study showed that the adsorption capacity of cyanide ion from aqueous solution was effective. Hence, the adsorption study behaviour of cocos nucifera husk adsorbent shows its potential ability in the treatment of waste water (effluent) bearing cyanide ions.
5. REFERENCES
[1] Amuda, O.S. and Ibrahim, A. B. (2006): Industrial Wastewater Treatment using Natural Material as Adsorbent. Africa Journal Biotechnology, 5 (16): 1483- 1487
[2] Reed, B. F., Arnnachalam, S. and Thomas, B. (1994): Removal of Lead and Chromium from Aqueous Waste streams Using Grannular Activated Carbon (GAC) Columns.
Environ. Prog. Vol.13, Pp. 60 – 65.
[3] National Center for Environmental Health (NCEH) / Agency for Toxic Substances and Disease Registry (ATSDR); (2013)
S/No Particular Optimum Data of Cyanide
Ion Removal
1. TIME (min) 90
2. pH 3
3. Dosage (g) 2.0
4. Concentration ( mg/L) 200
5. Equilibrium models Henry Model
6. Kinetic Models Pseudo Second Order
[4] Nwabanne, J.T., and Igbokwe, P.K. (2012): Comparative Study to Lead (II) Removal from Aqueous Solution using Different Adsorbents. International journals of Engineering Research and Application (Ijera), 2 (4) 1830- 1838
[5] Faisal, M. and Hasnain, S. (2004): Microbial Conversion of Cr (VI) in Industrial Effluent, African J. biotechnol 3(II): 610 – 617
[6] Dursun A.Y., Alik A.C and Aksu (1999): Degradation of Ferrous (II) Cyanide Complex Ions by pseudomonas fluorescence Process, Biochem. (34): 901-908
[7] Young, C.A. and Jordan, T.S. (2004): Cyanide Remediation: Current and Past Technologies; Proceeding of the 10th Annual Conference on Hazardous Waste Research: 104-129
[8] Patil,Y.B. and Paknikar, K.M. (2000): Development of a Process for Biodetoxification of Metal Cyanides from Waste Water, Pro. Biochem, (35) 1139- 1151
[9] Siti-Nur, A.A., Mohd, H. S., liaskamal, M. and Shamsulizhar. (2013): “Adsorption Process of Heavy Metals by Lowcost Adsorbent: A Review Department of Chemical and Environmental Engineering, Faculty of Engineering, University, Putra Malaysia, Department of Chemistry, Faculty of Applied Science, University Technology, MARA (Perlis), DOI: 10. 5829|idosi.Wasj.28.11.1874.
[10] Sears G.W. (1981). Determination of Specific Surface Area by Titration with Sodium
Hydroxide. Journal of Analytical Chem. 28.
[11] Wang, K and Do D.D (1999). Sorption Equilibrium and kinetics of Hydrocarbon onto activated carbon sample having different microspore size distribution absorbers journal of American institute of chemical engineering 20:228-238.
[12] Masindi, V., Gitari, W.M. and Ngulube, T. (2014): Deflouridation of Drinking Water using Al3+- Modified Bentonite Clay: Optimization of Flouride Adsorption Conditions,
Toxicological and Environmental Chemistry.
http://dx.doi.org/10.1080/02772248.2014.977289. pp. 1 -16.
[13] Langmuir, I. (1918): The Adsorption of Gases on Plane Surfaces of Glass, Mica and Platinum. J.A.M. Chem. Soc., (40), pp. 1361 – 1403.
[14] Freundlich, H.Z. (1906): Over the Adsorption in Solution. J. Phys. Chem., (57A), pp. 385 – 470.
[15] Temkin, M.J. and Pyzhev, V. (1940): Kinetics of Ammonia Synthesis on Promoted Iron Catalysts. Acta Physiochim. Urss. (12), pp. 217 – 222.
[16] Harkins, W.D. and Jura, E.J. (1944): The Decrease of Free Surface Energy as a Basis for the Development of Equations for Adsorption Isotherms; and the Existence of Two Condensed Phases in Films on Solids. J. Chem. Phys., (12), pp. 112 – 113
[17] Lagergren, S. (1898): Zur Theorie Der Sogenannten Adsorption Geloster. Stoffe. Kungliga. Svenska vetenskapsakademtens., 24 (2): pp. 1 - 39.
[18] Ho,Y.S. and McKay, G. (1999): Pseudo-Second Order Model for Sorption Processes. Process Biochemistry, Vol. 34. Pp. 451 – 465.
[19] Weber, W.J. and Morris, J.C. (1963): Kinetics of Adsorption on Carbon from Solution. J. Saint. Eng. Div. Am. Soc. Civil. Eng. (89): 31.
[20] Zeldowitsch, J. (1934): U¨ ber den mechanismus der katalytischen oxydation von CO and MnO2. Acta Physicochem URSS 1:364– 449
[21] Low, M.J.D. (1960): Kinetics of Chemisorptions of Gases on Solids, Chem. Reviews. Vol. 60. Pp. 267 -312
[22] Katyal, S., Thambimuthu, K., and Valix, M. (2003): Carbonation of bagasse in a fixed bed reactor: Influence of process variables on char yield and characteristics, Renew. Energy, 28(5) 713–725.
[23] Tsunatu D.Y., Taura, U. H. and Jirah, E.U. (2015b): Kinetic Studies of Bio-Sorption of Cyanide Ions From Agueous Solution Using Carbon Black Developed from Shea Butter Seed Husk as an Adsorbent. American Chemical Science Journal Vol.8 (2) ISSN: 2249-0205. Pp: 1-11
[24] Weber, T.W and Chatravorti, R.K. (1974): Pore and Solid Diffusion Models for Fixed Bed, Adsorbs Journal of American Institute of chemical Engineering 20:228-238
[25] Tsunatu,D.Y, Azuaga, I.C., Tickson, T.S and Jirah, E.U (2015): Development and Characterization of shear butter seed husk carbon black for cyanide bearing waste water treatment, J. of physical and chemical sciences. Vol.2 (4).Pp.1-5, DOI: 10. 15297/JPCS.V2I4.03.
How to cite this article:
Yavini T. D, Yunusa M. H, Atiku K. G, Musa A. A, Ruth P. K. Investigation on adsorption performance of mesoporous activated biomass prepared from cocos nucifera husk for harzadous cyanide wastewater treatment. J. Fundam. Appl. Sci., 2017, 9(1), 354-377.