HAL Id: hal-01069397
https://hal.archives-ouvertes.fr/hal-01069397
Submitted on 29 Sep 2014HAL is a multi-disciplinary open access archive for the deposit and dissemination of sci-entific research documents, whether they are pub-lished or not. The documents may come from teaching and research institutions in France or abroad, or from public or private research centers.
L’archive ouverte pluridisciplinaire HAL, est destinée au dépôt et à la diffusion de documents scientifiques de niveau recherche, publiés ou non, émanant des établissements d’enseignement et de recherche français ou étrangers, des laboratoires publics ou privés.
Matthias Kwaterski, Jean-Michel Herri, Aurélie Galfré, Pedro Brantuas, Ana
Cameirão, Yamina Ouabbas, Baptiste Bouillot, Sanehiro Muromachi, Roy
Ohmura
To cite this version:
Matthias Kwaterski, Jean-Michel Herri, Aurélie Galfré, Pedro Brantuas, Ana Cameirão, et al.. CO2 capture by using hydrates: 2) Modeling the gas storage capacity of TBAB semi-clathrate hydrates. The 8th International Conference on Gas Hydrates, Jul 2014, Pékin, China. pp.t1-72. �hal-01069397�
CO2 CAPTURE BY USING HYDRATES:
2) MODELING THE GAS STORAGE CAPACITY OF TBAB
SEMI-CLATHRATE HYDRATES
KWATERSKI Matthias, HERRI Jean-Michel(*), GALFRE Aurélie, BRANTUAS, Pedro, CAMEIRAO Ana, OUABBAS Yamina, BOUILLOT Baptiste
Gas Hydrate Dynamics Centre, Ecole Nationale Supérieure des Mines de Saint-Etienne, 158 Cours Fauriel, 42023 Saint-Etienne, France
(*) corresponding author: herri@emse.fr MUROMACHI Sanehiro,
National Institute of Advanced Industrial Science and Technology (AIST) Tsukuba, Ibaraki 305-8569, JAPAN
OHMURA Ryo
Department of Mechanical Engineering, Keio University, Yokohama, Kanagawa 223-8522 JAPAN
ABSTRACT
The CO2 capture by using clathrates is a method which takes profit of the CO2 selectivity in gas hydrate to separate it from nitrogen, or other exhausting gases from gas combustion or coal combustion. The bottleneck is the operative pressure which still remains high and needs to be drop down to 0.5 MPa in order to compete with the reference case using Amines. After two national projects (SECOHYA, ACACIA) and a european program (iCAP), we tested different classes of thermodynamic additives, organic ones (water un soluble cyclopentane, water soluble THF) which form classical gas hydrates with structure SII, and ionic ones (Tetra-N-Butyl Ammonium Bromide, TBAB) which forms new types of structures.
In this presentation, we present the modeling of the gas storage capacity of the TBAB semi clathrate hydrates. We propose a set of new equilibrium data about the CO2-N2-TBAB Hydrate-Liquid-Vapor equilibrium. We complete it with the literature data. These experimental results are modeled elsewhere. We present a simplification of the model to simulate the hydrate volume storage and the operative pressure versus the operative temperature.
The conclusion of this work emphasizes that the operative can be drop to the atmospheric pressure, but the counterpart is the gas storage capacity which becomes null.
Keywords: clathrates and semi clathrates hydrates, thermodynamic additives, gas separation
INTRODUCTION
TBAB (Tetra-n-butyl ammonium bromide) is capable of generating crystals of semi-clathrate hydrate compounds which are formed according to the reverse reaction of the general dissociation equilibrium: C A A w 2 | | w 2 w C w A w
C A
H O (S
H)
H O (L )
C
zC(L )
A
z(L )
ν νν
ν
ν
+ν
−⋅
=
=
+
+
(1)In the particular case of TBAB considered here:
4 9 4
C≡( -C H ) Nn + and
A
≡
Br
− , thestoichiometric coefficients
ν
C andν
A as well asthe charge numbers
z
C and|
z
A|
of thecorresponding ions are unity. Different numerical
values have been reported in the literature for
ν
w,the stoichiometric coefficient of water. This last quantity is also called the hydration number when related to one stoichiometric unit of the salt, .It corresponds to a given semi-clathrate hydrate compound structure.
The presence of the quaternary ammonium allows
stabilizing the three-dimensional molecular
1, the crystallization temperatures at equilibrium are plotted as function of the mass fraction of TBAB under an ambient pressure. The phase
diagram shows that the tetragonal TBAB 26H2O
hydrate (S26) corresponding to 0.40 mass fraction is the most stable for simple TBAB semiclathrate hydrates. Gaponenko et al. (1984) reported four different semi-clathrate hydrates with hydration
numbers
ν
w=
24, 26, 32, 36
. Shimada andco-workers (2005a) have succeeded in the crystal structure analysis for one, i.e., the orthorhombic
TBAB 38H2O hydrate (S38), which is considered
to be the second most stable structure and identical
with the TBAB 36H2O hydrate reported by
Gaponenko et al.
In the presence of guest gas molecules, e.g., CH4,
CO2 and N2, these two structure may form. To develop the phase equilibrium model in this system, information of the hydrate structures is necessary. For S38, the structure can be written as TBAB 3D where D denotes the free dodecahedral cavity which is available for the guest gas. (Shimada et al., 2005b). The actual structure of S26 is still unclear, however, it may be plausible that the structure is identical with the basic tetragonal semiclathrate-hydrate structure, that is, TBAB 2D. (Gaponenko et al. 1984, Rodionova et al., 2013)
The maximum gas storage capacity of the TBAB,
38H2O structure can be calculated by the
following scheme. The density of the structure is :
38 3
1070
.
S
TBAB hyd
kg m
ρ
=
− .The molar mass of TBAB, 38H2O is
(
)
38 3 1322 38 18 10
.
S TBAB hydM
=
+ ×
−g mol
− .The S38 structure allows guest-gas occupancy in the three free cavities per molecules of TBAB (Davidson Water, 1973). So the maximum storage capacity is given by:
(
)
38 38, 3 33
3191
322 38 18 10
S TBAB hyd STORAGE S Maxmole
n
m
ρ
−×
=
=
+ ×
(2) 270 272 274 276 278 280 282 284 286 288 0 20 40 60 80 %mass TBAB T [ K] ICE, from Oyama et al (2002)
TBAB Type A, from Oyama et al (2002) TBAB Type B, from Oyama et al (2002) Lipkowski, 2002
TBAB Type A, from Darbouret (2005a) TBAB Type B, from Darbouret (2005a) TBAB Type B, from Sato et al (2013)
Figure 1 : T,x– phase diagram of TBAB-water binary system in the region of crystallization of clathrates polyhydrates (Lipkowski, et al., 2002, Oyama et al., 2005, Darbouret, 2005a, Sato et al, 2013).
It corresponds to a maximum storage volume of
3 3
38,
76.6
.
STORAGE S MAX
V
=
m STP m
− .The effective storage capacity takes into account the occupancy of cavities
θ
j by component j. It depends on thermodynamics.38, 38,
STORAGE STORAGE S j j S Max
n
= ⋅
θ
n
(3)The Liquid solution is TBAB solution at a weight fraction of wTBABL =0.32 . We can evaluate the mole number of water per volume of liquid solution:
(
)
, 3 38954 3 322 38 18 0 38 1 STO L T RAGE BAB water L mole n mρ
− = = + × ×(4)
So, the Liquid storage capacity of gas components j is given by: , , , STORAGE STORAGE j L water L j L
n
=
n
x
(5)
[
]
, / j Lx mole of component j mole of water is the solubility of the component j.
The evaluation of the storage capacity of the hydrate phase implies to determine the occupancy of cavities
θ
j which depends in the end on the pressure, via a Langmuir rule following theclassical approach of the clathrate hydrate modeling.
Modelling of semi-clathrate hydrates.
In this section, we present the final equation of semi-clathrate equilibrium. It is based on the theoretical framework of the model of Paricaud (2011) for describing the salt, semiclathrate as well as gas semiclathrate hydrate. This approach has been re-used and presented by Kwaterski et al and Herri (2011). The corresponding equation enable the modeling of solid-liquid-vapour phase and combined chemical and phase equilibria encountered in binary systems of the type
H2O+CA (abbreviation for a binary electrolyte
C , CA A , CA
Cν Aν composed of
ν
C, CA cations CzC+and
ν
A, CA anions A|zA|−) and H2O+TBAB, as well
as the ternary system of the type H2O+TBAB+gas.
The phases being present in a stable equilibrium state over defined regions of concentrations are characterized through a minimum in the total Gibbs energy function:
dis m disGm G RT ∆ ∆ = ○
(
w)
w H L cgr dis m H L cgr T H RT ∆ + ○(
w)
w H L cgr H L cgr dis , m 1 p T T RT T C − ∆ + ○(
w)
w w w H L H L H L cgr cgr cgr H L ref dis m cgr 1 ln , T T T R T T V T p − + ∆ + ○(
)
p p RT − ○(
)
w w w wtype cav type g w w L , L L , L C C , C A A , A L L w w w 1 1 ln ln ln ln 1 0 x x N N i j i i j x x x ν γ ν γ ν γ ν θ ∗ ∗ = = + + + − − = ∑ ∑ (6) rGm disGm
∆ = ∆ is the molar Gibbs free energy
change accompanying the dissociation reaction. Eq. (6) in turn is gained from the necessary condition, that the total Gibbs energy in the independent variables T, p and composition is a
minimum at equilibrium. H Lw H Lw
cgr cgr (
T =T p○
) is the congruent melting temperature of the hydrate at
p= p○
and is taken as the reference temperature.
At the point with p= p○
and H Lw
cgr
T=T , the
composition of the liquid phase equals the stoichiometric composition of the hydrate phase. It enables the calculation of ∆disGm○ H Lw
cgr
(T ) from
the experimental determination of the position of the congruent point as reported in Table 1:
disGm ∆ ○
(
)
(
)
(
)
(
)
w w w w w w w w H L cgr H L H L H w w w cgr H L cgr , L H L , L H L H H H H C C , C cgr A A , A cgr ln , ln x , ln x , T x T x RT x T x x T x ν γ ν γ∗ ν γ∗ = + + (7)The activity coefficient Lw Lw
w ( , ,T p xw )
γ
of waterneeds to be determined elsewhere. Whereas Paricaud (2011) uses the SAFT equation of state as a model for describing the activity coefficient, we are work with the eNRTL model which details are given in Kwaterki and Herri (2014). It is assumed that the solid electrolyte is dissolved in
the liquid aqueous phase by completely
dissociating into its ions according to Eq.1.
Table 1
Mascroscopic parameters of semi clathrates hydrates and Ice (this work)S26 S38 disGm ∆ ○ Lw I Hm ∆ ○ disGm ∆ ○ Lw I Hm ∆ ○
J/mol J/mol J/mol J/mol
916 11640 654 11092 This work disHm ∆ ○ Lw I Hm = ∆ ○ 6011 − , where 6011 is the enthalpy of fusion of Ice (J/mol)
Table 2
Reference properties from this workUnit S26 S38 ref dis
V
m∆
10-6 m3/mol -30(*) -30(*) disC
p, m∆
○(
H Lw)
cgrT
J/(mol K-1) 0 0(*) in accordance with Paricaud (2011)
disCp, m ∆ ○ H Lw cgr (T ) and ∆disHm○ H Lw cgr (T ) , the standard
values of the molar isobaric heat capacity and the enthalpy in Hydrate phase are gained through
adjustments of the H Lw -coexistence curves
(Figure 1) and are reported on Table 1 and Table 2. Another method could be to retrieve then from the dissociation enthalpies directly. If values of the standard molar isobaric heat capacity upon hydrate dissociation are measured directly, they can additionally be used to adjust ∆disCp○, m H Lw
cgr
(T ) .
However, ∆disCp○, m H Lw
cgr
(T ) has been set to zero in our calculations. ref disVm ∆ , evaluated at H Lw cgr T and p○ , accounts for the effect of pressure on the melting points for the water + salt binary systems (2011). The value of –
30 cm3 mol–1 has been used in accordance with Paricaud (2011).
In our modelling calculations, type A
semiclathrate hydrate with νw =26 is assumed,
structure B semiclathrate hydrate with νw =38 is assumed also.
The determination of the occupancy factor θj i is derived from the classical and original work of van der Waals and Platteeuw (1959)
type g 1 1 j i j j i N j i j j C f C f θ = = +
∑
(8)The values of the fugacities fj can be calculated by means of a suitable equation of state for the gas phase. In our modeling calculations, the Soave-Redlich-Kwong equation of state (1959) was used for that purpose. The C are the so-called the j i
Langmuir constants C which in case of spherical j i
cavities, which can be linked to the cell radial
symmetric potential between the particle j and the
host molecules, wj i( )r , as follows:
( )
cav , 2 B 0 B 4 exp i R j i j i w r C r dr k T k T π = − ∫
(37)where the r denotes the distance between the centre of mass of the gas molecule and the centre of the cavity, Rcav, i stands for the effective radius of cavity i, and k for the Boltzmann constant. B
Whereas a square-well (SW) potential (see e.g. Parrish and Prausnitz,1972) is used by Paricaud (2011), we use the Kihara potential in our calculations (see e.g. McKoy and Sinagoglu , 1963). For details on the procedure of adjusting the Kihara potential parameters see Herri et al., 2011).
The Kihara potential (Table 3) were adjusted to the experimental data.
Table 3 Kihara parameters, after optimisation
from experimental data with the GasHyDyn simulator, implemented with reference parameters from Table 1 and Table 2.
S26 S38 k ε a σ k ε a σ CO2 235 (*) 0.6805 (*) 3.1 (*) 145.26 (*) 0.6805 (+) 2.929 (*) N2 119 (*) 0.184 (=) 3.23 (*) 93.83 (*) 0.184 (=) 3.08 (*)
(*)-regressed from experimental data, (+)-from Sloan (1998, 2005), (=)-Barrer and Edge (1967))
Figure 2: SCH-V-L phase boundaries of the
ternary system H2O+TBAB+CO2
Our first comment concerns the difference in between experimental results even at a very similar TBAB concentration. In our work, an important task was devoted to separate a priori the data into two classes, which can be modelled separately by assuming a S38 or a S26 structure. On Figure 2, we can see from the results of Oyama et al (2008) and Lin et al (2009) that both the structure can crystallize at low liquid concentration of TBAB around the value of 4.5%mass. At a lower concentration of 3% mass, Oyama et al (2008) observed only the structure S26 (Figure 3) and at a higher concentration of 40% mass, the data from Dalmazzone and Deschamps (2009), Duc et al (2007) and Arjamdi et al (2007) indicate that the S38 structure is formed.
Figure 3: SCH-V-L phase boundaries of the
ternary system H2O+TBAB+CO2
Figure 4: SCH-V-L phase boundaries of the
ternary system H2O+TBAB+CO2
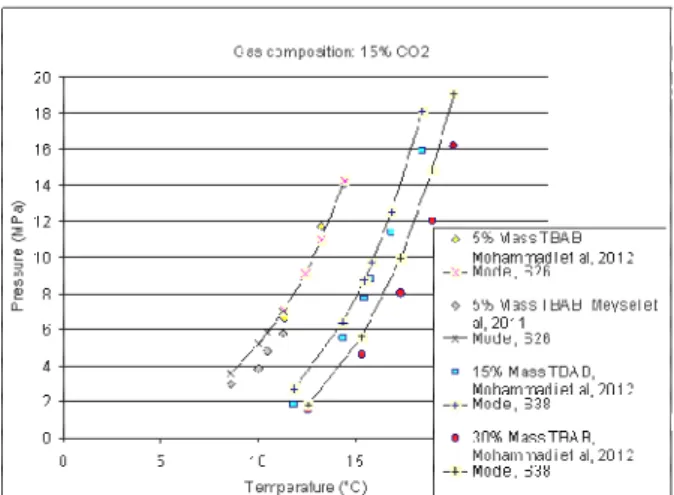
The data from Mohammadi et al (2012) and Meysel et al (2012) shows that a gas mixture at a CO2 concentration of 15% can be modeled from a structure S26 at TBAB concentration of 5%mass and a S38 structure at a higher TBAB concentration of 15% or 30% mass (Figure 5) At a higher CO2 concentration of 50% (Figure 6) we observe that both the structure can be formed at low TBAB concentration of 5% mass depending on the experiment, even in the same laboratory (Mohammadi et al, 2012). S38 can be formed at higher TBAB concentration of 15% mass and 30% mass.
The data from Meysel et al (2011) show both the structure also (Figure 7) can also be formed at higher CO2 concentration of 70% mol. At low TBAB concentration of 5%mass, S26 structure is formed, whereas S38 structure is formed at TBAB mass fraction of 0.1 and 0.2.
Figure 5: SCH-V-L phase boundaries of the
ternary system H2O+TBAB+CO2+N2
Figure 6: SCH-V-L phase boundaries of the
ternary system H2O+TBAB+CO2+ N2
Figure 7: SCH-V-L phase boundaries of the
ternary system H2O+TBAB+CO2+ N2
The tendency that is observed from the experiments is that S38 is systematically formed at high TBAB mass fraction, and S26 structure can be observe at low TBAB mass fraction, but in competition with the S38 structure.
From the complete modeling, we can add a specific comment which concerns the occupancy of cavities. In fact, from Eq. 6 , we can see that the occupancy of cavities is directly fixed from temperature. We focus here on the S38 structure, because it is the structure that is formed systematically at high TBAB concentration. From the modelling, we have extracted two correlations to help in understanding the behaviour of TBAB semi-clathrate hydrate.
The first correlation concerns the occupancy factor, at a TBAB mass fraction of 0.32, where the congruent temperature of the S38 structure is 10.38°C. We got
(
)
(
)
2 -3 -1 = -3.719 10 10.38 + 9.926 10 10.38 Bulk Bulkθ
⋅ Θ − ⋅ Θ −(9)
Where ΘBulk is the temperature [°C] of the bulk solution. We add a second correlation (for S38 structure, at a liquid TBAB mass fraction of 0.32) which gives the semi-clathrate equilibrium pressure PBulk eq, for pure CO2 gas hydrate former:
(
)
(
)
(
)
3 -3 , 2 -3 -1 P = 3.687 10 10.38 - 7.839 10 10.38 + 2.035 10 10.38 Bulk eq Bulk Bulk Bulk ⋅ Θ − ⋅ Θ − ⋅ Θ −(10)
0.01 0.1 1 0 1 2 3 4 Temperature difference (K or °C) to 10.38°C O c c u p a n c y f a c to rFigure 8: Occupancy factor of cavities as a function of the Operative temperature.
The storage capacity
n
SSTORAGE38,Max [mole CO2/m 3hyd] in the hydrate phase (Eq.3) has also been
evaluated. It is compared (Figure 9) to the maximum storage capacity of the pure hydrate (Eq.2), and of the liquid solution
2,
STORAGE CO L
n
(Eq.5).The maximum hydrate storage capacity remains higher than the liquid storage capacity in all the range of pressure. But, because the occupancy of cavities remains very low (Figure 8), the effective hydrate storage capacity remains lower than its maximum value. The Figure 9 plots the respective storage capacities as a function of pressure given by Eq.10. 0 500 1000 1500 2000 2500 3000 3500 0 1 2 3 4 5
Operative Pressure [Mpa]
S to ra g e C a p a c it y [ m o l C O 2 /m 3 ]
Liquid storage capacity Hydrate storage Capacity
Hydrate Maximum storage Capacity
Figure 9: Storage capacity. [mole CO2/m3 hyd] in the hydrate phase and liquid phase
CONCLUSIONS
The main contribution of this work has been to model the occupancy factor of the S38 structure of TBAB semi clahtrate hydrates, from Eq.6, and to propose a correlation in Eq.9. The occupancy factor is independent on the gas which is enclathrated, and it tends the zero value as the temperature tends to the congruent temperature at which the pure TBAB semi clathrate hydrate is stable, without the “help” of any gas.
A first modelling of the Langmuir constant is proposed, from the determination of a set of kihara parameters (Table 3) for carbon dioxide and nitrogen. The main difficulty has been to separate a priori the experimental results of the literature into two sets, the ones to be modelled from the structure S38, and the other ones to be modelled from the structure S26. The modelling of kihara parameters for S38 structure seems to us robust because the experimental results are numerous, and also because the S38 structure has been clearly identified in the literature, whereas the S26 structure remains unclear.
Acknowledgements :
This work has been carried out within the ANR
(French Research Agency) project CO2
SECOHYA and the FP7 European project iCAP (GA n°241393). We are grateful to Peter J. Herslund for inspiring discussions on several topics related to the thermodynamics of gas hydrates.
Arjmandi, M.; Chapoy, A.; Tohidi, B.; 2007, Equilibrium Data of Hydrogen, Methane, Nitrogen, Carbon Dioxide, and Natural Gas in Semi-Clathrate Hydrates of Tetrabutyl
Ammonium Bromide. J. Chem. Eng. Data, 52, 2153-2158
Barrer, R.M., and Edge, A.V.J., 1967. Gas Hydrates Containing Argon, Krypton and Xenon: Kinetics and Energetics of Formation and Equilibria. Proc. R. Soc. London, Ser. A., A. 300, 1-24
Darbouret, M., 2005a. Etude rhéologique d’une suspension d’hydrates en tant que fluide frigoporteur diphasique Résultats
expérimentaux et modélisation. Ph.D., Ecole Nationale Supérieure des Mines de Saint-Etienne, France.
Davidson, D. W. In Water. A Comprehensive Treatise; Franks, F., Ed.; Plenum Press: New York, NY, 1973.
Deschamps and Dalmazzone , 2009, Dissociation enthalpies and phase equilibrium for TBAB semi-clathrates of N2, CO2, N2+CO2 and
CH4+CO2, , Therm Anal Calorim, Vol. 98,
pages 113-118
Duc N.G., Chauvy F., Herri J.-M.. CO2 Capture by Hydrate crystallization - A potential Solution for Gas emission of Steelmaking Industry. Energy Conversion and Management 2007; 48, 1313–1322.
Dyadin, Yu.A. , Udachin, K.A., 1984, Clathrate formation in water-peralkylonium systems, Journal of Inclusion Phenomena 2, 61-72. Gaponenko, L. A.; Solodovnikov, S. F.; Dyadin,
Y. A.; Aladko, L. S.; Polyanskaya, T. M., Crystallographic study of
tetra-n-butylammonium bromide polyhydrates. Zh.
Strukt. Khim. 1984, 25, 175177.
Herri, J.-M. , Bouchemoua, A., Kwaterski , M., Fezoua, A., Ouabbas, Y., Cameirao, A., 2011, Gas Hydrate Equilibria from CO2-N2 and CO2-CH4 gas mixtures, – Experimental studies and Thermodynamic Modelling, Fluid Phase Equilibria (301) 171-190
Kwaterski, M., Herri, J.M., 2011, Thermodynamic modelling of semi-clathrate hydrates of gas and quaternary ammonium salts, Proceedings of the 7th International Conference on Gas Hydrates (ICGH 2011), Edinburgh, Scotland, United Kingdom, July 17-21, 2011.
Kwaterski, M., Herri, J.M., 2014, Modelling of Gas Clathrate Hydrate Equilibria using the Electrolyte Non-Random Two-Liquid (eNRTL) Model, Fluid Phase Equlibria, accepted
Lin. W., Delahaye. A., Fournaison. L., 2008. Phase equilibrium and dissociation enthalpy for semi-clathrate hydrate of CO2 + TBAB. Fluid Phase Equilibria. 264. 1-2. 220-227.
Lipkowski J., Komorov V.Y., Rodionova T.V., Dyadin Y.A., Aladko. L.S.. The Structure of Tetrabutylammonium Bromide Hydrate. Journal of Supramolecular Chemistry 2002; 2: 435-439.
McKoy, V., Sinagoglu, O. J.; Theory of
dissociation pressures of some gas hydrates. J Chem. Phys 38 (1963) 2946
Meysel, P., Oellrich, L., Bishnoi, R., Clarke, M.A., 2011, Experimental investigation of incipient equilibrium conditions for the formation of semi-clathrate hydrates from quaternary mixtures of (CO2 + N2 + TBAB + H2O), J. Chem. Thermodynamics 43, 1475–1479 Mohammadi, A.H., Eslamimanesh, A., Belandria,
V., Richon, D., Naidoo, P., Ramjugernath, D., 2012, Phase equilibrium measurements for semi-clathrate hydrates of the (CO2 + N2 + tetra-n-butylammonium bromide) aqueous solution system, J. Chem. Thermodynamics 46, pp. 57–61
Oyama, H., Shimada, W., Ebinuma, T., Kamata, Y., 2005. Phase diagram, latent heat, and specific heat of TBAB semiclathrate hydrate crystals. Fluid phase Equilib. (234) 131-135. Oyama, H., Ebinuma, T., Nagao, J.; Narita, H.;
2008, Phase Behavior Of TBAB Semiclathrate Hydrate Crystal under several Vapor
Components. Proceedings of the 6th International Conference on Gas Hydrates (ICGH 2008), Vancouver, British Columbia, CANADA, July 6-10, 2008.
Paricaud, P. 2011, Modeling the Dissociation
Conditions of Salt Hydrates and Gas
Semiclathrate Hydrates: Application to Lithium Bromide, Hydrogen Iodide, and Tetra-n-butylammonium Bromide + Carbon Dioxide Systems, J. Phys. Chem. B 2011, 115, 288–299 Parrish, W. R.; Prausnitz, J. M.; Dissociation
pressure of gas hydrates formed by gas mixtures. Ind. Eng. Chem. Process Des. Develop.; 11 (1972) 26-35
Rodionova,T. V.; Komarov, V. Y.; Villevald, G. V.; Karpova, T. D.; Kuratieva, N. V.; Manakov, A. Y., Calorimetric and Structural Studies of Tetrabutylammonium Bromide Ionic Clathrate Hydrates. J. Phys. Chem. B, 2013, 117, 10677–10685
Sato, K., Tokutomi, H., Ohmura, R., 2013, Phase Equilibrium of Ionic Semiclathrate Hydrates formed with Tetrabutylammonium Bromide
and Tetrabutylammonium Chloride”, Fluid Phase Equilibria 337, 115-118.
Shimada, W.; Ebinuma, T.; Oyama, H.; Kamata, S.; Narita, H.; 2005a, Free-growth forms and growth kinetics of tetra-n-butyl ammonium bromide semi-clathrate hydrate crystals. J. Cryst. Growth 274, 246-250
Shimada. W.. Shiro. M.. Kondo. H.. Takeya. S.. Oyama. H.. Ebinuma.. Narita. H.. 2005b. Tetra-n-butylammonium bromide-water (1/38). acta Cryst.. C61. o65-o66
Soave, G., Equilibrium constants from a modified Redlich-Kwong equation of state; Chem. Eng. Sci., 27 (1972) 1197-1203
van der Waals, J. H.; Platteeuw, J. C., Clathrate solutions”; Adv. Chem. Phys. 2 (1959) 1-57.


![Figure 9: Storage capacity. [mole CO 2 /m 3 hyd] in the hydrate phase and liquid phase](https://thumb-eu.123doks.com/thumbv2/123doknet/11641554.307238/7.892.89.436.543.932/figure-storage-capacity-mole-hydrate-phase-liquid-phase.webp)
