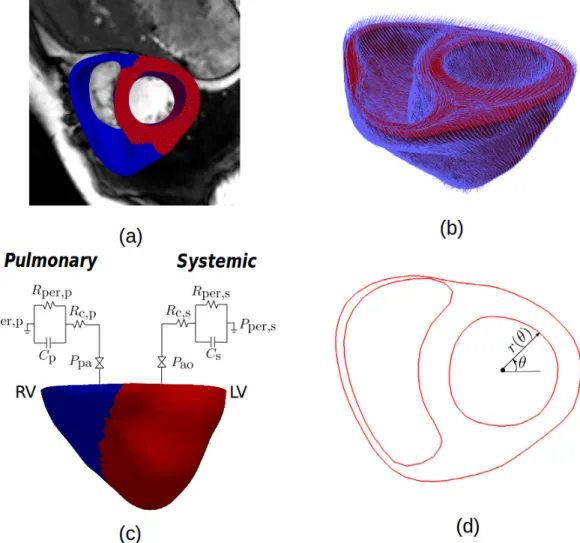
Patient-Specific Computational Analysis of Ventricular Mechanics in Pulmonary Arterial Hypertension
Texte intégral
Figure


Documents relatifs
Partition of unity methods (PUM) such as XFEM lend themselves naturally to per- forming ambient space finite element simulations where the domain’s boundary is defined independently
The theoretical sensitivity of the Rayleigh velocity dispersion to properties of the WC- Co coating was studied. 4, dispersion curves have been calculated for different
The established dependence allows the determination of the freezing point of the soil from the values of moisture content and from the qualitative composition of the water soluble
We propose a process algebra variant to define protocols and reason about privacy properties, as well as a mapping procedure from protocols to architectures that are defined in
The goal of the Nedut'en Talking Dictionary Project was to develop a series of computer aided language learning (CALL) programs to supplement the Carrier language instruction program
The volume is, however, un- even in several respects: lucid- ity, sustaining of interest, gram- Mar, and occasionally speIling (e.g. skepticism and scepteeism are
Later studies revealed that this locus was different from the nonhypersensitive adult plant leaf rust resistance gene Lr46 which is located on 1BL Table 3 Detected quantitative
[r]
