Characterising User Interactivity for Sports
Video-on-Demand
Andrew Brampton
†Andrew MacQuire
†Idris A. Rai
†Nicholas J.P. Race
†Laurent Mathy
†Michael Fry
‡†Lancaster University ‡University of Sydney
{brampton,macquire,rai,race,laurent}@comp.lancs.ac.uk [email protected]
ABSTRACT
This paper presents a detailed characterisation of user be-haviour for a series of interactive sport videos from the 2006 FIFA World Cup. In addition to generic VCR-like features, our custom-built Video-on-Demand architecture enabled us to provide advanced interactivity features such as book-marking. We illustrate how such functionality may have a dramatic impact on how users consume content. A detailed discussion is also provided on how content distributors may turn this knowledge to their advantage, and thus increase the efficiency of their delivery networks.
1.
INTRODUCTION
In recent years the Internet has increasingly been used to distribute bandwidth-intensive, low-latency streaming me-dia. Due to the resources required to deliver such content, dedicated Content Distribution Networks (CDNs) are often used to improve the end-user’s experience. As such sys-tems evolve, users expect correspondingly improved interac-tive functionality; something which is increasingly difficult to achieve with diverse content types exhibiting varied ac-cess patterns. In order to provide a high quality of service, modern CDNs must therefore have an in-depth understand-ing of user behaviour regardunderstand-ing different content types.
A number of previous papers have already studied the characterisation of user behaviour for Video-on-Demand (VoD) content. Some have studied single genres such as educational videos [3, 6, 1], whereas others have examined a range of video types [7, 10, 5, 13]. This paper is closely related to previous work that examined user characterisa-tion for interactive video. Similar studies exist where logs were analysed from VoD systems that support VCR inter-activity, i.e. the ability to pause, resume and skip back and forth within a given video stream [7, 11, 12]. The typical approach in these studies has been to analyse either pub-licly available traces of static content (such as those at the Internet Traffic Archive [8]), or privately obtained logs of more dynamic streaming content from larger networks such
Permission to make digital or hard copies of all or part of this work for personal or classroom use is granted without fee provided that copies are not made or distributed for profit or commercial advantage and that copies bear this notice and the full citation on the first page. To copy otherwise, to republish, to post on servers or to redistribute to lists, requires prior specific permission and/or a fee.
NOSSDAV’07 Urbana, Illinois USA
Copyright 2007 ACM 978-1-59593-746-9/06/2007 ...$5.00.
as Akamai’s [2].
In this paper, we study user behaviour for an interactive VoD system that serves users specifically with video from the 2006 FIFA World Cup. A key distinguishing element of our work is the fact that we implemented our own VoD system, designed to offer novel interactive functionality be-yond typical VCR-like features. The prime example of this is bookmarking : direct links to points of interest within the video. Our system also allowed users to contribute their own bookmarks at any time, distinct from those added during the publishing process. An example of a bookmark within our content could be a common event such as the match kick-off, or a potentially more popular event, such as a goal.
Previous studies making use of entertainment content may have witnessed the classic start-to-finish playback model in their access patterns, with occasional user VCR interac-tivity. In our experiment, however, sports content proved highly dynamic. Users often chose to watch (and re-watch) small segments of the full video, in a complete departure from the start-to-finish model. The behaviour observed may also be present in other sports, and different content gen-res (e.g. educational, entertainment, news, etc.), as these genres often have a few popular highlights.
We found that the bookmark functionality in our system had a significant impact on user behaviour, leading to ac-cess patterns quite dissimilar from previous related work. We identified distributions, namely log-normal, Weibull and normal, to best model various metrics and workload prop-erties. These models can be used to drive simulations of the type of interactivity behaviour studied in this paper. We also discuss how delivery networks can exploit the observed behaviour to improve user-perceived performance. For in-stance, we show that the order in which users view book-marks can be predicted based on previous activity, enabling CDNs to leverage this data for performance gains.
The remainder of this paper is structured as follows: Sec-tion 2 describes our experimental setup, while SecSec-tion 3 analyses the results. Section 4 concludes the paper with a discussion of the impact of our results on existing Content Distribution Networks.
2.
EXPERIMENTAL SETUP
We set up a simple, interactive video-on-demand system. The system was divided into three main components: the capture server, the Video-on-Demand server, and a web in-terface1.
1More information about the system and its source code is
Figure 1: Video-On-Demand Interface
Our capture server recorded public broadcasts of raw MPEG-2 streams from the beginning of the pre-match com-mentary through to the end of coverage. Once a full match was captured, the system transcoded the stream to high and low bitrate Macromedia Flash 7 FLV streams (1 Mbps and 300 Kbps respectively). Administrators would then manu-ally add metadata to the system describing the location of key events within the match. These locations are referred to as bookmarks, and typically included events such as the beginning and end of the match, any goals, and other im-portant events such as red cards. The final FLV streams were then transferred to the VoD server. This full process typically took 6 hours and thus the matches were available shortly after being played.
The VoD system was an Apache webserver, which served the Flash based user interface over HTTP. This server was only accessible to staff and students within Lancaster Uni-versity’s campus, and those connecting remotely via VPN. To aid in logging, the user interface would make its HTTP requests as verbose as possible, allowing us to later track users through multiple sessions and determine exactly which controls were pressed and when. Additionally, each playback window would maintain a periodic HTTP-request heartbeat with the server, which was used to determine when connec-tivity was unexpectedly lost.
The web interface consisted of two main sections; firstly a index page allowing the user to select any available match from the World Cup, and secondly the player interface that displayed the video of the matches, as shown in Fig. 1. The player interface offered some simple controls to seek around the match. We were aware that the user interface would con-strain the user’s actions, and it was therefore designed to be as simple and generic as possible. Forward and backward buttons were provided that allowed seeking 10, 30 and 60 seconds in either direction. These only accounted for rather small jumps, and so we also provided a seek bar which en-abled users to make potentially large jumps to any arbitrar-ily chosen time. Finally, users had the list of administrator-added bookmarks which enabled them to seek directly to key events. This interface was also extended to allow users to submit their own bookmarks (via the tag button), which other users could see and select. These user bookmarks cov-ered events that were not typically bookmarked, but were of particular interest (such as events that came under later scrutiny).
Action Occurrences Percentage(%) per Session
Back 10s 1353 5.98 0.58 Back 30s 556 2.46 0.24 Back 60s 775 3.43 0.33 Forward 10s 3319 14.67 1.42 Forward 30s 1664 7.36 0.71 Forward 60s 3488 15.42 1.49 Seek-bar 2101 9.29 0.90 Bookmarks 5203 23.00 2.22 User bookmarks 585 2.59 0.25 Add bookmark 43 0.19 0.02 Pause 1847 8.16 0.79 Resume 1690 7.47 0.72
Table 1: Number of occurrences of interactive actions
3.
ANALYSIS
The 2006 FIFA World Cup ran from the 9thof June until the 9th of July, whereas the results analysed in this paper were recorded from the 13th of June until the 16thof July.
The data for the first 4 days was discarded due to alterations made to the logging system and user interface in that period. Also, the 7 extra days considered after the end of the World Cup were added due to continued use of the site. A total of 66 matches were logged (64 from the event, and 2 pre-competition friendlies), with 405 unique users over the one month period. On average 30.7 unique users viewed each match.
In this section, we use the logs from our experiment to characterise user properties for our system. R-Square fit-ting is used to determine models for the various features analysed, such as popularity, session length, inter-seek times, and bookmark requests.
3.1
Interactions
Recall that our system allowed various interactive opera-tions, namely pausing, resuming, seeking forwards & back-wards, and jumping to bookmarks. This range of operations, combined with the nature of the content, highly influenced user behaviour. For most users, there was a complete de-parture from the typical start-to-finish playback model that has often been observed in previous work [7].
Table 1 shows the number of times each action was taken and its corresponding percentage against all other opera-tions. Forward seeking was used a combined 37.44% of the time, whereas backward seeking was only used 11.86%. These actions only accounted for the relatively small jumps (10, 30, and 60 seconds), whereas potentially large jumps (seek-bar and following bookmarks) made up 34.87% of all operations. The table also shows that, on each session (view-ing of a s(view-ingle video), a user on average used backward ac-tions 1.15 times, bookmarks and seek bar acac-tions 3.37 times, and 3.62 times for forward actions.
Previous studies have shown that the most common ac-tion is pause/resume [7], however we see that for our traces, forward operations are by far the most common, closely fol-lowed by seeking to bookmarks. The table also shows that the number of pause operations account for 8.16% of all ac-tions. Our reduced number of pauses can be explained by the short session durations observed. This is in accordance with previous work which found a positive correlation be-tween session time and the number of pause operations [12]. To get a detailed picture of how users navigate through a bookmarked video, we analyse the behaviour of users within a single match (Argentina vs. Serbia and Montenegro). This match had 10 bookmarks, 3 user defined bookmarks, and was the most popular match of our experiment in terms of the number of viewers, although the user behaviour
0 1000 2000 3000 4000 5000 6000 7000 8000 0 1000 2000 3000 4000 5000 6000 7000 8000 To time (seconds)
From time (seconds) Jump forward
Jump back
Figure 2: Jumps made by users within the Argentina vs. Serbia and Montenegro match
nessed is typical of all games.
Vertical and horizontal lines in Fig. 2 represent the 10 bookmarks of the match. Every point is a jump that is identified by corresponding times on both axes. The diago-nal line is a present-time marker such that the forward jumps are points which lie above it, while backward jumps appear below it. Thus, no point falls precisely on the diagonal, yet can be close to it. We can immediately observe from the fig-ure that many points fall on horizontal lines, implying that most jumps involved seeking to bookmarks.
The forward jump buttons appear to have been mostly used for browsing, as can be seen between 0 and 1000 sec-onds. This could be due to user unfamiliarity with the inter-face, or possibly users first checking for anything interesting at the start of the video before moving to a bookmark. The rewind action is used mostly around events, for example in the case where users wish to re-watch the event, or when the bookmark insufficiently marked the beginning of the event. A good example of this was before the bookmark at time 2815, where users rewound up to 75 seconds to see more of the build up to the goal. Clusters of points can also be seen on horizontal lines shortly after a vertical line, indicating that users jumped from one bookmark to another. We can also observe large clusters for each vertical line around only one horizontal line, such as from the bookmark at 1300 sec-onds going to the bookmark at 2815 secsec-onds. This shows that a majority of users visited consecutive bookmarks. In this case users went from the first goal (at time 1300) to the second goal (at time 2815). The results on this single match demonstrates that when presented with bookmarks in sports video, users are highly influenced by them.
3.2
Popularity
We study popularity in terms of the number of viewers who watched an object or a segment. An object in our sys-tem is a single football match whereas a segment is a section of video one second in length.
The ranking for both object and segment popularity is shown in Fig. 3. Recall that there were only 66 matches recorded, which is why the object rank ends much earlier than for segments. Our analysis reveals that object pop-ularity does not follow the typical power-law distribution observed within CDNs [6, 3, 13] but instead is a normal distribution with parameters µ = 33.2 and σ = 17.1. This can be attributed to the nature of the World Cup and the
1 10 100 1 10 100 1000 10000 100000 Number of views Rank Segment Popularity Object Popularity
Figure 3: Object and segment popularity
0 0.2 0.4 0.6 0.8 1 0 1000 2000 3000 4000 5000 6000 7000 8000 Viewers Time (seconds) Kick Off Goal Goal Goal Half-time 2nd half Goal Goal Goal Time
Figure 4: Viewers of the Argentina vs. Serbia and Montenegro match
relatively few new objects each day.
We found that the popularity of one-second segments in videos exhibit a log-normal distribution with parameters µ = 0.0159 and σ = 1.35. Note that log-normal distributions closely relate to power-law or heavy-tailed distributions [9]. They are skewed distributions where a small percentage of samples contributes to a sizeable weight of their distribu-tion. We observed that a small percentage, (the 10% most popular segments), accounted for about 44% of all requests. Previously, Costa et al. [7] found that for educational and entertainment content, the popularity of segments is roughly uniformly distributed with a slight skew towards the begin-ning for entertainment content. Our result, however, implies that there are segments with orders of magnitude more view-ers than othview-ers. To illustrate this fact, we present Fig. 4, which shows the popularity of each second of video for the Argentina vs. Serbia and Montenegro match. It is very clear from the figure that the bookmarks influence the popularity of segments. We also observe that most of the bookmarks that users found interesting are equally popular, receiving requests from around 60% of all viewers of the match.
Popularity metrics are important to CDNs as they help to decide what resources to allocate to each object. We have seen that bookmarked sports videos provide a content for-mat with specific segments of interest (goals, for example). This result emphasises the use of partial caching techniques to cache only popular segments of objects, as has been pre-viously proposed [4].
0 50 100 150 200 250 300 350 0 2 4 6 8 10 12 14
Requests per hour
Time online (days)
Figure 5: Bookmark utilisation over time, following initial usage 0 0.2 0.4 0.6 0.8 1 1 10 100 1000 10000 CDF Time (seconds) Inter-seek times Session times
Figure 6: The CDF of session lengths and inter-seek times
3.3
Longevity
The popularity of both videos and bookmarks in our sys-tem faded over time. We call the duration at which any such item remains utilised its longevity. The study of a video or bookmark’s longevity can be used to compute correspond-ing distributions, aidcorrespond-ing in content management decisions for similar items in the future.
Fig. 5 shows the popularity of bookmarks versus the time they were first utilised. The figure suggests that following an initial peak and a slight resurgence, there was a rapid decrease in interest after just a short period.
R-Square fitting reveals that the bookmark longevity can be suitably estimated using a Weibull distribution with λ = 1.814 and k = 0.6383. This suggests that the pop-ularity exhibits heavy-tailed properties. We also observed that half the bookmark usage occurs within 24 hours, with the remainder slowly occurring over the following 2 weeks.
3.4
Session lengths
Session length is the total time a user spent on a video. A session may consist, for example, of a user watching part of a video, pausing for a while, then continuing to watch the video. Therefore, it is possible that a session is longer than the actual length of a video.
Fig. 6 shows the CDF of both session and inter-seek times (discussion on inter-seek times follows in the next section). It can be observed from the session times that most users access a video for a very short time relative to the length of
0 0.2 0.4 0.6 0.8 1 0 0.2 0.4 0.6 0.8 1 1.2 CDF
Ratio of Sequence Pair Occurences to Users Sequence (bookmarks and VCR)
Sequence (bookmarks)
Figure 7: The ratio of sequence pairs to the number of users that watched them
the overall content (i.e. possibly just watching interesting events from the match). In particular, note that around 80% of sessions lasted less than 500 seconds. Given that a length of a typical video was 2.5 hours long, 500 seconds is only 5.5% of the video. The average session duration is found to be only 10.2 minutes.
Fig. 6 also shows that only a small minority of users (roughly 3%) could have possibly watched the entire match. We found that a small number of users (1.17%) accessed the video for between 3 to 8 hours. Our logs show that these users paused a video for a long time before they de-cided to resume playback. These outliers are possibly why we observe that session sizes are best fitted by a log-normal distribution with parameters µ = 4.835 and σ = 1.704.
3.5
Inter-seek times
Inter-seek time is described as the time a user spent ac-tually watching a section of a video before seeking to a new location (disregarding any paused periods within the ses-sion).
From our logs, we found that on average a user performed 9.3 seek operations around a video resulting to a mean inter-seek time of 66 seconds. Fig. 6 shows the CDF for inter-inter-seek times as well as session length. It can be seen that the majority of users viewed the content as a series of excerpts, usually under a minute in length.
We found that inter-seek times can be estimated by a log-normal distribution with parameters µ = 1.4796 and σ = 2.2893. Previous studies have also found that the ma-jority of inter-seek times are very short [12]. They have also been shown to be approximately Poisson or Pareto for ed-ucational content in different servers [3]. A distribution of inter-seek times can be used by a delivery system to deter-mine the size of video replicas and the time that it should react before a user seeks elsewhere on the video.
3.6
Sequence
In this section, we analyse the data we collected from our experiment to study the extent to which user actions on a video can be predicted. We call the order that events in a single match are viewed a sequence of events. A typical sequence can include any combination of user actions on a video such as starting the video, VCR actions, seeking to a bookmark, etc. Additionally, we separately consider se-quences that consist of jumping between bookmarks. If a
Metric Distribution R-square Object Popularity Normal, µ = 33.20 , σ = 17.10 0.0260 Segment Popularity Log-normal, µ = 0.016 , σ = 1.35 0.0941 Session size Log-normal, µ = 4.835, σ = 1.704 0.127 Inter-seek times Log-normal, µ = 1.4796, σ = 2.2893 0.0358 Bookmark Longevity Weibull, λ = 1.814 , k = 0.6383 0.0372
Table 2: A summary of metrics with their
corre-sponding distributions
system could detect or predict patterns within a sequence, then it could pro-actively respond to them in order to op-timise content delivery. For example, a server could use spare bandwidth to push out the appropriate content to a user before being requested, or a client could be allowed to pre-cache content based on popularity of a pattern in a sequence.
We first identified sequences of actions from our traces. We then broke the sequences into pairs of events that were accessed consecutively. For example, a sequence made up of starting the video, jumping from bookmark A to bookmark B, forwarding 30 seconds (F30), and finally ending a session was broken into 4 pairs, namely, Start → A, A → B, B → F 30, F 30 → End. Note that the event End means the end of a session and not necessarily the end of a video. The number of occurrences of each pair was totalled for each match and normalised by the number of users who watched that match. The ratio of users to each sequence pair is shown as a CDF (for both bookmarks alone and inclusive of VCR actions) in Fig. 7. Note that the x-axis of the figure goes above 1, which shows that some sequence pairs have been followed more than once by some users. Intuitively, the more the sequence pair is followed, the more predictable it is, and thus larger values on the x-axis represent better predictability for a given sequence.
Fig. 7 shows that around the top 20% of bookmark se-quence pairs were followed by more than 50% of users. This means that there is a high chance of predicting these book-mark sequences. Note that these bookbook-marks also consist of the 20% most popular bookmarks. However, the figure also shows that it is generally difficult to predict the actions of a user if all actions are considered. This is because of the wider range of interactivity options a user has when VCR functionality is also considered.
We now summarise the analytical models in Table 2. We found that user metrics could be estimated by more than one distribution, however the table shows only the best fit for each. The table also shows corresponding R-square values that illustrate the suitability of the models. Of particular importance is the type of distribution which can have a sig-nificant impact on the system. For example, the Weibull and log-normal distributions are both heavy-tailed, for which systems may have to anticipate the uneven distribution to cope effectively.
4.
CONCLUSIONS AND FUTURE WORK
We have presented a study and characterisation of user behaviour for interactive sports video-on-demand (VoD) sys-tems. Using our custom-built VoD system, we captured FIFA 2006 World Cup matches and made them locally avail-able through a highly interactive user interface.
Our results show that the interactivity options available to users highly influence their behaviour. In particular, we found that the novel interactive feature called bookmarking, played a pivotal role, leading to access patterns quite
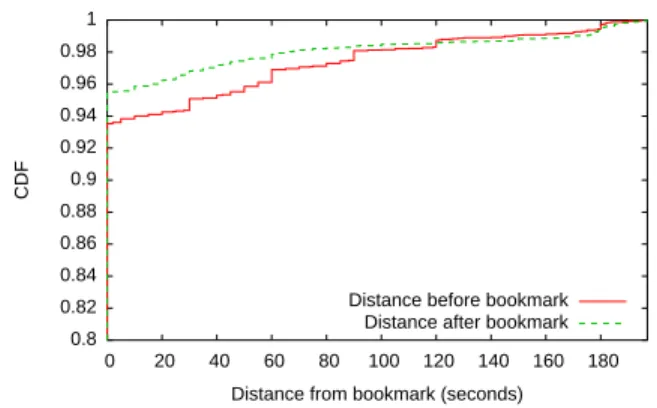
0.8 0.82 0.84 0.86 0.88 0.9 0.92 0.94 0.96 0.98 1 0 20 40 60 80 100 120 140 160 180 CDF
Distance from bookmark (seconds) Distance before bookmark
Distance after bookmark
Figure 8: Difference between bookmark start and
maximum sought distance
ilar from previous related studies that looked at VCR-like interactivity alone. The combination of our content type and the addition of bookmarks led to users accessing con-tent in relatively small segments that were both highly pop-ular and sparsely distributed throughout the length of the videos. These popular segments, more commonly named hotspots, were clearly skewed around bookmarks. From both a user and a CDN’s perspective, this can be viewed as advantageous; users can reach interesting content more quickly through the bookmarks, and the increased locality of interest means the CDN can respond more effectively.
Interest in a given event is subjective, however, and an administrator or individual user’s opinion inevitably plays a major part in the optimality of manually placed bookmarks in terms of their locations and validity. For delivery net-works to benefit from the user characterisation observed in this paper, it is clear that they must be optimised to al-low for autonomic repositioning of incorrectly placed book-marks, detection of hotspots, and caching/replication, all based on predicted or past recorded user behaviour.
A particular section of a piece of content may prove to be far more popular than the remainder, thus making it suitable for special treatment. Service providers can either rely on their users or administrators to add appropriate metadata describing potential hotspots on the video. However, nei-ther would necessarily know how demand for their content would change over time. As such, reactive and adaptive ap-proaches may prove most suitable for the general case, where the evolution of hotspots and the validity of bookmarks are autonomically detected based on observed patterns.
A simple way of achieving this would be to select a thresh-old (e.g. a percentage of users) and classify any section of video which exceeds it as a hotspot. This method may take time to identify the correct hotspots since requests must first be recorded across the length of a video. The system could then mark an identified hotspot with a bookmark for easy access to future users. Additionally, longevity informa-tion can be used in conjuncinforma-tion with detecinforma-tion algorithms to decide upon the validity of existing bookmarks.
Upon examination of our logs, we found that some of the bookmarks were incorrectly placed. Users who discovered that the bookmark started sooner or later than they ex-pected are likely to make a corresponding jump shortly af-ter requesting a bookmark (as observed in Fig. 2). We ob-served that 40% of the bookmarks had at least one user who
jumped to a position before the bookmark itself. Upon in-spection of the video content, however, we discovered that when users consistently made an additional seek, it was typ-ically because bookmarks were placed during the run-up to a penalty kick, omitting the cause of it. Users wanting to see the relevant incident would therefore have to seek back-wards, as the bookmarks were incorrectly placed beyond the beginning of the actual hotspot.
We also analysed the distance from a bookmark that users jumped shortly after requesting it (within a range of 200 sec-onds either side, as to ensure relevancy to the bookmark). An examination of the traces revealed that approximately 84% of the seeks considered were carried out within 20 sec-onds of moving to the bookmarks, perhaps representing the users who were almost immediately dissatisfied with the bookmark location. Fig 8 shows the varying distances from the bookmark that users moved to, all within 20 seconds of reaching the bookmark’s location. We observe from the fig-ure that around 6% of bookmark requests have seeks shortly afterwards, possibly due to suboptimal bookmark position-ing. It was noted that 5.7% of all bookmark requests were for penalties, adding support to this theory.
Placing bookmarks optimally has the advantage of im-proving user experienced performance and reducing load on servers, whereas incorrectly positioning bookmarks leads to an increase in the number of seeking requests. It is therefore desirable for a delivery system to be capable of reposition-ing relevant bookmarks accordreposition-ingly to enable faster access of relevant content, and the resultant reduction in seek op-erations would reduce network load.
We experimented with a repositioning mechanism based on a exponentially-weighted moving average algorithm, us-ing our logs as input. We observed that the algorithm successfully identified the correct positions for poorly po-sitioned bookmarks and left the positions of well popo-sitioned bookmarks unchanged (results are omitted due to lack of space). In our future work, we will check to see if such an algorithm can perform similarly in delivery networks and we will devise new algorithms if necessary.
Beyond issues related to their placement, the resultant ef-fect of bookmarking was that several sections of each video were far more popular than others. In a CDN context, this reaffirms the idea that content should not be treated as im-mutable objects, and instead it should be divided into small segments. A network can then rank the segments in terms of their popularity and apply caching or replication strategies accordingly.
Naturally, the size of the segments in question is an impor-tant concern. In this paper we have examined the content on a second-by-second basis; while this may seem a small value given that all our videos were several hours long, Fig. 6 in-dicates that 60% of all sustained playback operations were actually 10 seconds or less, and thus small segment sizes would potentially be required.
Developing algorithms to predict the actions of newly ar-riving users based on the experience of past users may also prove useful. For example a CDN could infer the order of segments users typically viewed, or the probability of view-ing any given segment after another. This could form a probability matrix with each destination weighted by the percentage of previous users who chose that destination; knowledge which may then be useful to both the server and the client. On the server side, the server would be aware
of which content to pre-fetch from the original source or pre-push to other servers or clients in advance. This could also influence caching eviction decisions whereby objects are evicted based on their usage as well as the popularity of ob-jects likely to be requested with them.
Future work may involve expansion upon all of these con-cepts, along with further characterisation of differing content types.
5.
REFERENCES
[1] S. Acharya, B. Smith, and P. Parnes. Characterizing user access to videos on the world wide web. In Proceedings of Multimedia Computing and Networking (MMCN), San Jose, California, USA, January 2000. [2] Akamai. Content distribution network.
http://www.akamai.com.
[3] J. Almeida, J. Krueger, D. Eager, and M. Vernon. Analysis of educational media server workloads. In NOSSDAV’01, Port Jefferson, New York, USA, June 2001.
[4] S. Chen, B. Shen, S. Wee, and X. Zhang. Adaptive and lazy segmentation based proxy caching for streaming media delivery. In NOSSDAV ’03, pages 22–31, 2003. [5] L. Cherkasova and M. Gupta. Characterizing locality,
evolution, and life span of accesses in enterprise media server workloads. In NOSSDAV’02, Miami Beach, Florida, USA, May 2002.
[6] M. Chesire, A. Wolman, G. M. Voelker, and H. M. Levy. Measurement and analysis of a streaming media workload. In Proceedings of the 3rd USENIX
Symposium on Internet Technologies and Systems, San Francisco, California, USA, March 2001.
[7] C. Costa, I. Cunha, A. Borges, C. Ramos, M. Rocha, J. Almeida, and B. Ribeiro-Neto. Analyzing client interactivity in streaming media. In Proceedings of the 13th International World Wide Web Conference (WWW), New York, New York, USA, May 2004. [8] P. Danzig, J. Mogul, V. Paxson, and M. Schwartz.
Internet Traffic Archive. http://ita.ee.lbl.gov.
[9] G. S. Fishman and I. J. B. F. Adan. How heavy-tailed distributions affect simulation-generated time
averages. ACM Trans. Model. Comput. Simul., 16(2), 2006.
[10] K. Sripanidkulchai, B. Maggs, and H. Zhang. An analysis of live streaming workloads on the Internet. In Proceedings of the ACM SIGCOMM Internet Measurement Conference (ICM), Sicily, Italy, October 2004.
[11] W. Tang, Y. Fu, L. Cherkasova, and A. Vahdat. MediSyn: A synthetic streaming media service workload generator. In NOSSDAV’03, Monterey, California, USA, June 2003.
[12] M. Vilas, X. Paneda, R. Garcia, D. Melendi, and V. Garcia. User Behaviour Analysis of a
Video-On-Demand Service with a Wide Variety of Subjects and Lengths. In Proceedings of the 31st EUROMICRO Conference on Software Engineering and Advanced Applications, pages 330–337, 2005. [13] H. Yu, D. Zheng, B. Zhao, and W. Zheng.
Understanding user behavior in large scale video-on-demand systems. Proc. of EuroSys, Apr, 2006.