HAL Id: hal-02384084
https://hal.archives-ouvertes.fr/hal-02384084
Submitted on 4 Jan 2021HAL is a multi-disciplinary open access archive for the deposit and dissemination of sci-entific research documents, whether they are pub-lished or not. The documents may come from teaching and research institutions in France or abroad, or from public or private research centers.
L’archive ouverte pluridisciplinaire HAL, est destinée au dépôt et à la diffusion de documents scientifiques de niveau recherche, publiés ou non, émanant des établissements d’enseignement et de recherche français ou étrangers, des laboratoires publics ou privés.
Structural Characterization
Thomas Cottineau, Mireille Richard-Plouet, Annabelle Rouet, Eric Puzenat,
Hari Sutrisno, Yves Piffard, Pierre-Emmanuel Petit, Luc Brohan
To cite this version:
Thomas Cottineau, Mireille Richard-Plouet, Annabelle Rouet, Eric Puzenat, Hari Sutrisno, et al.. Photosensitive Titanium Oxo-polymers: Synthesis and Structural Characterization. Chemistry of Ma-terials, American Chemical Society, 2008, 20 (4), pp.1421-1430. �10.1021/cm702531q�. �hal-02384084�
Photosensitive Titanium Oxo-polymers: Synthesis and Structural
Characterization
Thomas Cottineau,† Mireille Richard-Plouet,† Annabelle Rouet,† Eric Puzenat,†,‡ Hari Sutrisno,†,§ Yves Piffard,† Pierre-Emmanuel Petit,† and Luc Brohan*,†
Institut des Matériaux Jean Rouxel, UMR 6502 CNRS-UniVersité de Nantes, 2 rue de la Houssinière, BP 32229, 44322 Nantes Cedex 03, France, IRCELYON Institut de recherches sur la catalyse et l’enVironnement de Lyon, UMR 5256 CNRS-UniVersité Lyon 1, 2 AVenue Albert Einstein 69629 Villeurbanne Cedex, France, and Faculty of Mathematic and Natural Sciences, Department of Chemistry,
UniVersity of Yogyakarta, Karangmalang, 55281 Yogyakarta, Indonesia ReceiVed September 5, 2007. ReVised Manuscript ReceiVed NoVember 5, 2007
TiOCl2acid solution hydrolyzes N,N-dimethylformamide (DMF) at room temperature, leading to the formation of dimethylammonium chloride (DMACl) and methanoic acid. During hydrolysis, a slow consumption of hydrochloric acid enables a gentle control over the inorganic polymerization. This one-pot process allows the preparation of novel hybrid organic–inorganic sols and gels based on titanium oxide. The hydrolytic inorganic polymer was structurally characterized by XAS, X-ray diffraction, and TEM measurements, and a chemical composition was proposed for sol and gel, based on FT-IR, Raman spectroscopies, and1H and13C NMR experiments for the organic part. Results on the kinetics and growth mechanisms for nanostructured sols and gels based on titanium oxide are presented to explain the respective roles of TiOCl2and DMF in this double hydrolysis reaction.
Introduction
Over the past decade, because of the potential applications in the field of environmental protection, the photochemistry of TiO2has been a fast growing area both in terms of research and commercial activity.1This level of research activity can be appreciated through the exponential increase in relevant research literature produced.2–4 In addition to the white pigment properties of rutile and anatase (e.g., paints and cosmetic products), titanium dioxide is used in heterogeneous catalysis and photocatalysis (water purification, air cleaning), in photoelectrochemical solar cells, for the production of hydrogen5and electricity,6as an active layer in the design of electrochromic devices,7as a gas sensor, as a corrosion-protective coating, in ceramics, and in electric devices such as varistors, to name a few. But in such applications, the performance of titanium oxide could be optimized with specific nanostructural control over the morphology of the material. Under UV irradiation, an electron–hole pair is generated in TiO2. Technological devices are then based on chemical reactions that take place at the TiO2/adsorbate interface and induced electron transfers resulting from this
pair. Because of the large band gap of TiO2(3.2 eV), only 10% of the solar energy is absorbed. A major objective for future work is the development of a semiconductor photo-catalyst film, which would be able to utilize visible as well as UV light. Nanoscience has the potential to provide entirely new classes of materials with capabilities that transcend this limitation and generate the performance breakthroughs required for a viable economy based on sustainable energy.8,9 Most chemical routes to TiO2nanomaterials are based on transformations in solution such as sol–gel processing, hydro-or solvothermal syntheses, metal hydro-organic decomposition (MOD), or in the vapor phase, chemical vapor deposition (CVD). Currently used precursors of titanium dioxides are molecules that already contain metal–oxygen bonds,10–12 namely, titanium alkoxides Ti(OR)4 (R ) saturated or unsaturated organic group, alkyl, or aryl), titanium oxide acetylacetonates, or titanium salts13–16 TiX4 (X ) Cl, Br, NO3), and the oxosalt TiOSO4. The most commonly used
* Corresponding author. E-mail: [email protected]. Tel: 33 240 37 39 35. Fax: 33 240 37 39 95.
†Université de Nantes. ‡Université Lyon 1. §University of Yogyakarta.
(1) Mills, A.; Lee, S.-K. J. Photochem. Photobiol. A 2002, 152, 233. (2) Blake, D. M. Report NREL/TP-570–26797; National Renewable
Energy Laboratory: Golden, CO, 1999; www.osti.gov/bridge. (3) Dielbold, U. Surf. Sci. Rep. 2003, 48, 53.
(4) Al-Abadleh, H. A.; Grassian, V. H. Surf. Sci. Rep. 2003, 52, 63. (5) Fujhisima, A.; Honda, K. Nature 1972, 238, 37.
(6) Grätzel, M.; O’Reagan, B. Nature 1991, 353, 737.
(7) Granqvist, C. G. Handbook of Inorganic Electrochromic Materials; Elsevier Science: Amsterdam, 1995.
(8) Dresselhaus, M. In Basic Research Needs for the Hydrogen Economy; Report of the Basic Energy Sciences Workshop on Hydrogen Production, Storage, and Use, Chicago, May 15-15, 2003; U.S. Department of Energy: Washington, D.C., 2003.
(9) Hutzler, M. J., Annual Energy Outlook 2004 with Projection to 2025; Report DOE/EIA-0383; Energy Information Administration: Wash-ington, D. C., 2004.
(10) Ivanda, M.; Music, S.; Povavic, S.; Gotic, M. J. Mol. Struct. 1999,
645, 480.
(11) Zhong-chun, Wang; Jie-feng, Chen; Xing, Fong, Hu, Mater. Lett. 2000,
43 (3), 87.
(12) Soloviev, A.; Tufeu, R.; Sanchez, C.; Kanaev, A. V. J. Phys. Chem.
B 2001, 105, 4175.
(13) Mockel, H.; Giersig, M.; Wilig, F. J. Mater. Chem. 1999, 9, 3051. (14) Wu, R.; Wei, Y.; Zhang, Y. Mater. Res. Bull. 1999, 34, 2131. (15) Scolan, E.; Magneret, C.; Massiot, D.; Sanchez, C. J. Mater. Chem.
1999, 9, 2467.
(16) Zhang, Q.-H.; Gao, L.; Guo, J.-K. Nanostruct. Mater. 1999, 11 (8), 1293.
A Chem. Mater. XXXX, xxx, 000–000
10.1021/cm702531q CCC: $37.00 XXXX American Chemical Society PAGE EST: 9.9 1 2 3 4 5 6 7 8 9 10 11 12 13 14 15 16 17 18 19 20 21 22 23 24 25 26 27 28 29 30 31 32 33 34 35 36 37 38 39 40 41 42 43 44 45 46 47 48 49 50 51 52 53 54 55 56 57 58 59
organic precursors are titanium alkoxides (Ti(OR)4), which are dissolved in an alcohol and hydrolyzed by the addition of water under acidic, neutral, or basic conditions. Condensa-tion reacCondensa-tions involving the hydroxyl ligands produce polymers composed of Ti-O-Ti bonds. Titanium alkoxides are very sensitive to moisture and the gelation times of titanium alkoxides are o, the order of seconds or minutes. The hydrolysis rate of Ti(OEt)4(kh) 1 × 10⁻³mol-1s-1) is extremely fast17 and thus the nucleation and growth are never separated into two steps. In spite of the advantages of sol–gel techniques for the preparation of materials,18–21 namely, low-temperature processing, homogeneity, versatil-ity, and flexible rheology, a detailed understanding of the hydrolysis–condensation reactions leading to 3D framework growth has not yet been achieved. Chemical precursors and the nature of the solvents play a key role for the sol–gel formation. Starting from the TiOCl2precursor in an acidic aqueous solution, we have shown that the control of polycondensation at the various stages of the synthesis allows to obtain sols, gel, or solids for which the Ti-O networks dimensionality is well-defined as 0D, 1D, 2D, or 3D.22–25 Because of the enhanced surface area to volume ratio, the nanostructured sols and gels in nonaqueous solvents produce singular photoelectrochemical properties that are drastically different from their bulk counterparts. These materials can absorb photons with a lower energy than the bandgap energy of titanium dioxide, and thus a significant increase in the limiting efficiency of conventional solar cells is expected. We report herein the preparation in a one-pot process and characterization of novel and highly photosensitive sols and gel based on titanium oxide.
Experimental Section
Sol–Gel Formation. The sol–gel process, being a
low-temper-ature method, allows the preparation of hybrid organic–inorganic compounds. Our direct low-temperature processes for a highly photosensitive sol–gel based on titanium oxide involve a controlled hydrolysis of titanium species using anhydrous N,N-dimethylfor-mamide ((CH3)2NCHO, 99.8%, Aldrich, noted DMF) as solvent.
Titanium oxychloride solution stabilized in an acidic medium (TiOCl2· 1.4HCl · 7H2O, with concentration [Ti4+] ) 4.85 mol L-1,
Millennium) was chosen as precursor instead of pure TiCl4because
of the strong moisture sensitivity of the latter. In a typical experiment, hybrid organic–inorganic sol is usually prepared by adding droplets of DMF to an ice-cooled TiOCl2solution to reach
a titanium concentration range between 0.05 and 1.42 mol L-1 (noted <<TiDMF>> sol). The reaction mixture, which slowly becomes viscous, is stored in a closed container at room temper-ature. After aging for 13 days, the <<TiDMF>> sol turns into syruplike liquid and is noted <<TiDMF>> aged sol. Further heating at 70°C for several hours converts the transparent sol into transparent and waxy solid, hereafter denoted <<TiDMF>> gel. The most common diagnostic test of gelation is to turn a test tube containing the sample upside-down and then to note whether the sample flows under its own weight. It is assumed that a sample having a yield stress (gel) will not flow, whereas a viscous but elastic sample (sol and aged sol) will show appreciable flow.26In
a typical preparation, 12 mL of DMF were introduced using a syringe into a closed test tube containing 5 mL of 4.85 mol L-1 TiOCl2solution; the Ti concentration is thus 1.42 mol L-1. The
sol was allowed to hydrolyze for 24 h under stirring at 25°C, and it was then placed in an oven at 70 °C for 24 h to obtain the transparent gel.
Depending on the concentration, these gels can precipitate after a few days or some weeks. For a Ti concentration larger than 1.42 mol L-1, an opaque white product is formed that contains a mixture of a transparent polymeric phase and an amorphous white precipitate or a white precipitate of anatase in the case of very high concentration.
FTIR and FT-Raman Absorption Spectroscopy. <<TiDMF>>
sol and gel were further studied by infrared and Raman spec-troscopies. IR spectroscopy was performed using a FTIR Nicolet 20SXC spectrometer in the range 400–4000 cm-1. A drop of sol was deposited between two KBr pellets, the gel was ground with dried KBr and then pressed in order to obtain a pellet (1.3 cm in diameter) suitable for transmission mode. In ATR mode, a slight pressure applied on sample holder allows us to distinguish the solid and liquid components of the gel.
Raman spectra were taken on a Bruker RFS 100 FT Raman spectrometer with a 1064 nm laser. All the samples were set in quartz Suprasil cells. The spectra were collected at room temperature with a step scan of 2 cm-1.
NMR. All 1H and 13C NMR spectra were acquired at room
temperature on an ARX spectrometer operating at 400 MHz. The recycle times used are 2 s for NMR1H and 50 s for NMR13C.
The last one has been fixed to obtain the good proportions between each carbon in DMF. First, 1H NMR spectra were recorded
separately for dimethylammonium chloride (DMACl) in aqueous solution, methanoic acid, HCOOH, and DMF. Then, HCl was added to each sample in order to obtain acidic conditions close to those of <<TiDMF>> sol ([Ti4+] ) 1.42 mol L-1). A 1H-13C
correlation spectrum has been realized to attribute the peaks obtained in13C NMR. Fits of peaks were carried out with dmfit
2002 program,27 using Lorentzian curves. All solutions were
maintained in darkness at room temperature, in tubes 5 mm in diameter. Locking was performed with a D2O set in an inner tube
for the quantitative analysis, in order to prevent any perturbation of the system by this extra solvent.
XAS. XAS spectra were collected at the titanium K-edge in
fluorescence mode at the Hasylab facility (Hamburger Synchro-tronstrahlungslabor at DESY) on an A1 beam line, at FAME-B30B
(17) Livage, J. In Sol-Gel Technologies for Glass Producers and Users; Aegerter, M. A., Mennig, M., Eds.; Kluwer Academic: Boston, 2004. (18) Livage, J.; Henry, M.; Sanchez, C. Prog. Solid State Chem. 1988, 18,
259.
(19) Testino, A.; Buscaglia, M. T.; Viviani, M.; Buscaglia, V.; Nanni, P.
J. Am. Ceram. Soc. 2004, 87, 79.
(20) Testino, A.; Buscaglia, M. T.; Buscaglia, V.; Viviani, M.; Bottino, C.; Nanni, P. Chem. Mater. 2004, 16, 1536.
(21) Schmidt, H. J Sol-Gel Sci. Technol. 2006, 40, 1150.
(22) Brohan, L.; Sutrisno, H.; Puzenat, E.; Rouet, A.; Terrisse H. French CNRS Patent 0305619,May 9, 2003.
(23) Brohan, L.; Sutrisno, H.; Puzenat, E.; Rouet, A.; Terrisse, H. International Publication WO 2004/101436 A2, Nov 25, 2004; European CNRS patent (EP) 04 742 604.4, Nov 24, 2005; Japan (JP) CNRS Patent 2006–530327, Oct 16, 2006; United States (US) CNRS Patent 018344/0578, Feb 4, 2006.
(24) Brohan, L.; Sutrisno, H.; Piffard, Y.; Caldes, M.; Joubert, O. French CNRS Patent 0201055, Jan 29, 2002.
(25) Brohan, L.; Sutrisno, H.; Piffard, Y.; Caldes, M.; Joubert, O.; Puzenat, E.; Rouet, A. International CNRS Patent PCT WO 03/064324 A3, Aug 07, 2003; European (EP) CNRS Patent 03 734 737.4, Jan 14, 2003; Japan (JP) CNRS Patent 2003–563956, Aug 03, 2004; United States (US) CNRS Patent 2007–0041890, Feb 22, 2007.
(26) Macosko, C. W. Rheology: Principles, Measurements and
Applica-tions; VCH Publisher: New York, 1994.
(27) Massiot Hoatsonzprint, D.; Fayon, F.; Capron, M.; King, I.; Le Calvé, S.; Alonso, B.; Durand, J.-O.; Bujoli, B.; Gan, Z.; Hoatson, G. Magn.
Reson. Chem. 2002, 40, 70.
B Chem. Mater., Vol. xxx, No. xx, XXXX Cottineau et al.
60 61 62 63 64 65 66 67 68 69 70 71 72 73 74 75 76 77 78 79 80 81 82 83 84 85 86 87 88 89 90 91 92 93 94 95 96 97 98 99 100 101 102 103 104 105 106 107 108 109 110 111 112 113 114 115 116 117 118 119 120 121 122 123 124 125 126 127 128 129 130 131 132 133 134 135 136 137 138 139 140 141 142 143 144 145 146 147 148 149 150 151 152 153 154 155 156 157 158 159
or BM29, (ESRF, Grenoble) for EXAFS and XANES spectra of <<TiDMF>> sol and gel, with a seven-cell Si(Li) detector and 30- or 13-cell Ge detector, respectively. We have checked that the Ti concentration is low enough in our samples to avoid any autoabsorption corrections. The <<TiDMF>> sol and gel, in their oxidized state (i.e., not UV irradiated), were contained in a small Teflon cell covered with a 5µm sheet of kapton, assuring the air-tightness. For EXAFS and XANES experiments performed at Hasylab, a two-crystal Si (111) monochromator was used. Harmonic rejection was carried out by detuning the second crystal to 60% of maximum transmission. At FAME, a double-crystal Si (220) monochromator was used together with two Rh-coated Si mirrors for harmonic rejection. At BM29, the monochromator was a double crystal Si (111) and harmonic rejection was performed using two Si mirrors. Commercial TiO2(rutile and anatase) was mixed with
the appropriate amount of boron nitride BN to obtain, in transmis-sion detection, an absorption jump close to 1 across the edge. XANES spectra were normalized by assigning a value of 1 to the absorbance at half of first EXAFS oscillation. XANES peaks were extracted by fitting the background with a cubic polynomial function. The resulting peaks were fitted with a pseudovoigt function, the Gaussian part was fixed to a suitable value and not refined (30%). The width of the peaks were refined but constrained together. For EXAFS spectra, the kχ(k) function was extracted from the absorption coefficient using a cubic spline function.28 The
Fourier Transforms were performed on k3χ(k) with a Kaiser-Bessel
window (τ ) 3) in the k-range 4.5–12 Å-1for <<TiDMF>> gel and 5–12 Å-1 for <<TiDMF>> sol. Using FEFF7 Code,29we
calculated EXAFS oscillations for different clusters corresponding to usual Ti-O and Ti-Ti distances, namely, in the 1.90–2.20 Å range for the first shell and between 3.15 and 3.80 Å for the second shell, corresponding to connection between octahedra sharing edges or corners. All the fits were undertaken with Michalowicz’s EXAFS signal treatment and refinement programs.30
X-ray Diffraction (XRD). X-ray diffraction patterns of sols and
gel, enclosed in a Lindeman capillary, were collected at room temperature in a Debye–Scherrer geometry using an INEL diffrac-tometer equipped with a 120°curved CPS 120 position-sensitive detector and a quartz monochromator (CuKR1 radiation: λ ) 1.540598 Å).
TEM. The structure and morphology of sol and gel were
investigated by electron microscopy. <<TiDMF>> sol and <<TiDMF>> gel, crushed beforehand in DMF, were deposited on a copper grid covered with a carbonaceous membrane allowing the observation in transmission electron microscopy. A high-resolution electron microscopy (HREM) study was carried out with a Hitachi H9000NAR electron microscope operating at 300 kV with a Scherzer resolution of 1.8 Å. Image calculations were performed using the MACTEMPAS program.31To reduce irradiation damage
produced by the electron beam on the sample, the size of the condenser aperture was reduced. In spite of these precautions, the observation of the samples has proved to be difficult because of the high vacuum present in the column. Therefore, a gradual transformation of <<TiDMF>> gel was observed in the course of the experiment. Further details will be exposed in Results and Discussion.
Results and Discussion
Interestingly, these sols and gel exhibit original optical and electronic properties that will be described and discussed in a forthcoming paper. The resulting samples show high transparency and exhibit a strong red coloration upon irradiation with UV or daylight that changes to orange-yellow and finally turns dark blue after prolonged illumination, as shown in Figure 1. When UV excitation was removed, the photogenerated species exhibit a long lifetime that can reach several years in a closed test tube and at room temperature. The singular photoelectrochemical properties of nanostruc-tured sols and gels offer new possibilities in areas such as photochemical conversion and storage of solar energy, in both third-generation photovoltaic cells and photobatteries (ultracapacitors).
The structure and chemical composition of the transparent <<TiDMF>> sols and gel have been investigated using several techniques according to the organic or inorganic constituents.
Characterization of the Organic Component. FT-IR and Raman Spectroscopies. Strong mineral acids are effective
reagents for the hydrolysis of amides at about 100°C. The products are usually a mixture of the amine and carboxylic acid according to the following equation32
R2NCHO + HCl + H2O f R2NH2Cl + HCOOH (1) (R ) H, alkyl, aryl, etc.) S. Liu et al. reported also that the hydrolysis of DMF into dimethylamine is catalyzed by polyoxometalate, 12-molybophosphate acid.33In our experi-ment using TiOCl2in DMF, because of the presence of HCl to stabilize the oxychloride solution, formation of dimethy-lammonium chloride is expected. Its presence together with methanoic acid was detected by infrared, Raman, and NMR spectroscopies.
For comparison, infrared spectra for dimethyformamide slightly hydrated, <<TiDMF>> sol (freshly prepared and 4 days aging) and <<TiDMF>> gel (heated at 70 °C for (28) Winterer, M. J. Phys. IV 1997, 7, C2–243.
(29) Rehr, J. J.; Mustre de Leon, J.; Zabinsky, S. I.; Albers, R. C. J. Am.
Chem. Soc. 1991, 113 (14), 5135.
(30) Michalowicz, A. EXAFS pour le Mac, Logiciels pour la Chimie; Société Française de Chimie: Paris, 1991; p 102.
(31) O’Keefe, M. A.; KilaasR. MacTempas, V1.70 and Crystalkit V1.77,
HRTEM Image Analysis; Lawrence Berkley National Laboratory:
Berkeley, CA, 1987.
(32) Challis B. C.; Challis, J. A. The Chemistry of Amides; Zabicky, J., Ed.; Interscience Publishers: London, 1970.
(33) Liu, S.; Wang, C.; Zhai, H.; Li, D. J. Mol. Struct. 2003, 654, 215.
Figure 1. Coloration time dependence (red to dark blue) of <<TiDMF>>
sols upon daylight irradiation at 300 K.
C Chem. Mater., Vol. xxx, No. xx, XXXX PhotosensitiVe Titanium Oxo-polymers
160 161 162 163 164 165 166 167 168 169 170 171 172 173 174 175 176 177 178 179 180 181 182 183 184 185 186 187 188 189 190 191 192 193 194 195 196 197 198 199 200 201 202 203 204 205 206 207 208 209 210 211 212 213 214 215 216 217 218 219 220 221 222 223 224 225 226 227 228 229 230 231 232 233 234 235 236 237 238 239 240 241 242 243 244 245 246 247 248 249 250 251
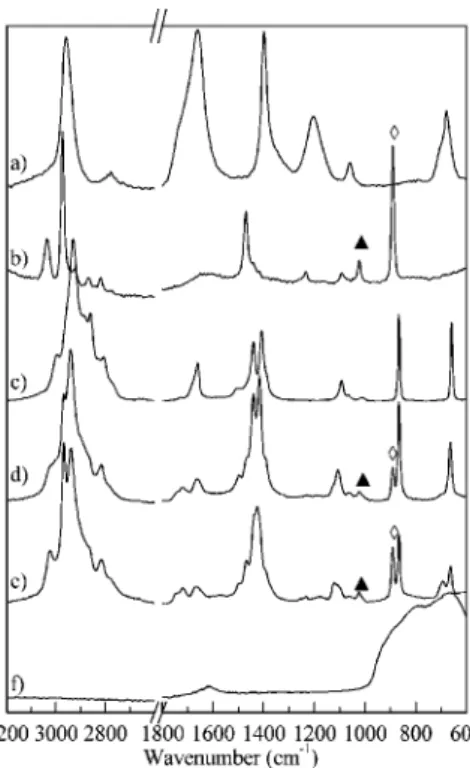
30 h, [Ti4+] ) 1.42 mol L-1) are reported in Figure 2 A sol aged for 5 months exhibits the same IR spectrum as a gel. The main bands and their assignment34–38are gathered in a table in the Supporting Information. New bands are observed when TiOCl2is dissolved into DMF (Figure 2b), namely, at 1364, 832, and 692 cm-1for the most intense, together with 1307, 1120, 962, 909, and 879 cm-1. These bands may be related to the formation of hydrated [(CH3)2N-CHO, nH2O] and protonated [(CH3)2N
+
)CHOH]Cl
-intermediates in-volved in the hydrolysis reaction of DMF.39 During the sol–gel transition, the intensity of these peaks strongly decreases for the most intense, whereas the less intense disappear. Other peaks related to dimethylammonium chlo-ride (1022 cm-1) and methanoic acid (MA) are evidenced when a sol is aged for 4 days (Figure 2c). Their intensities increase when maturation time increases and upon heating. We note also the presence of three other bands at 1555, 1367, and 889 cm-1. These bands are not detected in the liquid part of the gel but their intensities are clearly enhanced in the solid part. They can be attributed to methanoate species (M) adsorbed on the inorganic framework enclosed into the gel. IR evidence of vibration bands attributable to methanoic acid and amino-chloride salt suggests that part of the dimethylformamide was modified during the hydrolytic process according to reaction 1. In the freshly prepared sol, the intensity of the carboxylic acid vibrations is rather weak but clearly enhances upon heating. Stretching C-O
vibra-tions of methanoate ions are evidenced atνas) 1620 cm-1 andνs) 1364 cm-1for a 4 day aged sol, whereas they are shifted toνas) 1555 cm-1andνs) 1373 cm-1in the case of gel. Usually, carboxylate anions can coordinate metal cations in different ways: monodentate, bidentate (chelate), or bridging two cations. The value of∆ ) νas- νsenables us to discriminate between these different complexes.33 In the case of a 4 day aged sol,∆ ) 256 cm-1is in the range of monodentate complexation, whereas in the gel,∆ ) 182 cm-1 corresponds to a bridging or ionic carboxylate. The latter is observed only in the solid part of the gel, indicating that Ti atoms are complexed only in the polymerized inorganic component of the gel.
Figure 3 shows the Raman spectra of the aged sol <<TiDMF>> 1.42 mol L-1
and the (DMF + HCl) solution, along with those of DMF, DMACl, and metha-noic acid. For comparison, a Raman spectrum of TiOCl2 in acidic solution was also recorded. As expected, the Raman spectra of DMF/HCl solution (Figure 3e) and aged sol <<TiDMF>> (Figure 3d) are quite similar. They appear to consist of DMF component bands ((Figure 3c), whereas the additional peaks can be mainly assigned to methanoic acid (Figure 3a) and DMACl (Figure 3b). In comparison to pure DMF, the characteristic frequencies of DMF/HCl and <<TiDMF>> are slightly shifted as already underlined from the IR study. This trend, observed for DMF in many aqueous systems,40,41 is due to water molecules coordinated to DMF molecules. The intensity of DMACl vibrations at 891 cm-1 (νsCN) and 1022 cm-1 (Fip(CH3)) becomes progressively higher with increasing titanium concentration and hydrolysis spread (aged sol and gel). On (34) Nakamoto, K. Infrared and Raman Spectra of Inorganic and
Coor-dination Compounds, 4th ed.; Wiley: New York, 1986.
(35) Colthup, N. B.; Daly L. H.; Wiberley, S. E. Introduction to Infrared
and Raman Spectroscopy, 3rd ed.; Academic Press: San Diego, CA,
1990.
(36) Stalhandske, C. M. V.; Mink, J.; Sandström, M.; Papai, I.; Johansson, P. Vibr. Spectrosc. 1997, 14, 207.
(37) (a) Chang, Y.-T.; Yamaguchi, Y.; Miller, W. H.; and Schaefer, H. F.;
J. Am. Chem. Soc. 1987, 109 (4). (b) Georges, R.; Freytes, M.;
Hurtmans, D.; Kleiner, I.; Vander Auwera, J.; Herman, M. Chem. Phys.
2004, 305, 1870.
(38) Walrafen, G. E.; Pugh, E. J. Sol Chem. 2004, 33 (1), 81.
(39) Combelas, P.; Costes, M.; Garrigou-Lagrange, C. Can. J. Chem. 1975,
53, 442.
(40) Yates, K.; Stevens, J. B. Can. J. Chem. 1965, 63, 3, 5290. (41) Spinner, E. Aust. J. Chem. 1966, 19 (11), 2091.
Figure 2. tk;4FTIR spectra of various titanium compounds and organic
species: (a) DMF+H2O, (b) freshly prepared sol, (c) 4 day aged sol, (d) <<TiDMF>> gel, (e) liquid (red) and solid (black) part of gel (MA, methanoic acid; M, methanoate).
Figure 3. Raman spectra of various titanium compounds and organic
species: (a) methanoic acid; (b) DMACl, 2, 1022 cm-1<118>(CH3)ip; ), 880 cm-1νs(CN); (c) DMF; (d) 4.26 mol L-1HCl in DMF solution; (e) 1.42 mol L-1<<TiDMF>> gel; (f) TiOCl2acid solution.
D Chem. Mater., Vol. xxx, No. xx, XXXX Cottineau et al.
252 253 254 255 256 257 258 259 260 261 262 263 264 265 266 267 268 269 270 271 272 273 274 275 276 277 278 279 280 281 282 283 284 285 286 287 288 289 290 291 292 293 294 295 296 297 298 299 300 301 302 303 304 305 306 307 308 309
the other hand, the DMF components at 663 cm-1 (δO)C-N) and 866 cm-1νs(C′2N) become less dominant. The formation of methanoic acid and dimethylammonium chloride has also been checked and quantified using proton NMR spectroscopy.
1H and 13C NMR Spectroscopies. Liquid 1H and 13C NMR spectra of <<TiDMF>> sol clearly show that the DMF decomposes into dimethylammonium chloride and methanoic acid. The attribution of peaks has been made by comparison with the parent phases. The 1H and 13C NMR chemical shifts of DMACl, HCOOH, and DMF without addition of HCl, are summarized in Table 1. Figure 4, shows the spectra obtained for (a) DMACl + HCl, (b) HCOOH + HCl, (c) HCOOH + DMACl + HCl, (d) DMF + HCl, and (e) <<TiDMF>> sol after aging for 2 days. The peak of the -(CH3)2 protons of DMACl is split into a triplet because of the multiplicity rule of the signals: such protons are coupled with the two protons of -NH2
+
. The addition of HCl to DMACl (Figure 4a) and HCOOH (Figure 4b) slightly affects the signals with respect to those observed without acid. In the DMACl + HCOOH + HCl spectrum (Figure 4c), peaks characteristic of the protons of DMACl and HCOOH appear as well as those corresponding to the protons of H3O
+ , NH2
+ , and H2O. A comparison of this spectrum with that of DMF + HCl (Figure 4d) confirms that the hydrolysis reaction of DMF in acidic medium led to the formation of methanoic
acid and dimethylammonium chloride. Indeed, six peaks can be distinguished in spectrum d. Their position and attribution are summarized in Table 1, together with the results for <<TiDMF>> sol. In the 1H NMR spectrum of <<TiDMF>> sol (Figure 4e)), peaks characteristic of DMF (3.10, 3.30, and 8.42 ppm), DMACl (2.89 ppm), and HCOOH (8.51 ppm) are clearly evident. The relative surface area between the methyl groups of DMF and those of DMACl accounts for the progress of the hydrolysis reaction of DMF (at this stage, a small amount of DMF is hydrolyzed). However, some significant differences were evidenced. The peak of the -NH2
+
protons appears only in the <<TiDMF>> sol spectrum at 8.96 ppm (and not in the DMACl spectrum or DMACl + HCl spectrum). This could be explained by the difference between solution concentrations and/or to the presence of inorganic species. For the DMACl spectrum, the DMACl is diluted in water (and HCl) and thus less concentrated than in the DMF + TiOCl2 solution. In this case, it is considered that the -NH2
+
protons have the same chemical shifts as H2O (and H3O
+
) protons. Furthermore, a shift of the peak related to protons H3O
+
is observed (due to dilution with D2O for signal locking) together with a broadening of the peaks of the -CHO protons of DMF.
For the 13C NMR spectrum of <<TiDMF>> sol aged for 2 days (Figure S1 in the Supporting Information), the peaks located at 160.1, 32.5, and 27.1 ppm are assigned to DMF, C of the aldehyde group and C of methyl, respectively, whereas those located at 29.7 and 158.7 ppm are character-istic for DMACl and HCOOH, respectively.
QuantitatiVe Analysis of ,TiDMF. Sol-Gel Forma-tion. It is possible to follow the kinetic evolution of the DMF
hydrolysis by estimating the amount of the various products from1H or13C NMR and Raman spectroscopies.
The normalized amount of DMACl, calculated either from the 1H or 13C spectra, is determined by the ratio between the -CH3peak areas (at 2.89 and 29.7 ppm for 1
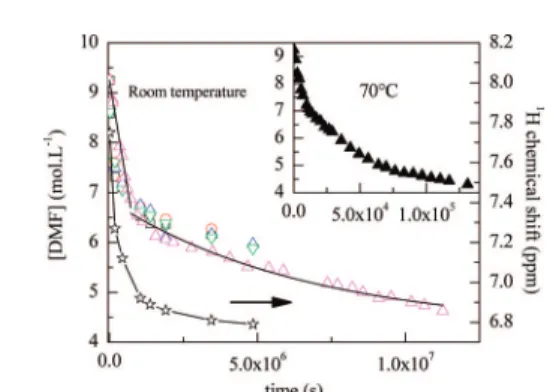
H and13C spectra, respectively) of DMACl, and the area of the -CH3 peaks related to the DMF + DMACl components. Similarly, the quantity of methanoic acid can also be evaluated by the ratio between the area of the peak at 8.51 ppm and the area of the peaks at 8.51 and 8.42 ppm in the1H spectrum and area of the peak at 158.7 ppm divided by the area of the peaks at 158.7 and 160.1 ppm in the 13C spectrum. From these data, the evolution of the concentration in DMF can be plotted (Figure 5(left)). After 56 days, the sol becomes very viscous and no signal is detectable with the liquid NMR conditions. The amount of consumed DMF corresponds to 36% of
Table 1. Assigments of1H Chemical Shifts for DMACl, HCOOH, and DMF in Aqueous Solution, Or in the Presence of HCl and Assigments of 1H and13C NMR Chemical Shifts for <<TiDMF>> Sol Aged for 2 Days
1H (ppm) in water 1H (ppm) with HCl 1H (ppm) <<TiDMF>> sol 13C (ppm)
<<TiDMF>> sol DMACl HCOOH DMF
2.74 2.78 2.89 29.7 -(CH3)2
2.85 and 3.02 2.96 and 3.14 3.10 and 3.30 27.1 and 32.5 -(CH3)2doublet
4.82 6.58 8.96 -NH2+, H2O
5.0 7.27 -CO2H, H2O
8.08 8.17 8.42 160.1 -HCO
8.25 8.34 8.51 158.7 -HCO
Figure 4.1H NMR spectra of various mixtures: (a) dimethylammonium
chloride (DMACl) and HCl; (b) methanoic acid and HCl; (c) DMACl, methanoic acid, and HCl; (d) dimethylformamide (DMF) and HCl; (e) <<TiDMF>> sol aged for 2 days, containing TiOCl2· 1.4 HCl, 7H2O, and DMF with concentration [Ti4+] ) 1.42 mol L-1.
E Chem. Mater., Vol. xxx, No. xx, XXXX PhotosensitiVe Titanium Oxo-polymers
310 311 312 313 314 315 316 317 318 319 320 321 322 323 324 325 326 327 328 329 330 331 332 333 334 335 336 337 338 339 340 341 342 343 344 345 346 347 348 349 350 351 352 353 354 355 356 357 358 359 360 361 362 363 364 365 366 367 368 369 370 371 372 373 374 375 376 377 378 379 380 381 382 383 384 385
the initial content, at room temperature. The global reaction can thus be written
TiOCl2·1.4HCl·7H2O +
x(CH3)2NCHO f “TiO2, zH2O polymer” +
y(CH3)2NH2Cl + yHCOOH + (x - y)(CH3)2NCHO + (3.4 - y)HCl + (6 -y-z)H2O (2) With x ) 6.4 and y ) 2.3 at the end of this experiment for [Ti4+] ) 1.42 mol L-1.
Furthermore, the time evolution of the acidity in the solution was followed by plotting the chemical shift of the peak of the acidic protons (H3O
+ , NH2
+
) group in1H NMR spectra. The quantity of HCl consumed during the acido-basic reaction induces a decrease in acidity of the medium. This is reflected in 1H NMR spectra by a decrease in the chemical shift of H3O
+
ions (g, Figure 5(right). Interestingly, the increased pH value has a direct consequence on poly-condensation of inorganic species: the stability of TiOCl2is altered and an inorganic condensation can occur. As evidence on XAS experiments, the TiOCl2solution is hydrolyzed into polymeric form of titanium oxides, which is schematically summarized by the reactions
TiOCl2+ 2H2O f TiO(OH)2+ 2HCl (3) TiO(OH)2, (z - 1)H2O f “TiO2, zH2O polymer” (4) Raman spectroscopy was also undertaken to quantify the advancement of hydrolysis because theνs(CN) vibration of dimethylammonium chloride (891 cm-1) and νs(C′2N) of dimethylformamide (866 cm-1) are well-separated and their relative surface areas are proportional to the (CH3)2NH2Cl/ DMF molar ratio. This assertion has been confirmed by recording reference spectra of (CH3)2NH2Cl mixed with DMF in a different ratio. To determine this area, we fitted the peaks by a pseudo Voigt function (50% Gaussian) after removing the background. The results for sols that were aged for various times and for gels are also gathered in Figure 5(left), together with the NMR results. The evolution of the DMF concentration could be followed on a longer duration. In addition, we could get additional information on the gel that was not available with the liquid NMR study. The
hydrolysis extent reaches more than 50% in agreement with the stoichiometric proportion, which is close to the maximum (53% with x ) 6.4, y ) 3.4, z e 2.6), as shown in eq 2. At equilibrium, all hydrochloric acid of TiOCl2 solution is released, leading to the hydrolysis of DMF and the formation of dimethylammonium chloride and methanoic acid. The decrease in DMF concentration can be accounted for with a linear variation (0 order kinetics) during the first 8 days and then with an exponential decay (first order kinetics). The kinetics of gelation can be significantly accelerated by an annealing treatment at 70°C. Figure 5(inset) shows the ex situ evolution of the (CH3)2NH2Cl/DMF molar ratio inferred from Raman experiments. The induction time for gelation is reduced by about 2 orders of magnitude because the sol–gel transformation operates after 36 h, whereas at room temperature, a gel may be obtained within 7 months. It is worth noting that during this discontinuous thermal treatment, required for the ex situ measurements, the gelation time is longer compared with that of the continuous reaction (24 h).
Characterization of the Inorganic Component. From
the above IR, Raman, and NMR studies of <<TiDMF>> sols and gels, it is found that the hydrolysis of DMF solvent into DMACl and methanoic acid is catalyzed by the TiOCl2 acid solution. Without stirring and annealing, the hydrolysis process is limited by the diffusion rate and proceeds slowly over several days, in such a way that the various steps of the inorganic polymerization can be easily controlled. The induced gelation phenomena have been investigated by XAS, X-ray diffraction, and TEM analysis.
XAS Experiments. The local arrangements of <<TiDMF>>
polymeric sols and gel around Ti atoms were characterized by analysis of the XAS signal recorded at the titanium K-edge. The structure of the inorganic polymer mainly depends on the initial titanium concentration and on the hydrolytic conditions, especially the aging and thermal treatment. Prior to the EXAFS signal being analyzed, information concerning the local symmetry around Ti atoms can be inferred from the XANES spectrum and particularly from the pre-edge structure analysis (figure 6).
At the titanium K-edge, freshly prepared sol, matured sol, and gel present three pre-edge peaks in agreement with Ti atoms located in an octahedral environment.42 In the case of freshly prepared sols, these three peaks are decomposed into three contributions: for a sol with [Ti4+] ) 0.1 mol L-1, A1 is located at 4968.7 eV, A3 at 4970.8 eV, and finally, B at 4973.2 eV; for a sol with [Ti4+] ) 1.42 mol L-1, the positions are A1 at 4968.9 eV, A3 at 4971.0 eV, and B at 4973.6 eV. These three peaks are close to the positions of the pre-edge structures in rutile. A matured sol and a gel exhibit the same features, and four contributions are needed to account for the pre-edge structures: A1 located at 4968.6 eV, A2 at 4970.4 eV, A3 at 4971.5 eV (sol), and 4971.7 eV (gel), and finally, B at 4973.5 eV (sol), 4973.8 eV (gel). These positions are very close to those of anatase (4968.6, 4970.4, 4971.6, and 4973.8 eV, indicating that the local symmetry around Ti atoms is similar (D2dgroup). However, in anatase, A2 appears as a shoulder of A3 (IA2/IA3) 0.6).
(42) Farges, F.; Gordon, E.; Brown, Jr.; Rehr, J. J. Phys. ReV. B 1997, 56, 1809.
Figure 5. Kinetics of DMF hydrolysis at room temperature (left scale)
determined by1H and13C NMR (1H from 0, HCOOH peak at 8.28 ppm;
O, CH3)2NH2Cl peak at 2.69 ppm; and13C from 4, HCOOH peak at 158.7 ppm; 3, (CH3)2NH2Cl peak at 29.7 ppm) and by Raman spectroscopy (4,
νs(CN)DMACl/νs(C′2N)DMFsurface area ratio), reduction in acidity (g, right scale), for TiOCl2/DMF sol with concentration [Ti4+] ) 1.42 mol L-1.
Inset: at 70°C for the same <<TiDMF>> sol and deduced from Raman experiments.
F Chem. Mater., Vol. xxx, No. xx, XXXX Cottineau et al.
386 387 388 389 390 391 392 393 394 395 396 397 398 399 400 401 402 403 404 405 406 407 408 409 410 411 412 413 414 415 416 417 418 419 420 421 422 423 424 425 426 427 428 429 430 431 432 433 434 435 436 437 438 439 440 441 442 443 444 445 446 447 448 449 450 451 452 453 454 455 456 457 458 459 460 461 462 463 464 465 466 467 468 469 470 471 472 473 474 475 476 477 478 479 480 481
In our samples, its intensity is higher than the intensity of A3, IA2/IA3) 1.3 and 1.25 for sol and gel, respectively. The attribution of A2 still remains unclear. In rutile form, A2 is fairly undetectable, and only A3 is observed. The pre-edge peaks are attributed to a quadrupolar transition of a core– electron toward the t2gorbitals for the A1 peak, mainly to dipolar transitions but also to quadrupolar contributions toward eg orbitals for A3, and purely to dipolar transition for B.43Five-fold coordinated Ti atoms were reported to give a pre-edge peak at 4970.5 eV,42 which is close to A2 position. In nanometric anatase, the intensity of peak A2 with respect to peak A3 is reported to increase when the size of anatase nanoparticles44and the crystalline domain size inside the nanoparticles45decrease because of an increasing propor-tion of Ti atoms sitting in 5-fold coordinapropor-tion. Therefore, we infer that because of the nanometric dimensions of the aged sol and gel, A2 exhibits a higher intensity than reported in bulk anatase, in agreement with previous results. However, EXAFS fitting was conducted with Ti atoms lying in an octahedral oxygenated coordination because the intensity and position of the pre-edge peaks are close to the intensity observed for octahedral environment.42 Attempts to fit the experimental data with one shell around Ti, as first neighbor, failed and then two contributions were considered. As depicted in Figure 7, (a) a diluted sol and (b) a more concentrated, freshly prepared one exhibit similar extracted signals. For the same concentration [Ti4+] ) 1.42 mol L-1,
(c) aged sol and (d) gel also exhibit quite similar signals. The extracted signals of EXAFS spectra clearly differ from a and b to c and(d samples. The results of the best fit are summarized in Table 2. The inverse Fourier transforms of the experimental and calculated spectra can be compared in Figure 7(left); the comparison of the imaginary part and the module of the Fourier transform of the experimental and calculated spectra can be made from Figure 7(right).(a) Freshly Prepared Sols. The 6-fold coordinated titanium atoms of concentrated sol ([Ti4+] ) 1.42 mol L-1) are built from one short (1.79 Å) and five rather long Ti-O distances, i.e., 2.15 Å. In a more diluted sol (0.1 mol L-1), the best simulation is obtained from one Ti-O distance at 1.84 Å and five Ti-O distances at 2.19 Å for the first neighbors. The shortest bond is typical of a Ti-O bond observed in oxides (1.86Å < d < 2.03Å), whereas the longest distance can be attributed to Ti-OH or Ti-OH2. Two Ti-Ti
(43) (a) Joly, Y.; Cabaret, D.; Renevier, H.; Natoli, C. R. Phys. ReV. Lett.
1999, 82, 2398. (b) Danger, J.; Le Fèvre, P.; Magnan, H.; Chandesris,
D.; Bourgeois, S.; Jupille, J.; Eickhoff, T.; Drube, W. Phys. ReV. Lett.
2002, 88, 243001–1-4.
(44) Luca, V.; Djajanti, S.; Howe, R. F. J. Phys. Chem. B 1998, 102, 10650. (45) Hanley, T. L.; Luca, V.; Pickering, I.; Howe, R. F. J. Phys. Chem. B
2002, 106, 1153.
Figure 6. Titanium K-edge XANES spectra: (a) TiO2 rutile, TiOCl2, <<TiDMF>> freshly prepared sol ([Ti4+] ) 1.42 mol L-1) and diluted
sol ([Ti4+] ) 0.1 mol. L-1), (b) TiO
2anatase, <<TiDMF>> aged sol-gel with concentration [Ti4+] ) 1.42 mol L-1.
Figure 7. EXAFS spectra of <<TiDMF>> samples. Inverse Fourier
transforms of experimental, filtered (in the 1.2–4 Å range), and calculated (left panels), imaginary part (right upper panel), and module of the Fourier transform (right lower panel) filtered and calculated signals: (a) diluted sol ([Ti4+] ) 0.1 mol L-1), (b) freshly prepared sol,(c) aged sol, and (d) gel
with concentration [Ti4+] ) 1.42 mol L-1. The FT are not corrected from
phase shifts.
G Chem. Mater., Vol. xxx, No. xx, XXXX PhotosensitiVe Titanium Oxo-polymers
482 483 484 485 486 487 488 489 490 491 492 493 494 495 496 497 498 499 500 501 502 503 504 505 506 507 508 509 510 511 512 513 514 515 516 517 518 519 520 521 522 523 524 525
distances have to be retained in order to account for the signal. The second neighbors are located at 3.48 Å (N ) 2,
N is the number of neighboring atoms) and 3.74 Å (N ) 2)
for [Ti4+] ) 1.42 mol L-1and at 3.52 (N ) 2) and 3.77 Å (N ) 2) for [Ti4+] ) 0.1 mol L-1. Such distances agree well with those commonly encountered in the ReO3 type structure in which distorted TiO6 octahedra share corners. The distribution of the Ti-Ti distances, 3.48-3.77 Å, originates from Ti-O-Ti tilt angles ranging from 145.5 to 180°.(b) Aged Sol and Gel. Assuming a distorted octahedral oxygenated environment, as before, the retained fit for aged sol and gel leads to three (four) Ti-O distances at 1.89 Å
(1.94 Å) and three (two) Ti-O distances at 2.10 Å (2.14 Å).
As previously mentioned, these distances can correspond to Ti-O and Ti-OH or Ti-OH2bonds, respectively. Fitting the second neighbors of Ti atoms allows us to differentiate two pairs of Ti-Ti distances located at 3.17 Å (3.15 Å) and 3.39 Å (3.37 Å). The former agrees with octahedra sharing edges, whereas the longest is observed when octahedra are connected by corners. These results suggest that the TiO6 arrangement in aged sol and gel with [Ti4+] ) 1.42 mol L-1is different from that found in freshly prepared sols with the same concentration.
X-ray Diffraction. X-ray measurements, displayed in
Figure 8, show that the polymeric sols and gel obtained in various concentration ranges remain poorly crystallized. For low concentrations of the sol samples ([Ti4+] ) 0.1 mol L-1), only two Bragg reflections are observed: a weak peak in the low-angle region, located at d ) 14.23 Å and a broad peak centered at d≈ 3.7 Å. At higher concentration [Ti4+] ) 1.42 mol L-1
, two main Bragg reflections also appeared for most of the aged sols and gels studied: an intense peak located at d ) 19 Å and an often rather broad peak located at d ≈ 3.6–3.7 Å. The aged sols and gels exhibit a quite
similar XRD patterns. The presence of a low-angle reflection suggests that these compounds could adopt a lamellar structure.
Structural Models for << TiDMF >> Sols and Gel.
Because XAS and X-ray diffraction do not give sufficient information to elucidate the packing in the fibers at the symmetric level, the structure and morphology of sols and gel in various concentrations were investigated by transmis-sion electron microscopy. The latter clearly demonstrates that these <<TiDMF>> compounds self-assemble into highly ordered polymers at the nanometer scale, and the high-resolution images reveal the structures of the titania sols and gel. (a) << TiDMF >> Sol (0.1 mol L-1). Figure 9 shows some electron micrographs of the weakly concentrated sol. The sol exhibits a ribbonlike morphology with a very regular shape and high aspect ratio (Figure 9a): length 180 nm, width 9 nm,and thickness 3 nm (deduced from the calculated image). The experimental image was processed in order to improve the observed contrasts and the filtered image is
Table 2. Refinement Results of EXAFS spectrum Performed at the Titanium K-Edge for Various <<TiDMF>> Transparent
Sols and Gela
shell element N (cf) σ (× 102) (Å) (f) R (Å) (f) ∆E (eV) (F)
Diluted Sol with Concentration [Ti4+] ) 0.1 mol L-1b
1 O 1.1(2) 10 1.84(5) 7.2
2 O 5.0(1) 10 2.19(5) 7.2
3 Ti 2.0(4) 8.5 3.52(5) 7.2
4 Ti 2.0(4) 7.5 3.77(5) 7.2
Freshly Prepared Sol with Concentration [Ti4+] ) 1.42 mol L-1c
1 O 1.3(6) 11 1.79(5) 7.7
2 O 4.7(7) 11 2.15(5) 7.7
3 Ti 2.0(2) 8.5 3.48(5) 7.7
4 Ti 2.0(2) 8.5 3.74(5) 7.7
Aged Sol with Concentration [Ti4+] ) 1.42 mol L-1d
1 O 3.0(6) 10 1.89(5) 2.5
2 O 3.0(6) 10 2.10(5) 2.5
3 Ti 3.0(6) 8 3.17(5) 2.5
4 Ti 3.0(6) 8 3.39(5) 2.5
Gel with Concentration [Ti4+] ) 1.42 mol L-1e
1 O 4.0(8) 11 1.94(5) 1.3
2 O 2.0(4) 11 2.14(5) 1.3
3 Ti 4.0(8) 9 3.15(5) 1.3
4 Ti 4.0(8) 9 3.37(5) 1.3
acf, refined under constraint; f, refined parameters; F, fixed
parameters; N, number of atoms at a distance R from the central Ti atom for each shell; σ, Debye-Waller factor; ∆E, shift in origin of
energy.bF ) 1.30 × 10⁻²;χ
v2) 2.3 × 10⁻⁴(see text).cF ) 1.34 × 10⁻²;χv2) 1.9 × 10⁻⁴(see text).dF ) 1.81 × 10⁻²; χv2) 3.9 × 10⁻⁴(see text).eF ) 2.65 × 10⁻²;χ
v2) 7.4 × 10⁻⁴(see text).
Figure 8. XRD patterns of <<TiDMF>> diluted sol with concentration
([Ti4+] ) 0.1 mol L-1) and aged sol and gel with concentration [Ti4+] )
1.42 mol L-1.
Figure 9. TEM studies of <<TiDMF>> diluted sol: (a) low-magnification
image; (b) filtered high-resolution image along [001] showing the polymeric structure; the inset calculated image is for 3 nm thick foil at 85 nm defocus; (c) Fourier transform of the image; (d) calculated ED pattern with (001) zone axis; (e) structural model along [001]; (f) experimental image showing a digital print morphology.
H Chem. Mater., Vol. xxx, No. xx, XXXX Cottineau et al.
526 527 528 529 530 531 532 533 534 535 536 537 538 539 540 541 542 543 544 545 546 547 548 549 550 551 552 553 554 555 556 557 558 559 560 561 562 563 564 565 566 567 568 569 570 571 572 573 574 575 576 577 578
depicted in Fgure9b with the Fourier tansform (Figure 9c). The two-dimensional (2D) structure of the polymer consists of nanosized thin layers with a periodicity of 3.5 Å, deduced from the distance between the parallel dark striations on the filtered image. Among the numerous titanates with layered perovkite-type structures, only one can be retained with respect to the XAS and X-ray diffraction results. The two Ti-Ti distances at almost 3.5 and 3.75 Å with both neighboring Ti atoms suggest that the structure is built from single layers as in NaLaTiO4.46 Unfortunately, the relative stacking of layers in the perpendicular direction does not agree with the experimental contrast observed in HRTEM. The tetragonal symmetry disagrees with different Ti-Ti distances, and the P4/nmm space group implies a shift of (½,½) in the (110) plane from one layer to the other, leading to more homogeneous contrasts along the [100] and [010] directions. Consequently, the structural model chosen refers to KFeF4 layered perovkite (Figure 9e), which crystallizes in the orthorhombic system with the Pm21n space group and matches with results found by XAS and XRD. Most likely, the structure consists of a layered arrangement of distorted TiO6 octahedra sharing corners in which each layer is stabilized by hydrogen bonds between water molecules and Ti-OH2bonds along a direction parallel to the long axis of the layers, i.e., the [010] direction. This conclusion is further supported by the fact that structures with very regular shape and high aspect ratio arise from a strong anisotropic growth process. Using a perovskite-like structure in projection along [001] (Figure 9e), the observed contrasts on the filtered image fit quite well with that calculated for a defocus value of 85 nm and a lamellar thickness t ) 3 nm (inset of Figure 9b). The lack of contrast along the [010] direction, results from a 1.8 Å periodicity of TiO atomic columns, which is close to the resolution limit. The calculated electron diffraction pattern (Figure 9d) in projection along [001] is in reasonable agreement with the Fourier transform image (Figure 9c). For the weakly concentrated sol, the inorganic part crystallizes in the orthorhombic system with the Pm21n space group and approximate cell parameters a≈ 7.1 Å, b ≈ 7.5 Å, and c ≈ 14 Å. The proposed structural model does not preclude the presence of the Ti-OH bonds, H3O
+
, or other species inserted into the interlayer space. Interestingly, the rigid lamellar structure of Figure 9c can be rolled and transformed into an annular disk as in Figure 9f. The main structural features of both morphologies are retained with respect to the distances on electron diffraction patterns and the width of the layer (9 nm). The lamellar to disk transformation suggests that TiO6octahedra undergo additional distortion with small tilts compared to the regular layered perovskite (Figure S2 in the Supporting Information). Assuming that the cohesion necessary for the stability of lamellar structures is provided by hydrogen bonds, the decreased amount of intercalated water molecules reduces the hydrophilic volume fraction and the transition from layer to disk structures occurs to minimize the interfacial energy between Ti-O network and water molecules. Thus the digital print morphology can
be explained as arising from breaking of some hydrogen bonds characteristics of rigid segment along [010].(b) Freshly Prepared << TiDMF >> Sol. At higher concentration ([Ti4+] ) 1.42 mol L-1), the structure of freshly prepared sol further self-assembles into arrangements with short-range order, which has not been evidenced during the HRTEM experiments. From XAS results, it is clear that the main packing motif is probably similar to the arrange-ment encountered in a diluted sol. That no structure could be isolated by TEM suggests that the extension of the 2D layers is limited in this case, probably because of the highly acidic medium during the first rapid step of hydrolysis. (c) <<TiDMF >>, Aged Sol and Gel. For both samples, we observed long thin fibers, which form an entangled network. The experimental image (Figure 9) reveals that the structure of <<TiDMF>> gel seems to present a unidimensional character (1D): the polymer fibers are wound concentrically in the manner of a cotton ball. The presence of an important disorder in the direction perpendicular to the stacking of fibers appears on the electron diffraction pattern as two diffuse lenticular spots. The average periodicity, inferred from the spacing between fibers, is close to 3.5 Å.The effect of beam-exposure on the polymeric fibers leads, after a few minutes, to the coalescence of the TiO network and the generation of small crystallites reaching ∼10 nm in diameter. Their orientation disorder gives rise to diffraction rings in the Fourier transform spectrum. From an estimate of their intensity and a relative measurement of their position, one can identify the (101) and (004) planes of anatase (Figure S3 in the Supporting Information). This suggests that the crystallites mainly extend in the (010) plane. A similar effect to that of beam exposure is obtained upon heating a sol at a temperature higher than 70 °C.In a first approximation and taking into account the previous XAS results, the structural model proposed is based on the FeUS3 type structure, which crystallizes in the orthor-hombic symmetry with the Cmcm space group. The inorganic part of aged sol and gel is built from a single chain in which distorted TiO6octahedra share edges (two short Ti-Ti distances at 3.15–3.17 Å). Such chains, running along [010], are linked together by sharing corners (two Ti-Ti distances at 3.37–3.39 Å) in the [100] direction, resulting in polymeric layers parallel to the (001) planes (a,b plane) (Figure 10). FT-IR analysis shows (46) (a) Toda, K.; Kameo, Y.; Kurita, S.; Sato, M. J. Alloys Compd. 1996,
234, 19–25. (b) Byeon, S.-H.; Park, K.; Itoh, M. J. Solid State Chem. 1996, 121, 430.
Figure 10. HRTEM experimental image of <<TiDMF>> aged sol and gel.
I Chem. Mater., Vol. xxx, No. xx, XXXX PhotosensitiVe Titanium Oxo-polymers
579 580 581 582 583 584 585 586 587 588 589 590 591 592 593 594 595 596 597 598 599 600 601 602 603 604 605 606 607 608 609 610 611 612 613 614 615 616 617 618 619 620 621 622 623 624 625 626 627 628 629 630 631 632 633 634 635 636 637 638 639 640 641 642 643 644 645 646 647 648 649 650 651 652 653 654 655 656 657 658 659 660 661 662 663 664 665 666 667 668 669 670 671 672 673 674 675 676 677 678 679
evidence that the major part of the methanoate group, formed during the decomposition of DMF, is coordinated to Ti atoms either in a bidentate fashion or via ionic interaction. Because in a freshly prepared sol the metha-noate species are mainly monodentate bonded to Ti cations, we infer that during aging, condensation of the inorganic framework leads to the formation of bridging unit between two 6-fold coordinated Ti atoms. These layers are stacked along the c axis and held together by multiple hydrogen bonds between the apicalµ2-oxygens of each octahedron and CH groups along the [001] direction, via chloride ions inserted into the layer. Because the inorganic arrangement was kept during the sol to gel transformation, the gel structure is stabilized by hydrogen bonds between DMACl groups and/or DMF. Hydrogen bonds can occur between a proton donor group -CH3, Ti-OH, and an electron-donating Cl atom or CdO group. This conclusion is further supported by the fact that in crystalline dimethylammonium chloride, each methyl group is hydrogen bonded to two chlorine atoms47(Figure 11).
Conclusion
The route for polymer synthesis, starting from titanium oxo-salt precursor in DMF solvent, is a powerful method for the design of new nanomaterials. At this stage of investigation, the sol–gel formation involves a double hydrolysis process that operates on both organic (DMF) and inorganic (TiOCl2) parts. Hydrolysis of DMF in TiOCl2 acidic medium leads to the formation of DMACl and HCOOH, and at the same time, the consumption of hydro-chloric acid enables a gentle control over the inorganic
polymerization. As a first step in our kinetic study of the highly concentrated sol, the DMF hydrolysis is mainly concerned and monodentate methanoate species are adsorbed onto the Ti-O framework. Because of the low pH values, the sol consists of two phases, i.e. a continuous phase (DMF, DMACl, HCOOH, H2O, HCl) in which the other phase, containing Ti-O/OOCH nanoribbons with octahedra sharing corners only as in KFeF4 arrangement, is dispersed. The increasing amount of DMACl and methanoic acid then induces a rapid decreasing in the acidity. In the second step, the Ti-O framework slowly condenses to form aged sol and gel. The 2D structure contains octahedra sharing both edges and corners, on which bidentate methanoate species are adsorbed. After a thermal treatment at 70°C, the fibers form a three-dimensional network in the DMF/DMACl mixture, thereby turning the aged sol into a gel. It is worth noting that the growth of the layered structures is intimately correlated to the mono- or bidentate nature of adsorbed methanoate species and to the titanium concentration. The present study clearly shows that this one-pot process allows a careful control over the hydrolysis and condensation reactions because the gelation times of <<TiDMF>> sols are of the order of days or months, depending on the thermal treatment. Therefore, the nucleation and growth mechanisms are well-separated. The size and structure of nanoribbons in sol–gel can be manipulated and controlled by adjusting the suspension pH and using suitable dispersants. These nano-structured sols and gel exhibit original optical and electronic properties that will be studied in the future.
Acknowledgment. A.R. is indebted to the Région Pays de
la Loire for a grant. Dr. Jean-Luc Rehspringer, IPCMS-GMI-Strasbourg; Dr. Fabrice Odobel and Gilbert Nourisson, LSO-Nantes; and Dr. Anne-Marie Marie are thanked for their help in TG/MS,1H NMR, and TEM experiments, respectively. Dr. Françoise Villain (LURE, France) is thanked for contributions to XAS experiments and fitting. We acknowledge Desy (Deut-sches Elektronen-Synchrotron) and Dr. Edmund Welter (Ha-sylab, Hamburg) for assistance during experiments (Projects I-04-041 EC and I-05-087 EC). This work was supported by the European Community-Research Infrastructure Action under the FP6 “Structuring the European Research Area” Program (through the “Integrated Infrastructure Initiative ”Integrating Activity on Synchrotron and Free Electron Laser Science) and by the French Ministère de la Recherche through the ACI Energie and ACI Nanosciences. We also acknowledge the European Synchrotron Radiation Facility for provision of beamtime (Projects CRG 30-02-733 and CH-2220) and thank Dr. Hervé Palancher, Dr. Olivier Proux (beamline FAME), and Dr. Carmello Prestipino (beamline BM29) for assistance in XAS data collection.
Supporting Information Available: Figures S1-S3 and an
additional table (PDF). This material is available free of charge via the Internet at http://pubs.acs.org.
CM702531Q (47) Lindgren, J.; Olovsson, I. Acta Crystallogr. 1968, 24, 549.
Figure 11. Structural model for aged sol and gel ([Ti4+] ) 1.42 mol L-1)
that is based on the FeUS3type structure.
J Chem. Mater., Vol. xxx, No. xx, XXXX Cottineau et al.
PAGE EST: 9.9 680 681 682 683 684 685 686 687 688 689 690 691 692 693 694 695 696 697 698 699 700 701 702 703 704 705 706 707 708 709 710 711 712 713 714 715 716 717 718 719 720 721 722 723 724 725 726 727 728 729 730 731 732 733 734 735 736 737 738 739 740 741 742 743 744 745 746 747 748 749 750 751 752 753 754 755 756 757 758 759 760 761 762 763 764


![Figure 8. XRD patterns of << TiDMF >> diluted sol with concentration ([Ti 4 + ] ) 0.1 mol L - 1 ) and aged sol and gel with concentration [Ti 4 + ] ) 1.42 mol L - 1 .](https://thumb-eu.123doks.com/thumbv2/123doknet/11312913.282170/9.883.83.435.124.439/figure-xrd-patterns-tidmf-diluted-concentration-aged-concentration.webp)

![Figure 11. Structural model for aged sol and gel ([Ti 4 + ] ) 1.42 mol L - 1 ) that is based on the FeUS 3 type structure.](https://thumb-eu.123doks.com/thumbv2/123doknet/11312913.282170/11.883.121.384.74.365/figure-structural-model-aged-based-feus-type-structure.webp)
