HAL Id: tel-02917992
https://tel.archives-ouvertes.fr/tel-02917992
Submitted on 20 Aug 2020HAL is a multi-disciplinary open access
archive for the deposit and dissemination of sci-entific research documents, whether they are pub-lished or not. The documents may come from teaching and research institutions in France or abroad, or from public or private research centers.
L’archive ouverte pluridisciplinaire HAL, est destinée au dépôt et à la diffusion de documents scientifiques de niveau recherche, publiés ou non, émanant des établissements d’enseignement et de recherche français ou étrangers, des laboratoires publics ou privés.
and polarization phenomena for detection mechanism
investigation of a no2 sensor and its optimization.
Ivan Romanytsia
To cite this version:
Ivan Romanytsia. Study of electro-catalytic activity of electrodes materials and polarization phe-nomena for detection mechanism investigation of a no2 sensor and its optimization.. Chemical and Process Engineering. Ecole Nationale Supérieure des Mines de Saint-Etienne, 2014. English. �NNT : 2014EMSE0760�. �tel-02917992�
NNT : 2014 EMSE 0760
THÈSE
présentée par
Ivan ROMANYTSIA
pour obtenir le grade de
Docteur de l’École Nationale Supérieure des Mines de Saint-Étienne
Spécialité : Génie de Procédés
ÉTUDE DES PROPRIETES ELECTRO-CATALYTIQUES DES MATERIAUX
D’ELECTRODE ET DES PHENOMENES DE POLARISATION POUR LA
COMPREHENSION DES MECANISMES DE DETECTION D'UN CAPTEUR
D'OXYDES D'AZOTE ET L'OPTIMISATION DE SON FONCTIONNEMENT
à soutenir à Saint-Etienne, le 29 Octobre 2014 Membres du jury
Président : Claude LUCAT Directeur de recherche CNRS, CNRS UMR5218, Talence
Rapporteurs : Armelle RINGUEDE
José Louis VALVERDE
Chargé de recherche CNRS, ENSCP, Paris
Professeur, University of Castilla la Mancha, Ciudad Real
Examinateurs : Christophe PIJOLAT
Jean MILPIED
Professeur, ENSM-SE, Saint-Étienne Senior Expert FPS, MEAS France, Toulouse Directeurs de
thèse :
Jean-Paul VIRICELLE Philippe VERNOUX
Directeur de recherche, ENSM-SE, Saint-Étienne Directeur de recherche CNRS, IRCELyon, Villeurbanne
Spécialités doctorales Responsables :
SCIENCES ET GENIE DES MATERIAUX K. Wolski Directeur de recherche MECANIQUE ET INGENIERIE S. Drapier, professeur GENIE DES PROCEDES F. Gruy, Maître de recherche SCIENCES DE LA TERRE B. Guy, Directeur de recherche SCIENCES ET GENIE DE L’ENVIRONNEMENT D. Graillot, Directeur de recherche
Spécialités doctorales Responsables
MATHEMATIQUES APPLIQUEES O. Roustant, Maître-assistant
INFORMATIQUE O. Boissier, Professeur
IMAGE, VISION, SIGNAL JC. Pinoli, Professeur
GENIE INDUSTRIEL A. Dolgui, Professeur
MICROELECTRONIQUE S. Dauzere Peres, Professeur
EMSE : Enseignants-chercheurs et chercheurs autorisés à diriger des thèses de doctorat (titulaires d’un doctorat d’État ou d’une HDR)
ABSI Nabil CR CMP
AVRIL Stéphane PR2 Mécanique et ingénierie CIS
BALBO Flavien PR2 FAYOL
BASSEREAU Jean-François PR SMS
BATTON-HUBERT Mireille PR2 Sciences et génie de l'environnement FAYOL
BERGER DOUCE Sandrine PR2 F FAYOL
BERNACHE-ASSOLLANT Didier PR0 Génie des Procédés CIS BIGOT Jean Pierre MR(DR2) Génie des Procédés SPIN BILAL Essaid DR Sciences de la Terre SPIN BOISSIER Olivier PR1 Informatique FAYOL BORBELY Andras MR(DR2) Sciences et génie des matériaux SMS BOUCHER Xavier PR2 Génie Industriel FAYOL BRODHAG Christian DR Sciences et génie de l'environnement FAYOL BRUCHON Julien MA(MDC) Mécanique et ingénierie SMS BURLAT Patrick PR2 Génie Industriel FAYOL COURNIL Michel PR0 Génie des Procédés DIR DARRIEULAT Michel IGM Sciences et génie des matériaux SMS DAUZERE-PERES Stéphane PR1 Génie Industriel CMP DEBAYLE Johan CR Image Vision Signal CIS DELAFOSSE David PR1 Sciences et génie des matériaux SMS DESRAYAUD Christophe PR2 Mécanique et ingénierie SMS DOLGUI Alexandre PR0 Génie Industriel FAYOL DRAPIER Sylvain PR1 Mécanique et ingénierie SMS FEILLET Dominique PR2 Génie Industriel CMP FEVOTTE Gilles PR1 Génie des Procédés SPIN FRACZKIEWICZ Anna DR Sciences et génie des matériaux SMS GARCIA Daniel MR(DR2) Génie des Procédés SPIN GERINGER Jean MA(MDC) Sciences et génie des matériaux CIS GOEURIOT Dominique DR Sciences et génie des matériaux SMS GRAILLOT Didier DR Sciences et génie de l'environnement SPIN GROSSEAU Philippe DR Génie des Procédés SPIN GRUY Frédéric PR1 Génie des Procédés SPIN GUY Bernard DR Sciences de la Terre SPIN HAN Woo-Suck CR Mécanique et ingénierie SMS HERRI Jean Michel PR1 Génie des Procédés SPIN KERMOUCHE Guillaume PR2 Mécanique et Ingénierie SMS KLOCKER Helmut DR Sciences et génie des matériaux SMS LAFOREST Valérie MR(DR2) Sciences et génie de l'environnement FAYOL LERICHE Rodolphe CR Mécanique et ingénierie FAYOL
LI Jean-Michel Microélectronique CMP
MALLIARAS Georges PR1 Microélectronique CMP MOLIMARD Jérôme PR2 Mécanique et ingénierie CIS MONTHEILLET Frank DR Sciences et génie des matériaux SMS MOUTTE Jacques CR Génie des Procédés SPIN
NEUBERT Gilles FAYOL
NIKOLOVSKI Jean-Pierre CMP
NORTIER Patrice PR1 SPIN
PIJOLAT Christophe PR0 Génie des Procédés SPIN PIJOLAT Michèle PR1 Génie des Procédés SPIN PINOLI Jean Charles PR0 Image Vision Signal CIS POURCHEZ Jérémy CR Génie des Procédés CIS
ROBISSON Bruno CMP
ROUSSY Agnès MA(MDC) CMP
ROUSTANT Olivier MA(MDC) FAYOL
ROUX Christian PR CIS
STOLARZ Jacques CR Sciences et génie des matériaux SMS TRIA Assia Ingénieur de recherche Microélectronique CMP VALDIVIESO François MA(MDC) Sciences et génie des matériaux SMS VIRICELLE Jean Paul MR(DR2) Génie des Procédés SPIN WOLSKI Krzystof DR Sciences et génie des matériaux SMS
XIE Xiaolan PR1 Génie industriel CIS
YUGMA Gallian CR Génie industriel CMP
ENISE : Enseignants-chercheurs et chercheurs autorisés à diriger des thèses de doctorat (titulaires d’un doctorat d’État ou d’une HDR)
BERGHEAU Jean-Michel PU Mécanique et Ingénierie ENISE BERTRAND Philippe MCF Génie des procédés ENISE DUBUJET Philippe PU Mécanique et Ingénierie ENISE FEULVARCH Eric MCF Mécanique et Ingénierie ENISE FORTUNIER Roland PR Sciences et Génie des matériaux ENISE GUSSAROV Andrey Enseignant contractuel Génie des procédés ENISE HAMDI Hédi MCF Mécanique et Ingénierie ENISE LYONNET Patrick PU Mécanique et Ingénierie ENISE RECH Joël PU Mécanique et Ingénierie ENISE SMUROV Igor PU Mécanique et Ingénierie ENISE TOSCANO Rosario PU Mécanique et Ingénierie ENISE ZAHOUANI Hassan PU Mécanique et Ingénierie ENISE
i
Outline
Introduction___________________________________
1
Chapter 1: State of art____________________________
3
Résumé_____________________________________________
5
Summary____________________________________________ 6
1.1. Air pollution _____________________________________
7
1.1.1. Sources of emissions: gasoline/diesel engines______________ 7
1.1.2. Standards of exhaust emissions__________________________ 8
1.2. Exhaust treatment systems for NOx abatement_________
10
1.2.1. Selective Catalytic Reduction – Exhaust Gas Recirculation___ 10
1.2.2. NOx trap____________________________________________ 10
1.3. Gas sensors for exhaust_____________________________
13
1.3.1 Chemical sensors - Types of sensors for O
2/NOx/CO/NH
3detection_____________________________________________
13
1.3.2. Solid Electrolytes for electrochemical sensors______________ 16
1.3.3. NOx electrochemical sensors: Impedancemetric sensors_____ 17
1.3.4. NOx electrochemical sensors: Amperometric sensors_______ 19
1.3.5. NOx electrochemical sensors: Potentiometric sensors_______ 20
1.3.5.1. Potentiometric sensors
without polarization
____________ 20
1.3.5.2 Potentiometric sensor with polarization________________
25
1.3.5.2-a: Potentiometric sensor with constant polarization technique
______________ 25
1.3.5.2-b Potentiometric sensor with pulse polarization technique __________________29
Conclusions_________________________________________
31
Bibliography_________________________________________
33
Chapter 2: Materials and Methods_________________
39
ii
2.1. Sensor elaboration procedure________________________ 43
2.1.1. Screen printing deposition______________________________ 43
2.1.2. Commercial and home-made inks compositions____________ 44
2.1.3. Preparation of electrolyte paste and gold based composite
paste ______________________________________________
45
2.1.4. Preparation of the catalytic filter_________________________ 46
2.1.5. EMSE sensors________________________________________ 47
2.1.6. MEAS sensors________________________________________ 48
2.1.7. Other EMSE devices for characterizations_________________ 48
2.1.8. Repeatability and ageing of sensors before testing__________ 50
2.2. Test conditions___________________________________ 51
2.2.1. EMSE exhaust simulation system _______________________ 51
2.2.2. Electrical equipment: potentiostat, laboratory card_________ 52
2.3 Measured parameters end notations__________________ 53
2.3.1. Baseline and base gas_________________________________ 53
2.3.2. Gas sensor responses__________________________________ 55
2.3.3. Potentiometric measurements. Galvanostatic polarization____ 57
2.3.4. Temperature regulation________________________________ 57
2.4. Characterizations techniques________________________ 58
2.4.1. Electrochemical impedance spectroscopy measurements____ 58
2.4.2. Scanning electron microscopy__________________________ 61
2.4.3. Laser granulometry___________________________________ 61
2.4.4. Analysis of specific surface area in nitrogen (BET)__________ 62
Chapter 3 : Advanced morphology composites_______
63
Résumé_____________________________________________
65
Summary____________________________________________
66
Abstract_____________________________________________
67
1. Introduction_______________________________________
67
2. Experimental______________________________________
69
iii
3.1. SEM characterizations___________________________________
72
3.2. Electrochemical characterizations_________________________
73
3.3. Sensor performances____________________________________ 77
3.3.1. OCV measurements in the base gas____________________ 77
3.3.2. NO
2sensing performances____________________________ 78
Conclusions_________________________________________
80
References___________________________________________
82
Chapter 4 : Sensor responses in galvanostatic mode___
85
Résumé_____________________________________________
87
Summary____________________________________________
88
4.1. Two-electrode sensors: Pt/YSZ/Pt, Au/YSZ/Pt________
89
4.1.1. Galvanostatic mode measurements_______________________ 89
4.1.2. Measurements of the ohmic drop as a function of the
distances between electrodes ___________________________
91
4.1.3. Determination of overall overpotentials___________________ 93
4.1.4. Two-electrode sensor responses_________________________ 97
4.2. Three-electrode sensors____________________________ 103
4.2.1. Impact of the position of the reference electrode___________ 103
4.2.2. Determination of the working electrode overpotential_______ 108
4.2.3. Three-electrode sensors responses to pollutants____________ 115
4.2.4. Baseline stability of composite working electrode based
sensor______________________________________________
122
4.2.5. Sensitivity to CO/NO
2/NO – comparison with Au, response
time, stability, recovery time____________________________
123
Conclusions_________________________________________ 127
Bibliography_________________________________________
129
Chapter 5 : Investigations of the oxygen electrode
reaction_______________________________________
131
Résumé_____________________________________________
133
iv
1 Introduction________________________________________
135
2. Experimental______________________________________ 137
2.1. Elaboration of 3-electrode sensors_________________________ 137
2.2. Electrochemical measurements___________________________ 139
2.3. Sensor response measurements___________________________ 141
3. Results and discussions______________________________
142
3.1. Oxygen electrode kinetic on Au and AuY working electrodes___
142
3.2. Oxygen electrode kinetic on AuY in presence of NO
2_________ 146
3.3. Responses to NO
2of the AuY-based sensor_________________ 152
4. Conclusions_______________________________________ 156
References__________________________________________ 157
Introduction
1
Introduction
Continuous decrease of automotive emissions limits obliges the vehicle producers to optimize combustion operation and to implement pollutants aftertreatment in exhausts such as nitrogen
oxides (NO2 and NO). In a parallel way, on-board diagnostic is required to control the
aftertreatment efficiency. Therefore, the development of sensors working in this harsh exhaust environment is strongly necessary. The actual demand of the car manufacturers deals with the
development of accurate, selective (NO and NO2), stable and cheap NOx sensors.
The development of chemical sensors with selective detection of NO2 and NO without any
interference to carbon monoxide and hydrocarbons is a logical continuation of the PhD study of J. Gao [Gao 2011 PhD] prepared at the center of Science of Natural and Industrial Process SPIN of Ecole Nationale Supérieure de Mines de Saint Etienne (EMSE). This group has a strong expertise
on chemical sensors based on semiconductor, such as SnO2, and solid electrolyte such as β-Al2O3
and Yttria-Stabilized Zirconia (YSZ). This present study was performed, as J. Gao thesis, in close cooperation with Institut de Recherches sur la Catalyse et l’Environnement de Lyon (IRCELYON) and an industrial partner: Measurement Specialties (MEAS).
The PhD study performed by J. Gao in 2007-2011 has evidenced a selective detection of NO2
in diesel exhaust of a 3-electrodes solid state electrochemical cell based on YSZ electrolyte. A constant polarization current is applied between a gold working electrode and a platinum counter electrode, while the sensor responses (∆V) are measured between the working electrode and a Pt
reference electrode. A significant drop of the ∆V was observed in presence of NO2 in the range
400 – 500°C. In addition, injections of CO and NO did not produce any variation of the sensor response.
In these operating conditions, 3-electrode Pt(CE)/Pt(RE)/Au(WE) sensors present a high selectivity to NO2 and could be used as selective sensors for exhaust applications. Despite this
advantage of the good NO2 selectivity, there are still some technological problems to solve such as:
The problem of the instability with time of the sensor baseline which is the response of the
sensor in the base gas containing mainly oxygen. This instability is probably linked with electrochemical reaction of oxygen at the working electrode.
The mechanism of the electrochemical detection of NO2 is not clear and has to be
2
The problem of the cross-sensitivity with the oxygen concentration in the exhaust feed.
Therefore, the global scientific objective of this PhD is to understand the sensor mechanism especially phenomena occurring at the electrodes, in order to bring solutions to previous mentioned problems in galvanostatic mode..
The present PhD manuscript consists of five parts.
The first chapter describes general sources of NOx pollution and NOx abatement methods. It explains the necessity of electrochemical sensors for monitoring NOx emissions. Finally, this chapter describes major families of chemical sensors for NOx detection in exhausts reported in the literature.
The second chapter presents methods used to prepare and to characterize the solid-state electrochemical sensors. It contains the technological details of exhaust sensors fabrication, and describes their main characteristics and controlled parameters. It also describes the specific sensors made for investigating the position of the electrodes.
Third chapter describes the development and characterizations of alternative composite sensing electrodes. Potentiometric solid-state gas sensors with advanced morphology of Au-based sensing
electrode were fabricated by screen-printing and tested for NO2 detection. Electrochemical
impedance spectroscopy was used to measure the polarization resistance in air of various devices with composite Au electrodes. The response time and sensitivity was improved by using composite sensing electrode in comparison with a reference Au|YSZ|Pt sensor.
The fourth chapter is focused on electrochemical sensors working under galvanostatic polarizations. Two and three-electrode sensors were used to study the position of the electrodes as well as the electrochemical properties of both reference and Au-based sensing electrodes. Finally,
the sensors responses to pollutants (NO2, CO and NO) have been recorded at 450°C.
The last chapter deals with the mechanism of the NO2 detection in galvanostatic mode. The
electrochemical properties for the oxygen electrode reaction of both Au and composite electrodes have been carried out at 450°C with systematic measurements of I-V curves for different partial
pressures of oxygen. The impact of injections of variations concentrations of NO2 on the
electrochemical properties of the composite sensing electrode was also investigated in order to
Chapter 1: State of art
3
Chapter 1
State of art:
Automotive pollution and gas sensors
for exhaust
4
Outline
Chapter 1: State of Art
Résumé_____________________________________________
5
Summary____________________________________________ 6
1.1. Air pollution _____________________________________
7
1.1.1. Sources of emissions: gasoline/diesel engines_____________ 7
1.1.2. Standards of exhaust emissions__________________________ 8
1.2. Exhaust treatment systems for NOx abatement_________
10
1.2.1. Selective Catalytic Reduction – Exhaust Gas Recirculation___ 10
1.2.2. NOx trap____________________________________________ 10
1.3. Gas sensors for exhaust____________________________
13
1.3.1. Chemical sensors - Types of sensors for O
2/NOx/CO/NH
3detection_____________________________________________
13
1.3.2. Solid Electrolytes for electrochemical sensors______________ 16
1.3.3. NOx electrochemical sensors: Impedancemetric sensors____ 17
1.3.4. NOx electrochemical sensors: Amperometric sensors________ 19
1.3.5. NOx electrochemical sensors: Potentiometric sensors_______ 20
1.3.5.1. Potentiometric sensors
without polarization
___________ 20
1.3.5.2. Potentiometric sensor with polarization________________
25
1.3.5.2-a. Potentiometric sensor with constant polarization technique
_____________ 25
1.3.5.2-b Potentiometric sensor with pulse polarization technique __________________ 29Conclusions_________________________________________
31
Chapter 1: State of art
5
Résumé
Ce chapitre est consacré à la problématique de la pollution atmosphérique issue des émissions aux échappements des véhicules. Le transport routier est responsable de la production de la majeure partie des oxydes d’azote (NOx) émis dans l’atmosphère. Il faut dire, que la majorité de cette pollution est concentrée dans des zones très urbanisées. L’exposition permanente aux gaz d’échappement a des conséquences graves pour la santé humaine, et pour cela les normes d’émission deviennent de plus en plus strictes.
Les technologies présentes dans les voitures ont besoin d’un contrôle continu de l’émission à l’échappement. L’environnement en ligne d’échappement correspond à des conditions d’utilisations très sévères : les fortes variations de température et débits, de composition des gaz, les vibrations et d’autres facteurs (poussières, humidité…) demandent au système de contrôle d’être robuste et précis pendant longtemps.
Aussi, dans ce chapitre, après un rappel d’informations générales sur les émissions polluantes et les normes restrictives associées, un état de l’art sur les systèmes de traitement des NOx, et surtout sur les différents types de capteurs dédiés à l’échappement est présenté.
6
Summary
Present chapter describes sources and consequences of large exhaust emissions of modern society. Huge demand of mobility in developed and developing countries will increase anthropogenic impact on nature and reminds actuality of exhaust abatement and particularly NOx emission. Modern standards of NOx emissions oblige vehicle manufacturers to integrate cheap, precise and long life system to control and decrease NOx concentration in exhaust.
Such systems require gas sensors to optimize and control their efficiency. Numerous devices based on physical and chemical principles are proposed by scientists but hard working exhausts conditions give an advantage to electrochemical methods. Hence, the second part of this chapter is dedicated to the state of art of electrochemical NOx sensors.
Chapter 1: State of art
7
1.1. Air pollution
1.1.1. Sources of emissions: gasoline/diesel engines
In 21-th century high level of urbanization increased anthropologic pollution of atmosphere. Mobility reached by automobile transport with internal combustion engines is responsible for important pollution by exhaust at rural, urban and traffic locations. Among numerous pollutants existing in exhaust, nitrogen dioxides (NO2) is a high reactive gas that is mainly formed by
oxidation of nitrogen monoxide (NO). These two gases are collectively known as NOX.
According to European Environment Agency, major sources of NOx pollution shows that is issued from road transport (Figure 1.1).
Presence of NOx in habitable location affects the respiratory system. Short-term exposure to
NO2 can result in adverse health effects such as changes in lung function in sensitive population
groups, while long-term exposure can lead to more serious effects such as increased susceptibility to respiratory infection. Table 1.1 shows general chemical composition of exhaust and health effects on human.
Diesel engines has less emission of carbon monoxide (CO), but high quantities of soot, sulphur
dioxide (SO2) and nitrogen oxides (NOx) are present in diesel exhaust. According to CITEPA
report in 2010 in France, around 45% of NOx emission comes from diesel vehicles and only around 5% from gasoline cars [CITEPA 2010].
8
Table 1.1: Composition of gasoline and diesel emission [Sinka 2011]
Pollutant
Gasoline engine
Diesel-engine Ratio of
gasoline/diesel Health effect
g emission/dm3 fuel
Carbon monoxide 350 20 17.5 non-carcinogenic
Hydrocarbons 50 39 1.28 carcinogenic
Nitrogen oxides 17 23 0.74 carcinogenic
Lead compounds 0.4 0 - carcinogenic
Soot (particle) 1.5 8 0.2 carcinogenic
Sulphur dioxide 0.2 8 0.03 reduced lung function
Even with higher emission impact on ecology, diesel engine market for light vehicles, heavy trucks, buses and off-highway vehicles has grown continuously during previous years (Figure 1.2). High demand of diesel engines linked with development of human society, will evidently produce increasing NOx emissions. To decrease negative consequences of exhaust emission, especially in urban areas, government of numerous developed countries applied standards of exhaust emissions.
1.1.2. Standards of exhaust emissions
To regulate and decrease negative consequences, a strategy for emissions limits and continuous decrease is applied (Figure 1.3). The emissions of SO2, nitrogen oxides (NOX), volatile organic
compounds (VOCs) and NH3 must be strongly reduced to 2020.
Chapter 1: State of art
9
At same time, as vehicle transport is responsible to air pollution, modern standards for exhaust emissions have been applied since numerous years. As an example, evolution of standards in EU is
shown in figure 1.4. The emission of NOX from diesel engine must be reduced to 6.25 times from
500 to 80 mg/km in 2015.
To achieve these emission standards, vehicle producers are obliged to modify exhaust treatment system. Nowadays, for NOx abatement, various technologies exist like Selective Catalytic Reduction (SCR), NOx Storage and Reduction (NSR) or NOx trap, Exhaust Gas Recirculation (EGR).
Figure 1.3: Scheduled evolution of emission according to strategy [Thematic Strategy on air pollution 2005]
Figure 1.4: Evolution of emission standards in Europe [Regulation of the European Parliament 2007]
10
1.2. Exhaust treatment systems for NOx abatement
1.2.1. Selective Catalytic Reduction – Exhaust Gas Recirculation
Selective Catalytic Reduction is based on chemical reduction of NOx (NO2/NO) with ammonia
(NH3) over suitable catalyst. Numerous catalysts for SCR technology are constituted by oxides
V2O5-WO3/TiO2 type or Cu/Fe exchanged zeolites [DiGiulio 2014] deposited on ceramic support.
As NH3 source, aqueous solution of ammonia 32.5% is used or Urea. Recently it is called Diesel
Exhaust Fluid (DEF). Dosing of DEF is realized according to fuel consumption and engine loop control.
Urea based SCR system requires first step of urea decomposition (equation 1.1); when ammonia solution is used, NH3 can be injected directly into exhaust stream after diesel oxidation catalyst
(DOC) and diesel particle filter (DPF) used usually as aftertreatment device (ATD) for diesel exhaust (Figure 1.5).
Further steps are SCR reactions on catalyst in exhaust. As we can see from equations 1.2-1.4
complete removal of NOx by SCR depends strongly on composition of exhaust, means O2
concentration, NO/NO2 ratio and NH3 dosing.
(1.1) (1.2) (1.3)
Chapter 1: State of art
11
(1.4) Regardless to ammonia or urea, SCR process requires precise control of the ammonia injection rate and outlet NOx concentration. An insufficient injection may result in unacceptably low NOx conversions. An injection rate that is too high results in release of undesirable ammonia to the atmosphere.
Exhaust Gas Recirculation (EGR) system is often coupled with SCR for better performance. The exhaust system returns part of the gases to the engine (Figure 1.6) and decreases the maximum temperature of air-fuel burning mixture to lower the quantity of NOx.
1.2.2. NOx trap
NOx trap is based on selective capturing of NOx on Ba-based catalyst and periodical cycles of NOx Storage-Release.
Firstly the NOx are stored during lean engine operation (λ>1, T 150-450 °C, where λ – air/fuel rate), on a porous carrier in the catalytic converter, which is impregnated with metals – Platinum, Rhodium and Barium [Chaugule 2010], [Clayton 2009], [Rico-Pérez 2013], [Hadjar 2011]. In this
phase the catalyst converts nitrogen oxide (NO) into nitrogen dioxide (NO2). The barium
carbonate (BaCO3), traps and holds NO2 as part of an aqueous barium nitrate solution – Ba(NO3)2
(Figure 1.7)
12
In the Release Stage (Figure 1.7), reduction of NOx to N2 at rich burn condition (λ<1; T
200-500 °C) takes place. The nitrogen oxides are converted into neutral gases (N2 and CO2) by
hydrocarbon and hydrogen. After this step, NOx Trap, is regenerated and is ready to go on trapping more NOx.
A similar HC-NOx trap technology is presented by Nissan motors. It is based on two layers catalyst combination of hydrocarbon (HC) and NOx catalysts (Figure 1.8) which at lean burn condition can adsorb HC-NOx species. At rich burn a condition, reduction of NOx is realized at same time as HC oxidation; as a result, catalysts can be fully reinitialized.
As we can see, numerous system are proposed for decreasing of NOx emission from exhaust, but dosing of DEF, control of NH3, NO/NO2 ratio and robust control functionalities for the
transition between lean and rich engine operation have to be developed and implemented. This permanent and exact control can be realized by using exhaust chemical sensors.
Figure 1.7: NOx trap technology [Schnitzler 2010]
Chapter 1: State of art
13
1.3. Gas sensors for exhaust
1.3.1. Chemical sensors - Types of sensors for O
2/NOx/CO/NH
3detection
Detection of chemical species in combustion environment can be realized by different devices based on optical or solid-state system.Optical systems are based on detection of emitted or adsorbed electromagnetic waves in infrared (IR) [Ohtani 2004], ultraviolet (UV) or visible (Vis) part of spectra [Di Franco 2009]. Solid state system are based on variation of measured parameter of solid device as, resistivity (Ω) [Sharma 2013], conductivity (σ) [Tuller 2013], capacity (C) [Ishihara 1995], electromotive force (EMF) [Miura 2002], [Chevallier 2008], [Yin 2013], [Gao 2011], current (i) [Kobayashi 2001], etc. Table 1.2 classifies the combustion techniques according to their response time characteristic denote as “Frequency” and working principle and measured parameter.
Utilization of optical systems is limited by their size, energy consumption, and necessity of direct access to exhaust or flame and complex algorithm of signal transformation from
Table 1.2: Optical and solid state sensors for combustion control. [Docquier 2002]
a EM-emission, ABS – absorption
b NB/WB SPEC – narrow/wide-band spectrometer, PMT – photo multiplier tube, PD – photo diode, LD – laser diode, RTD –
14
electromagnetic waves to electrical signal. Due to this reason, utilization of optical gas sensors is limited in automotive industry.
From numbers of years, electrochemical potentiometric solid-state sensors are used for automobile combustion control because of low power consumption, electrical nature of produced signal, size, high stability and fast response. Most popular and used one is electrochemical potentiometric sensor well known as λ-probe for oxygen (Figure 1.9).
Mechanism of zirconia-based oxygen sensor is well known since Walther Nernst described the physical behavior of galvanic elements known as the Nernst equation (eq.1.5) [Göpel 2000]
(1.5)
R is universal gas constant (R = 8.314 472 J K−1 mol−1)
T is absolute temperature (K)
F is Faraday constant (F = 9.648 533×104 C mol−1)
) (
2 exhaust
PO is oxygen partial pressure in exhaust,
) (
2 reference
PO is oxygen partial pressure in reference (air).
Relationship 1.5 is based on thermodynamic equilibrium and fast kinetic reactions at the electrode interface assured by high catalytic activity of platinum electrodes in regards of oxygen reaction
Figure 1.9: Typical λ-probe – A [Fischer 2010] and typical output signal (V) – B [Docquier 2002]
Chapter 1: State of art
15
Easily predicted behavior and correct variation of output potential as a function of partial pressure of oxygen in exhaust (Figure 1.10) indicate the fuel/air ratio called lambda (Figure 1.9 B), and allow controlling lean or burning conditions of combustion.
Another type of potentiometric solid state gas sensors is called mixed-potential or non-Nernstian sensor. When reference electrode (RE) is exposed to same atmosphere as sensing electrode (SE), common EMF could not be calculated from Nernstian equation.
The signal of a two electrodes potentiometric sensor, in a complex gas environment, shows a non-Nernstian behavior due to the establishment of a mixed potential [Gao 2011], [Somov 1996], [Yin 2013] on the sensing electrode. This latter is linked to the superposition of parallel electrode reactions occurring at the triple phase boundaries (TPB) [Yin 2013], [Zosel 2002], [Chevallier 2008], [Miura 2002], such as the oxygen electrode reaction and the electrochemical reduction
(oxidation) of NO2 (NO).
Modification of sensitivity and selectivity can be reached by using different sensing electrode materials or electrochemical methods such as galvanostatic or potentiostatic polarization, or by
applying pulsed or alternative current to electrodes. Some recent NO2, NO, NH3, CO, CxHy
sensors are based on this principle.
Figure 1.10: Output signal of zirconia based sensor as a function of O2 fraction in N2 at 550°C [Docquier 2002]
16
1.3.2. Solid Electrolytes for electrochemical sensors
Almost all electrochemical sensors and specially potentiometric and amperometric are
composed of a high temperature solid electrolyte such as oxygen conductor O2- –yttria-stabilized
zirconia (YSZ) [Gao 2011], [Somov 1996], [Yin 2013], [Zosel 2002], samarium-doped-ceria (SDC)
[Pijolat 2009], [Fergus 2011], gadolinium-doped-ceria (GDC) [Brosha 2002] or Na+ conductor –
β-alumina (2Na2O–11Al2O3) [Guillet 2002].
Role of solid electrolyte is to provide ionic contact between electrodes. This contact is possible because of anion or cations vacancies in solid structure of electrolyte. As example, the modification of cubic zirconia by addition of yttrium oxide is shown on figure 1.11.
When cubic zirconia is stabilized by addition of yttrium at high temperature, the dopant cations Y3+ substitutes Zr4+ sites in the crystal structure and produces oxygen vacancies to maintain the
charge neutrality of crystal according to equation 1.6:
(1.6)
In equation 1.6, '
Zr
Y is cation of yttrium replacing zirconium ion, x
O
O - oxygen placed in normal
lattice oxygen position and VO - vacancy of oxygen. More than 99% of conductivity is carried by
oxygen ions. As we can see, vacancy concentration could reach 4 mol % by addition of 8 mol % of Y2O3.
In oxygen containing atmosphere solid adsorbs oxygen at the sample surface. Then, adsorbed oxygen can be incorporated in the solid by diffusion into vacant anion sites, creating the holes, as shown by equilibrium [West, 2014] in equation 1.7:
Chapter 1: State of art
17
(1.7) Mobility of oxygen ions or other carriers of charge in solid electrolytes depends strongly on temperature and is described by Arrhenius equation 1.8:
(1.8) is ionic conductivity (S.m-1), 0 is preexponetial factor (S.m-1.K) T is absolute temperature, K EA is activation energy, eV kb is Boltzmann constant, kb = 8.6173324(78)×10−5 eV
Figure 1.12 shows variation of logarithm of ionic conductivity with temperature for different solid electrolytes. As shown the conductivity of solid electrolytes increases exponentially with temperature; for this reason, the temperature during electrochemical measurements must be precisely controlled. The widely used and studied YSZ electrolyte possesses pure ionic conductivity at high temperature range 380-1400°C and oxygen partial pressures from 10-25 up to 105 Pa
[Zhuiykov 2008].
Figure 1.12: The temperature dependence of logarithm of ionic conductivity with temperature of some good solid electrolytes(A)[West 2014] and oxygen conductors (B)
18
1.3.3. NOx electrochemical sensors: Impedancemetric sensors
Impedancemetric sensors are electrochemical cells with two or more electrodes (Figure 1.13 A). The impedance of a material (Z) describes the electrical response to an alternative applied signal and includes both magnitude (|Z|) and phase angle (θ) information. The relationship 1.9 describes the complex impedance:
(1.9) Where Re(Z) is the real component and Im(Z) is the imaginary component:
(1.10) (1.11) The relationship for phase angle is described by equation 1.12:
(1.12) and for magnitude |Z| by equation 1.13:
(1.13) Representation of impedance as complex number |Im| and real part |Re| as a function of frequency is named Nyquist plot (Figure 1.13-B). Numbers corresponding to darkened points represent log of frequency in Hz. At 10 Hz, value of |Z|1 in 10.5% O2 is higher than |Z|2 in
10.5% O2 +100 ppm NO2 (or NO). Variation of impedance at low and constant frequency is
proportional to target gas concentration and can be used as signal of sensor.
Figure 1.13: Schematic of Pt/YSZ/Au cell – A, and Nyquist plot of Pt/YSZ/Au cell at 650 °C in 10.5% O2 and in 10.5% O2 with 100 ppm NO or 100 ppm NO2 – B [Woo 2007],
Chapter 1: State of art
19
In the presented impedancemetric devices, low frequency area, around 0.1-10 Hz, reflects the
behavior of electrodes, for example Pt and Au, Pt and NiO [Wang 2012], Pt-loaded oxides WO3,
TiO2, V2O5 [Shimizu 2008], which interacts with target gas. High frequency region representing bulk conductivity of electrolyte is not affected by gas.
Despite high number of sensitive materials, utilization of impedancemetric sensor needs high precision measurement system with frequency analyzer. Also, the stability of electrolyte and electrodes with time is strongly required.
1.3.4. NOx electrochemical sensors: Amperometric sensors
In amperometric sensor, measured current is proportional to gas concentration. As example, oxygen amperometric sensor with diffusion barrier is presented on figure 1.14. Constant tension
(U) between electrodes produces ionic current I (O2-) in solid electrolyte (YSZ) (Figure 1.14-A). At
relative oxygen concentrations below 10%, a linear relation between oxygen partial pressure and limiting current holds to a good approximation of oxygen concentration according to equation:
(1.14)
F is Faraday constant, F = 9.648 533×104 C mol−1
A is the cross section of diffusion channel
R is universal gas constant, R = 8.314 472 J K−1 mol−1
T is absolute temperature, K L is the length of diffusion channel
2
O
D
is the oxygen diffusion coefficient2
O
P
is the oxygen partial pressureFigure 1.14: Amperometric sensor with diffusion barrier –A and amperometric two electrode cell for the simultaneous detection of oxygen NO – B [Göpel 2000]
20
M any electrochemical reactions can take place on one electrode at constant potential. For improvement of selectivity, amperometric sensors with multielectrodes are used (Figure 1.14-B). Each of
electrodes is polarized at different potential to achieve the selectivity to target gas – O2 and NO by
monitoring I1 (at U1 - const) and I2 (at U2 - const), respectively.
NGK-Siemens commercial NOx sensor is based on same principle (Figure 1.15). Two
successive cells are used to separate oxygen and NOx detection. Oxygen rich exhaust mixture
diffuses through first cell. In first cell, oxygen pumping current i1 is applied and oxygen can be
removed from mixture and measured as current i1. Oxygen concentration in first cell is determined
by potentiometric measurement V. Then, gas diffuses in the second cell where NO reduction is
possible at low pO2. Measured current i2 indicates NO concentration.
Inconvenient of this type of sensor is high complexity, high cost due to the electronics necessary to measure the small sensor signal, and low precision at concentration of NOx below 100 ppm.
1.3.5. NOx electrochemical sensors: Potentiometric sensors
1.3.5.1. Potentiometric sensors without polarizationAs was showed in section 1.3.1 potentiometric sensors can be separated in Nernstian and Mixed-potential [Docquier 2002]. For Nernstian sensors, output signal – difference of potential (U) - can be calculated and predicted by Nernst equation 1.5.
Chapter 1: State of art
21
The signal of a two electrodes potentiometric sensor (Figure 1.16), in a complex gas environment, shows a non-Nernstian behavior due to the establishment of a mixed potential [Gao 2011], [Somov 1996], [Miura 2002] on the sensing electrode.
Mechanism for mixed potential sensors is more complex, where gases are not in thermodynamic equilibrium at the electrode surface and at the interface with the solid electrolyte.
Mixed electrode potential (MIX) is obtained from two electrode reactions with different
equilibrium potentials (1, 2), as for example reactions (1.15) and (1.16).
with 1
(1.15) with 2
(1.16) In general, mixed potential is given by the condition of the net zero current of all involved electrode reactions. This latter is linked to the superposition of parallel electrode reactions, 1.15 and 1.16 for example, occurring at the triple phase boundaries (TPB) of each electrode of potentiometric sensor (Figure 1.16).
When two electrodes of sensor are exposed to identical atmosphere, a mixed potential MIX is
realized on each electrode and sensor EMF is the difference of the twoMIX:
Figure 1.16: Mixed-potential sensor(A) [Yingzhou 2014] and polarization curves for calculation of mixed potential of one electrode (B)
22 (1.17) Where RE mix and SE mix
are respectively the reference and sensing electrode mixed potential.
Sensing characteristics of potentiometric sensor strongly depend on electrode material, temperature and morphology of sensing electrodes. Large numbers of works are concentered to improve sensing characteristics like selectivity and sensitivity of sensors.
Numerous materials have been tested as sensing material in potentiometric sensors at different temperatures In Table 1.3, oxide-based sensing materials are presented for NOx detection.
At the same time, utilization of metals as sensing electrode is possible and widely studied. To produce the EMF, these two electrodes must possess different electrocatalytic activity to detect NOx or other target gases, such as the couples Au [Gao 2011], [Somov 1996], [Sekhar 2010],
Pt-MnCr2O3 [Yin 2013] or Pt – (Au-oxide) [Zosel 2002].
The morphology of the two electrodes plays a significant role in the number of TPB [Yin 2013], [ChaoYang, 2011], [Zosel 2008] then on the kinetic of the electrode reactions and finally on sensing performances. For instance, a sensor with two Pt based electrodes showing asymmetric
morphologies can be effective for NO2 detection [Yang 2010], [Guillet 2012].
Composite electrodes made of Pt or Au mixed with an oxide is also investigated to improve the sensing performances. Recent studies have reported on Au+YSZ [Striker 2013] composite for
Table 1.3: Materials of sensing electrode for mixed-potential NOx sensors from different authors [Zhuiykov 2007].
Chapter 1: State of art
23
NOx and CO detection at 500°C, Au-NiO, Au-Nb2O5 [Zosel 2008] electrodes operated at 650°C,
Au-NiO at 600°C [Plashnitsa 2009] and even at 700° or 900°C [Elumalai 2005]. Oxide-based composites often work at high temperature over 550°C allows improving response time and sensitivity, but selectivity of composites does not differ from commonly used materials for potentiometric sensors.
Indeed, the mixed potential solid state sensors are sensitive to numerous gases present in
exhaust as NO, NO2, CO, hydrocarbons, SO2, NH3, etc. To solve the problem of cross selectivity,
especially to reduce or cancel the response to reducing gases, typically CO and hydrocarbons, a common solution is to use a catalytic filter [Yang, 2008] [Gao 2011], [Yang 2007], [Yang 2010]. Figure 1.17 shows a typical result obtained from J Gao PhD with a Pt/YSZ/Au sensor, at 520°C. Without filter, one can see a positive response to hydrocarbons (CxHy), CO and NO, and a
negative one with NO2. With a Pt base filter, the responses to CO and hydrocarbons are removed.
In the case of NOx (NO+NO2), another problem is the opposite sensitivity to oxidant (NO2)
and reducing gas (NO). As a result, for a fixed total NOx concentration, the sensor response will
vary depending on NO/NO2 ratio, as shown in figure 1.18 , and even can come close to zero for
certain conditions. One can also see that such a sensor has a higher sensitivity to NO2 than to NO.
Figure 1.17: Comparison of sensors response with and without catalytic filter at 520°C in 12 % O2 2 % H2O, N2 balance; Flow rate 30 l/h; [Gao 2011]
24
So, the interest of a catalytic filter is also to set the NO-NO2 concentrations to a fixed ratio of
equilibrium concentrations [NO]/[NO2] corresponding to the one imposed by thermodynamic
equilibrium (eq. 1.18).
(1.18)
Therefore, the [NO]/[NO2] ratio is only dependent on the temperature, and on partial pressure
of oxygen. The decomposition of NO2 into NO (the white dots) is favored by temperature and at
500 °C for example, only 30% of initial NO2 concentration is still present (Figure 1.19 B).
Figure 1.19: Values of the equilibrium constant, Kp, and the dissociation degree,
α
, corresponding to the thermal decomposition of NO2 into NO – A [Pârvulescu 1998] andequilibrium conversion of NO and NO2 at different temperatures – B [Miura 1998] Figure 1.18: Comparison of sensor response without catalytic filter at 520°C in 12 % O2 2
% H2O, N2 balance; Flow rate 30 l/h at various proportions of NO2/NO [Gao 2011]
-40 -20 0 20 40 60 0 1 2 3 4 5 6 t [h] D V [m V] 100 ppm NO2 100 ppm NO 37 ppm NO2 63 ppm NO 24 ppm NO2 76 ppm NO
Chapter 1: State of art
25
As a consequence, as seen in figure 1.17, the sensor with a filter presents a similar response to
either 200 ppm of NO or NO2. Indeed, in both cases, the sensor will see the equilibrium
concentration, around 140 ppm NO – 60 ppm NO2 considering NO2 conversion around 70% at
this temperature. As the sensor is more sensitive to NO2, the resulting response is negative.
To conclude, a only highly NO2 sensitive to potentiometric sensor equipped with a catalytic filter at a constant temperature and oxygen partial temperature could provide concentrations of
NO2, NO and overall NOx.
1.3.5.2. Potentiometric sensor with polarization
1.3.5.2-a. Potentiometric sensor with constant polarization technic
Another way to obtain selective and sensitive sensors is based on polarized electrochemical cell.
Concept of polarized cell for potentiometric measurement of NO or NO2 in potentiostatic
condition of sensing electrode was presented by Miura [Miura 1998], further transformed to amperometric sensor [Miura 1999].
A three-electrode electrochemical cell is showed on Figure 1.20-A. In OCV mode (Open Circuit
Voltage, no polarization) sensor produces opposite variation of EMF named ES, between sensing
(SE) and reference (RE) electrodes, to 200 ppm NO and 200 ppm NO2 (Figure 1.20-B).
Figure 1.20: Electrochemical cell for NO/NO2 detection – A and output signal to 200
ppm NO or NO2 at 500°C without polarization – B, with polarization +100 mV – C,
26
When a constant positive polarization VC-S = +100 mV between SE and CE (counter electrode)
is applied, in presence of NO, the potential of SE versus RE decrease with identical amplitude than that for VC-S=0. For 200ppm NO2, the response is 10 times lower (Figure 1.20-C). Opposite behavior of sensor is observed for negative polarization, -60mV (Figure 1.20-D), where response
to NO is much lower than for NO2.
Hence, by applying of voltage to sensing electrode, selectivity to NO over NO2 or to NO2 over
NO can be controlled electrochemically by using a three-electrode device while keeping sensitivity. There is also galvanostatic regime, when potential of SE is fixed by constant current. To reach the adjusted current a potential is applied between CE and SE. This method can be applied for two or three electrode cell. In first case, potential is measured between CE and SE, in second – potential of SE is measured versus RE.
Figure 1.21: Non-biased (A) and biased (B) response of 2-electrode sensor
Pt/YSZ/La0.8Sr0.2CrO3, to NO/NO2 and hydrocarbons; variation of outbut sensor voltage with time non-biased (C) and biased (D) sensor [Sekhar 2010]
Chapter 1: State of art
27
Device presented by Praveen K. Sekhar shows increase of sensitivity to 100 ppm NO2 from -75
mV of non-biased 2 electrodes-sensor to -160 mV for biased by 1 nA (Figure 1.21-A, B). Remarkable is the almost non sensitivity to NO with 1nA bias. At same time, positive response to hydrocarbons C3H6 and C3H8 is lower than for non-biased device.
Unfortunately, a baseline drift (increase) with time of polarization is observed for biased sensor (Figure 1.21-D. This phenomenon is linked to electrode/electrolyte interface modification under polarization and is observed by numerous authors and for different electrode materials: Au [Raźniak 2011], Pt [Yang 2007], [Mutoro 2008], Pt-YSZ [López-Gándara 2012], Pt-FeOx [Mutoro
2010], Ag [Raźniak 2011], LaMnO3 [Brichzin 2002]. Stability of interface, baseline and sensor signal
is very important factors for correct gas detection.
Last PhD work realized by J. Gao in 2007-2011 showed principle possibility of selective and
high sensitive detection of NO2 in exhaust with planar 3-electrode solid state electrochemical cell
(Figure 1.22-A).
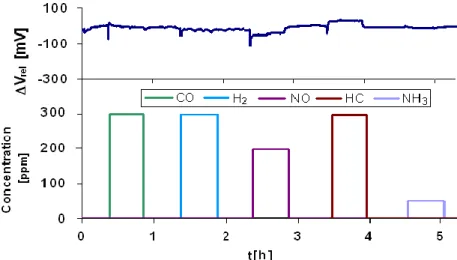
Figure 1.22: Principle design of three electrodes sensor cell (A) and typical response (B) to 100 ppm NO2 or 100 ppm NO at 450°C in 12% O2, 1.5% H2O, N2 under different
polarization current [Gao 2011 PhD].
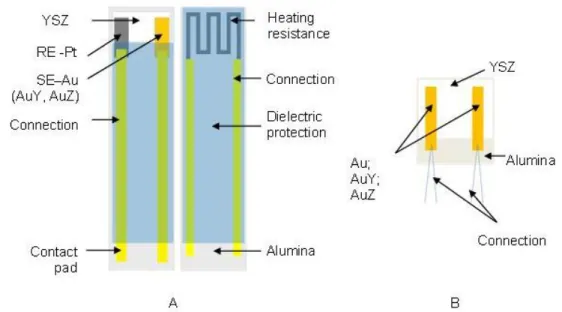
Electrochemical cell consists in three metallic electrodes on YSZ solid electrolyte deposited on
Al2O3 substrate with heating element on opposite side. By applying a constant polarization current
(Ipol) between gold working electrode and platinum counter electrode, measured potential between
working and reference electrodes (∆V) is fixed by polarization current, temperature and oxygen
partial pressure. In presence of NO2 important decrease of measured ∆V is observed and is
proportional to NO2 concentration. Effect of polarization is showed on Figure 1.22 B: by
28
NO2 at 100 nA. The selectivity to NO2 is observed for large region of Ipol: 5-100 nA. Moreover,
there is no more significant response to NO, but also to any other reducing gases as shown in
Figure 1.23. Thus, the polarized sensor is only sensitive to present [NO2].
Figure 1.23: The relative response to gases of polarized sensor (Figure 1.22-A) under 100 nA polarization in 12 % O2; 2 % H2O; N2 – balance; Flow rate 30 l/h; Temperature:
450 °C. [Gao 2011 PhD]
As we have previously seen, that the similar sensor without polarization, but with a catalytic
filter can give a total NOx response, an idea was to combine polarization and filter effect. This has
been done in Jing Gao PhD and a typical response with polarized sensors, with or without catalytic
filter is shown in figure 1.24. The sensor without filter only responds to NO2. The one with a filter
gives a response to NO2 concentration corresponding to NO/NO2 equilibrium noted hereafter
[NO2]eq.
Knowing the equilibrium constant
K
(T,PO2) from equation 1.18, this requires temperature butalso oxygen concentration knowledge, it is possible to calculate the total NOx concentration:
(1.19)
Finally, combining two sensors and having measurement of [NO2] with a sensor polarized
without filter, one can determine also [NO].
Chapter 1: State of art
29
Figure 1.24: The sensor response to CO/NO2 or NO of polarized sensor equipped or not by catalytic filter (Figure 1.22-A) under 100 nA polarization in 12 % O2; 2 % H2O;
N2 – balance; Flow rate 30 l/h; Temperature: 450 °C. [Gao 2011 PhD]
Despite advantages of selectivity, there are still problems to solve:
Problem of “base line stability” – signal of sensor without NO2/NO- which is probably
linked with electrochemical reaction of oxygen on working electrodes.
Unknown mechanism of electrochemical detection of NO2 and origin of “base line”
Problem of oxygen concentration variation on the sensor response to NOx.
1.3.5.2-b Potentiometric sensor with pulse polarization technique
The pulsed polarization technique is based on the self-discharge of the electrodes, measured after alternating voltage pulses applied to the electrodes of a conventional lambda sensor [Fischer 2010, Fischer 2012] Figure 1.25 shows electrochemical cell (A) and influence of presence of NO on discharging curves (B): accelerated discharging in NO containing atmosphere compared to that in a base gas at both polarization signs (positive or negative pulse). Presence of NO is calculated as potential of electrode at constant time after polarization pulse.
30
This technology is under development. At the moment, it seems that it has low selectivity versus
other gases (NH3, H2, CxHy) and that there is a high influence of pO2 on discharging time.
Figure 1.25: Electrochemical cell for NO detection (A) and output signal in presence of NO (B) [Fischer 2012]
Chapter 1: State of art
31
Conclusions
Continuous decrease of automotive emissions limits obliges the vehicle producers to optimize combustion operation and to monitor pollutants in exhaust such as nitrogen oxides – NO2 and NO. For this application, a sensor working in harsh exhaust environment is needed. In actual
demand of industry, it must be precise, stable, cheap and selective to NO2/NO.
Among numerous possibilities to control NOx in exhaust, electrochemical sensors are widely used and studied. They exist with different technologies with some advantages and inconvenient, as shown previously. Common problem of most of electrochemical sensors is their selectivity to
gases, with similar properties to reducing gases like CO, NO, SO2, NH3, hydrocarbons etc.
Utilization of catalytic filters allows minimizing cross sensitivity by oxidation to inactive CO2 of
CO and hydrocarbons. Transforming by a catalytic filter NO into NO2 according to
thermodynamic equilibrium requires a temperature below 550 °C: at higher temperatures, amount of NO2 is low, and sensitivity of mixed-potential sensor also decreases because of increasing of
catalytic activity of electrodes.
Amperometric sensors can selectively measure concentration of oxygen and NO present in
exhaust, but electrochemical reduction of NO to N2 is unfavorable in oxygen presence. Complex
design of amperometric sensors with pumping chambers for O2 and NO allow separating current
from O2 and NO reduction; meanwhile, current from 10 ppm NO will be around 105 times lower
than for 10 % O2. In this condition, precision of amperometric sensor below 100 ppm is low.
Modification of electrode selectivity can be realized by galvanostatic polarization. Potential of
electrode fixed by polarization depends on NO2 concentration. In presence of NO2, potential of
polarized sensing electrode decreases dramatically. This decrease is much higher than for mixed-potential sensors and is absolutely selective to NO2.
That’s why we have decided to continue on the basis of Jing Gao PhD results.
Deeper investigations point out a drift of baseline of sensors with polarization, long term stabilization of baseline and influence of oxygen concentration on it. Published data explain this variation by modification of electrode/electrolyte interface, ageing of solid electrolyte, loss of catalytic activity of electrodes by poisoning. In this context, profound study of role of electrolyte, electrode materials and interface electrode/electrolyte is required.
Utilization of advanced electrode materials like composites allows to increase sensing characteristics of sensor, like response and recovery time, sensitivity, improvement of interface electrode/electrolyte stability, and increases number of triple phase boundaries [Chen 2014 SSE, Chen 2014 S&A], [Zosel 2008], [Striker 2013]. In the objective to optimization of 3-electrodes cell
32
Working in oxygen containing atmosphere, sensing parameters of sensor depend on oxygen
concentration. The understanding and interpretation of relationship with sensitivity to NO2 and O2
are also a major axis of present work.
The global scientific objective of this PhD is to understand the sensor mechanism under galvanostatic polarization by studying electrochemical parameters of electrolyte and electrodes, role of material and positions of electrodes, then to optimize the sensor design and to define critical parameters of used material: composition, geometry, optimal working conditions.
Chapter 1: State of art
33
Bibliography
Brichzin V., Fleig J., Habermeier H.-U., Cristiani G., Maier J., 2002, The geometry dependence of the polarization resistance of Sr-doped LaMnO3 microelectrodes on yttria-stabilized zirconia, Solid State Ionics, 152–153, p.499-507.
Brosha E.L., Mukundan R., Brown D.R., Garzon F.H., Visser J.H., 2002, Development of ceramic mixed potential sensors for automotive applications, Solid State Ionics, 148, p.61– 69. ChaoYang X., XuChen L., Yan Y., TiZhuang W., ZhiMin Z., SuPing Y., 2011, Preparation of nano-structured Pt-YSZ composite and its application in oxygen potentiometric sensor, Applied
Surface Science, 257, p.7952-7958.
Chaugule S.S., Yezerets A., Currier N.W., Ribeiro F.H., Delgass W. N., 2010, Fast NOx storage
on Pt/BaO/γ-Al2O3 Lean NOx Traps with NO2+O2 and NO+O2: Effects of Pt, Ba loading,
Catalysis Today, 151(3–4), p.291-303.
Chen Y., Xia F., Xiao J., 2014, Effect of electrode microstructure on the sensitivity and response time of potentiometric NOx sensors based on stabilized-zirconia and La5/3Sr1/3NiO4–YSZ sensing electrode, Solid-State Electronics, 95, p.23-27.
Chen Y., Xiao J., 2014, Effects of YSZ addition on the response of La2CuO4 sensing electrode for a potentiometric NOx sensor, Sensors and Actuators B: Chemical, 192, p.730-736.
Chevallier L., Di Bartolomeo E., Grilli M. L., Mainas M., White B., Wachsman E. D., Traversa E., 2008, Non-Nernstian planar sensors based on YSZ with a Nb2O5 electrode, Sensors and
Actuators B, 129 , p.591–598.
Citepa 2010, Emission dans l’air en France Métropole - Substances relatives à l’acidification, l’eutrophisation et à la pollution photochimique, Centre Interprofessionnel Technique d’Etudes de la
Pollution Atmosphérique, 2010, (http://www.citepa.org).
Clayton R.D., Harold M. P., Balakotaiah V., Wan C.Z., 2009, Pt dispersion effects during NOx storage and reduction on Pt/BaO/Al2O3 catalysts, Applied Catalysis B: Environmental, 90(3–4), p.662-676.
Di Franco C, Elia A, Spagnolo V, Scamarcio G, Lugarà PM, Ieva E, Cioffi N, Torsi L, Bruno G, Losurdo M, Garcia MA, Wolter SD, Brown A, Ricco M., 2009, Optical and Electronic NO(x) Sensors for Applications in Mechatronics, Sensors (Basel), 9(5), p.3337-3356.
34
DiGiulio C.D., Pihl J. A., Parks II J. E., Amiridis M. D., Toops T. J., 2014, Passive-ammonia selective catalytic reduction (SCR): Understanding NH3 formation over close-coupled three way catalysts (TWC), Catalysis Today, 231, p.33–45.
Docquier N., Candel S., 2002, Combustion control and sensors: a review, Progress in energy and
combustion Science, 28, p.107-150.
EEA report, 2013, National emissions reported to the Convention on Long-range
Transboundary Air Pollution (LRTAP Convention) (http://www.eea.europa.eu).
Elumalai P., Miura N., 2005, Performances of planar NO2 sensor using stabilized zirconia and
NiO sensing electrode at high temperature, Solid State Ionics, 176(31–34), p.2517-2522.
Fergus J.W., 2011, Sensing mechanism of non-equilibrium solid-electrolyte-based chemical sensors review, Journal of Solid State Electrochemistry, 15, p.971–984.
Fischer S., Pohle R., Farber B., Proch R., Kaniuk J., Fleischer M., Moos R., 2010, Method for detection of NOx in exhaust gases by pulsed discharge measurements using standard zirconia-based lambda sensors, Sensors and Actuators B: Chemical, 147(2-3), p.780-785.
Fischer S., Pohle R., Magori E., Schönauer-Kamin D., Fleischer M., Moos R., 2012, Pulsed polarization of platinum electrodes on YSZ, Solid State Ionics, 225, p.371–375.
Gao J., Viricelle J-P., Pijolat C., Vernoux P., Boreave A., Giroir-Fendler A., 2011, Improvement of the NOx selectivity for a planar YSZ sensor, Sensors and Actuators B: Chemical, 154(2), p.106-110.
Gao, J., 2011 PhD Etude et mise au point d’un capteur de gaz pour la détection sélective de NOx en pot
d’échappement d’automobile. Thèse de doctorat. École Nationale Supérieure des Mines de
Saint-Étienne
Göpel W., Reinhardt G., Rösch M., 2000, Trends in the development of solid state amperometric and potentiometric high temperature sensors, Solid State Ionics, 136 –137, p.519 – 531.
Guillet N., Lalauze R., Viricelle J.P., Pijolat C., 2002, The influence of the electrode size on the electrical response of a potentiometric gas sensor to the action of oxygen, IEEE Sensors Journal, 2(4), p.349-353.
Hadjar A., Hernández W.Y., Princivalle A., Tardivat C., Guizard C., Vernoux P., 2011, Electrochemical activation of Pt–Ba/YSZ NOxTRAP catalyst under lean-burn conditions,
Chapter 1: State of art
35
Hill Brothers, 2010, Eco-DEF system (http://hillbrothers.com/eco-def).
Ishihara T., Sato S., Takita Y., 1995, Capacitive-type sensors for the selective detection of nitrogen oxides, Sensors and Actuators B: Chemical, 25(1–3), p.392-395.
Kobayashi N., Yamashita A., Naito O., Setoguchi T., Murase T., 2001, Development of Simultaneous NOx/NH3 Sensor in Exhaust Gas, Mitsubishi Heavy Industries, Ltd. Technical
Review, .38(3)
López-Gándara C., Fernández-Sanjuán J.M., Ramos F.M., Cirera A., 2012, Estimation of the electrodes’ three phase boundary sites in electrochemical exhaust gas sensors before and after electric polarization, Sensors and Actuators B: Chemical, 175, p.225-233.
Miura N., Lu G., Ono M., Yamazoe N., 1999, Selective detection of NO by using an amperometric sensor based on stabilized zirconia and oxide electrode, Solid State Ionics, 117(3– 4), p.283-290.
Miura N., Lu G., Yamazoe N., 1998, High-temperature potentiometric/amperometric NOx sensors combining stabilized zirconia with mixed-metal oxide electrode, Sensors and Actuators B:
Chemical, 52(1–2), p.169-178.
Miura N., Zhuiykov S., Ono T., Hasei M., Yamazoe N., 2002, Mixed potential type sensor using stabilized zirconia and ZnFeO4 sensing electrode for NOx detection at high temperature,
Sensors and. Actuators B, 83, p.222–229.
Mutoro E., Günther S., Luerßen B., Valov I., Janek J., 2008, Electrode activation and degradation: Morphology changes of platinum electrodes on YSZ during electrochemical polarisation, Solid State Ionics, 179(33–34), p.1835-1848.
Mutoro E., Koutsodontis C., Luerssen B., Brosda S., Vayenas C.G., Janek J., 2010, Electrochemical promotion of Pt(1 1 1)/YSZ(1 1 1) and Pt–FeOx/YSZ(1 1 1) thin catalyst films: Electrocatalytic, catalytic and morphological studies, Applied Catalysis B: Environmental, 100(1–2), p.328-337.
Nissan Motor Corporation, HC-NOx trap catalyst (http://www.nissan-global.com)
Ohtani N., Morita T., Endo M., Nanri K., Fujioka T., and Yamaguchi S., 2004, Development of NOx sensor system by using a mid-IR coherent light source for exhaust emission monitoring” in Conference on Lasers and Electro-Optics, International Quantum Electronics
Conference and Photonic Applications Systems Technologies, Technical Digest (CD) ,Optical Society of
![Figure 1.10: Output signal of zirconia based sensor as a function of O 2 fraction in N 2 at 550°C [Docquier 2002]](https://thumb-eu.123doks.com/thumbv2/123doknet/11418278.288715/24.918.240.622.221.515/figure-output-signal-zirconia-sensor-function-fraction-docquier.webp)