HAL Id: tel-02071262
https://tel.archives-ouvertes.fr/tel-02071262v2
Submitted on 20 Mar 2019HAL is a multi-disciplinary open access archive for the deposit and dissemination of sci-entific research documents, whether they are pub-lished or not. The documents may come from teaching and research institutions in France or abroad, or from public or private research centers.
L’archive ouverte pluridisciplinaire HAL, est destinée au dépôt et à la diffusion de documents scientifiques de niveau recherche, publiés ou non, émanant des établissements d’enseignement et de recherche français ou étrangers, des laboratoires publics ou privés.
for wireless IoT modules
Nikesh Man Shakya
To cite this version:
Nikesh Man Shakya. Design and development of energy-efficient transmission for wireless IoT mod-ules. Networking and Internet Architecture [cs.NI]. Université Paris-Saclay, 2019. English. �NNT : 2019SACLL001�. �tel-02071262v2�
NNT
:
2019SA
CLL001
Energy-efficient Transmission for Wireless
IoT Modules
Th `ese de doctorat de l’Universit ´e Paris-Saclaypr ´epar ´ee `a T ´el ´ecom SudParis Ecole doctorale n◦580 Sciences et technologies de l’information et de la communication (STIC) Sp ´ecialit ´e de doctorat : Informatique
Th `ese pr ´esent ´ee et soutenue `a Meudon, le 06/02/2019, par
N
IKESHM
ANSHAKYA
Composition du Jury :
M. Nazim AGOULMINE
Professeur, Universit ´e d’ ´Evry Val d’Essonne Pr ´esident M. Stefano SECCI
Professeur, CNAM Rapporteur
M. Naceur MALOUCH
Associate Professor, University Pierre et Marie Curie (UPMC) Rapporteur M. Nazim AGOULMINE
Professeur, Universit ´e d’ ´Evry Val d’Essonne Examinateur Mme. Maria POTOP-BUTUCARU
Professeure, Campus Pierre et Marie Curie Sorbonne Universit ´e - LIP6 Examinateur M. Noel CRESPI
Professeur, T ´el ´ecom SudParis Directeur de th `ese M. Mehdi MANI
II
I would like to express my sincere gratitude to all those people who made my thesis possible. I am indebted to them for their incessant supervision, valuable suggestions, support and motivation for completion of this Thesis.
First of all, I would like to express my genuine appreciation and gratitude to Dr. Mehdi Mani, who offered his continuous advice and encouragement throughout the course of this thesis and having a belief on me and giving me an opportunity to purse my PhD here at ITRON. I am also indebted to my thesis director Prof. Noel Crespi for his advice, constant suggestions and support. I truly appreciate his esteemed guidance and timely inspirations.
Also, I would also like to thank both HR of ITRON, Leticia Royere and HR of TSP Veronique Guy for their support and guidance in solving the tedious administrative works. I appreciate the hospitality received from ITRON lab and all my colleagues during my thesis.
With profound love and respect, I would also like to thank my wife Mrs. Niraja Shakya and my parents Mr. Narendra Man Shakya and Mrs. Durga Shakya for supporting me along the way with their love, moral and emotional support.
Lastly, my sincere thanks to all the others who availed me directly or indirectly throughout the thesis period.
Radio Transmission is one of the major sources of energy consumption in today's rising IoT devices in low powered and lossy networks. Device longevity has become the foundation of the IoT’s entire value proposition and is a key to unravel the next great wave of IoT. Transmission power and transmission bit-rate are the two radio parameters that principally impact the energy consumption along with the radio coverage, interference, link reliability, channel/spatial reuse etc. Transmitting at a constant high/low power or rate leads to an inefficient energy usage due to the varying, unstable and unpredictable radio links. Hence, the power/rate level should dynamically vary with such erratic radio conditions.
Transmission (TX) power/rate control algorithms for the constrained devices in IoT/WSN should have low overheads and must be energy efficient. They need to be adaptive and versatile to different environment conditions; yet be simple and easily implementable in the real sensor/IoT platform. Many dynamic Transmission Power and/or Rate Control algorithms have been proposed in the literature to economize the energy waste in the massive IoT deployments. But they fail to satisfy all these requirements alone. Each of them has its strengths and weaknesses. Therefore, there is a need of a new algorithm that performs an energy-efficient power and/or rate control which can be easily implemented in a real sensor platform.
This thesis presents REACT (Responsive Energy-efficient Adaptive Control of Transmission power and rate), a technique that considers more than one link quality information for better adaptation of TX power and rate. It has a self-learning, versatile and environment-adaptive control technique with a global aim to reduce the transmission energy consumption with insignificant compromise on the packet delivery ratio or throughput. It has least possible initial phase with zero overhead and has a responsive behavior that reacts appropriately to the varying radio conditions.
To attain this aim, we commenced with the study and the selection of a proper link quality estimation metric which is a crucial part in any power or rate control mechanism. ETX (Expected Transmission Count) from the sender-side and RSSI (Received Signal Strength Indicator) from receiver-side were used as a primary and a secondary metric respectively to provide multiple link information. Second, we designed and developed a responsive transmission power control at fixed bit-rate (REACT-P). We proved its efficiency comparing
IV
REACT or REACT-PR that offers higher energy savings by controlling both transmission power and rate.
We have evaluated our solutions using repetitive simulation and experimentation under both congested and un-congested environment. Simulation were performed in Cooja with TMote Sky motes whereas the experimentations were performed in Itron IoT device hardware compliant with IEEE802.15.4. The test results showed that, comparing to CPCR and REACT-P, with similar packet delivery ratio, REACT consumes much less energy, reduces interference, channel occupancy and aids to prolong the device lifetime. Even in the worst case, where all nodes transmit at the same time, the improvement in total energy consumption was 58% with REACT and 29% with REACT-P compared to CPCR. The nodes closer to the sink gain lifetime maximally than those farther away. The results also reveal that the improvement in the energy consumption improves with the decrease in the concurrent transmissions.
Although the scope of the algorithm was designed for the battery-operated devices, it is equally applicable to mains line powered devices as well as it can aid in reducing interference, channel occupancy and improve the throughput and latency
La transmission radio est une des principales sources de consommation d’énergie des objets connectés dans les réseaux IoT. La durée de vie des objets IoT est le facteur principal qui permet le développement massif d’une solution IoT. La puissance de transmission et le débit binaire de transmission sont les deux paramètres radio qui affectent principalement la consommation d'énergie avec la portée radio, le brouillage, la fiabilité des liaisons et la réutilisation des canaux/de l'espace. Les conditions variables des liaisons radios nécessite que le niveau de puissance/débit varie de manière dynamique pour s’aligner à de telles conditions instables.
Les algorithmes de contrôle de puissance/débit de transmission (TX) ne doivent pas poser des charges supplémentaires pour qu’ils soient applicable pour les appareils IoT avec des ressources d’énergie limitées. Ils doivent être adaptables et polyvalents aux différentes conditions environnementales et de l’autre côté, être simple et facilement implémentable dans les plateformes capteur/IoT. De nombreux algorithmes dynamiques de transmission de puissance et / ou de contrôle de débit ont été proposés dans la littérature pour économiser la consommation d'énergie. Mais ils ne parviennent pas à satisfaire toutes ces exigences. Chacun d’entre eux a ses forces et ses faiblesses. Par conséquence, il existe le besoin d'un nouvel algorithme qui effectue un contrôle de puissance et / ou de débit qui peut être facilement implémenté dans une véritable plateforme de réseau IoT.
Cette thèse présente REACT (Responsive Energy-efficient Adaptive Control of Transmission), une technique qui prend en compte plus d'une information de qualité de liaison pour une meilleure adaptation de la puissance et du débit TX. Il dispose d'une technique de contrôle à auto-apprentissage, polyvalente et adaptative pour l'environnement, avec un objectif global de réduction de la consommation d'énergie de transmission tout en maintenant une fiabilité similaire. Il possède la phase initiale la plus légère possible avec une surcharge nulle et un comportement réactif qui réagit de manière appropriée aux variations des conditions radio.
Pour atteindre cet objectif, nous avons commencé par l'étude et la sélection d'une métrique d'estimation de la qualité de la liaison qui constitue un élément crucial de tout mécanisme de contrôle de la puissance ou de la vitesse. ETX (nombre de transmissions prévu) du côté de l'expéditeur et RSSI du côté du récepteur ont été utilisés respectivement comme métrique
VI
binaire fixe (REACT-P). Nous avons prouvé son efficacité en comparant l'utilisation de la puissance constante maximale à débit constant (CPCR) et l'un des algorithmes existants dominants. Troisièmement, cette conception est élargie en ajoutant l’option d’adaptation de débit donnant lieu à REACT ou REACT-PR qui permet de réaliser des économies d'énergie plus importantes en contrôlant à la fois la puissance et le débit.
Nous avons évalué nos solutions en utilisant à la fois la simulation et l'expérimentation dans les environnements encombré et non encombré. Les résultats des tests ont montré que, comparé à la CPCR et REACT-P, avec un taux de livraison de paquets similaire, REACT consomme beaucoup moins d'énergie, réduit les interférences, l'occupation des canaux et contribue à prolonger la durée de vie de l'appareil. Même dans le pire des cas, où tous les nœuds transmettent en même temps, l’amélioration de la consommation totale d’énergie était de 58% avec REACT et de 29% avec REACT-P par rapport à CPCR. Les nœuds les plus proches de point d’accès gagnent le maximum de durée de vie par rapport de ceux plus éloignés. Les résultats montrent également que l'amélioration de la consommation d'énergie diminue avec l'augmentation de nombre de transmissions simultanées.
I. Acknowledgement ... II II. Abstract ... III III. Abstract French ... V IV. Table of Contents ... VII V. List of Figures ... XI VI. List of Tables ... XIV VII.List of Abbreviations ... XV
1. Introduction ... 1
1.1 Internet of Things (IoT) ... 3
1.1.1 Background ... 3
1.1.2 IoT Predictions ... 5
1.1.3 Various Applications of IoT ... 8
1.1.4 An IoT Device ... 10
1.1.5 IoT Open Standard Protocol Stack ... 12
1.1.6 Power Sources for IoT Devices: A Big challenge ... 14
1.1.7 Energy Consumption in IoT: A Taxonomy ... 17
1.2 Thesis Motivation and Scope ... 18
1.3 Content of PhD ... 20
1.3.1 Research Objectives and Contributions ... 20
1.3.2 Structure of Thesis ... 22
2. Link Quality Estimation ... 25
2.1 Radio Link Quality ... 27
2.2 Signal-Based ... 28
2.2.1 RSSI ... 29
2.2.2 LQI ... 29
VIII
2.3.1 Number of Neighbors ... 31
2.3.2 PRR ... 31
2.3.3 ETX ... 31
2.3.4 ETT ... 32
2.4 State of art and Review on signal and statistics-based metrics ... 32
2.4.1 Comparing Signal-based and Statistics based Metrics ... 33
2.5 Choice of Link Quality Metric ... 34
2.6 Conclusion ... 35
3. Transmission Power Control (TPC) ... 37
3.1 Introduction ... 39
3.1.1 Impacts of Transmission Power ... 39
3.1.2 Key Concept of TPC ... 40
3.1.3 Different Levels of TPC ... 41
3.1.4 Fundamental Blocks of TPC ... 42
3.1.5 Link Quality Estimation (LQE) ... 42
3.1.6 Control Mechanism ... 42
3.1.7 General Drawbacks of TPC Algorithms ... 43
3.2 Literature Review ... 44
3.3 Proposed Algorithm: REACT-P ... 46
3.3.1 Working Principle ... 46
3.3.2 REACT-P Block Diagram ... 50
3.3.3 Novelty ... 55
3.4 Implementation ... 56
3.4.1 Assumptions ... 58
3.4.2 Calculation of Transmission Time ... 58
3.5 Performance Metrics ... 61
3.5.1 Network TX Energy Consumption ... 61
3.5.2 PDR ... 61
3.5.3 Average TX Energy Consumption per Frame ... 62
3.6 Simulation ... 62
3.6.1 Setup ... 64
3.6.2 Parameters ... 64
3.6.3 Results and Discussions ... 66
3.7 Experimentation ... 71
3.7.1 Setup ... 71
3.7.2 Parameters ... 72
3.7.3 Results and Discussions ... 74
3.8 Conclusion ... 82
4. Transmission Rate Control ... 83
4.1 Introduction ... 85
4.1.1 Impacts of Transmission Bit Rate ... 86
4.2 Literature Review ... 88
4.3 Calculation of Transmission Time ... 90
4.4 Experimentation ... 90
4.4.1 Transmission Time ... 90
4.4.2 Experimentation at different TX Bit-Rates ... 92
4.5 Conclusion ... 93
5. Transmission Power and Rate Control ... 94
5.1 Introduction ... 96
5.2 Literature Review ... 97
X
5.4 Performance Metrics ... 100
5.4.1 CCA Busy Count ... 100
5.4.2 Network Lifetime ... 101
5.4.3 Standard Deviation Error ... 101
5.5 Implementation ... 102
5.5.1 Initializing the Control Mechanism... 102
5.5.2 Setting the Energy Level Array ... 102
5.5.3 Calculation of Remaining Lifetime of a Node ... 104
5.6 Experimentation... 106
5.6.1 Parameters ... 106
5.6.2 Environment ... 107
5.6.3 Results and Discussion ... 108
5.7 Conclusion ... 119
6. Conclusion and Future Works ... 121
6.1 Conclusion ... 123
6.2 Future Works ... 125
7. Publications ... 127
8. References ... 129
9. Appendices ... 137
Appendix-A: Related Figures... 137
Appendix-B: Sorted Energy level array in the ascending order ... 137
Figure 1-1: IoT Landscape ... 3
Figure 1-2: Number of connected devices from 2015 to 2025 [10] ... 6
Figure 1-3: Number of battery powered IoT devices [12]... 6
Figure 1-4: Global share of IoT projects and trends [15] ... 7
Figure 1-5: Consumer and Bussiness IoT platforms [16] ... 7
Figure 1-6: Worldwide IoT Application Enablement and Device Management Platform Revenue [13]... 8
Figure 1-7: Block diagram of a typical IoT device ... 11
Figure 1-8: Open wireless standard reference model for IoT ... 12
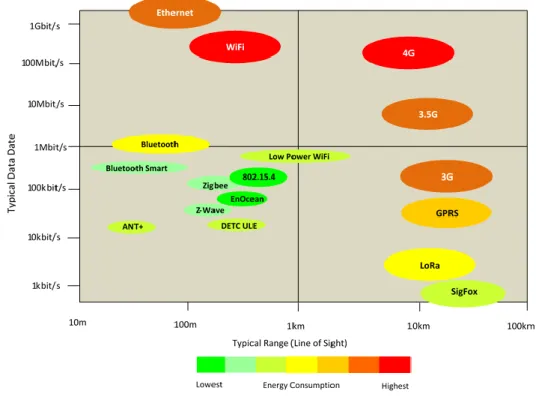
Figure 1-9: Tradeoffs in various IoT enabling communication technologies ... 14
Figure 1-10: Various energy saving techniques for WSN/IoTs ... 18
Figure 1-11: Research objectives addressed in each chapters ... 23
Figure 2-1: Various link quality metrics from various OSI layers ... 28
Figure 3-1: Key concept of transmission power control (TPC) ... 40
Figure 3-2: Fundamental blocks of TPC ... 42
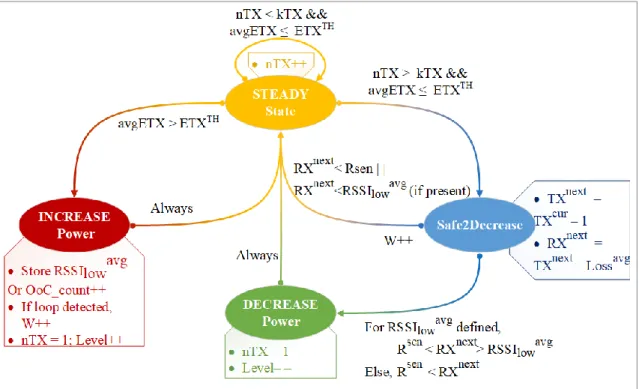
Figure 3-3: Finite state transition diagram for REACT-P in run-time phase ... 48
Figure 3-4: REACT-P block diagram ... 51
Figure 3-5: Placement of REACT-P block in the IoT netstack ... 57
Figure 3-6: Live tool showing network metrics ... 60
Figure 3-7: Live tool showing power related metrics... 61
Figure 3-8: Two simulation test networks ... 64
Figure 3-9: The % improvement in TX energy consumption at different distances and PSR ... 67
Figure 3-10: Throughput and PDR at different distances at 60% PSR ... 67
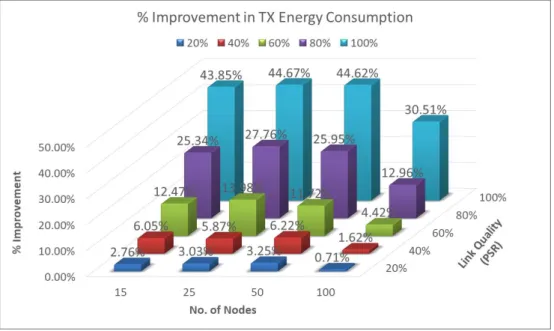
Figure 3-11: The % improvement in TX energy consumption for different numbers of nodes and link quality levels ... 68
Figure 3-12: Network Throughput and PDR at different PSR ... 69
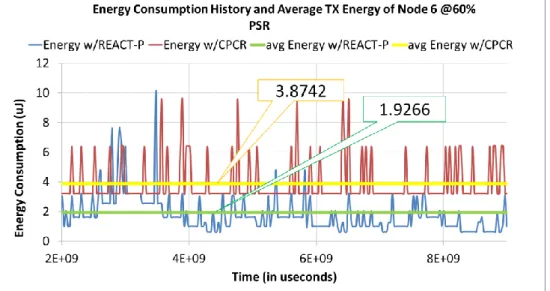
Figure 3-13: Node 6's TX Energy consumption history and its average for a 25-node environment at 60% PSR ... 69
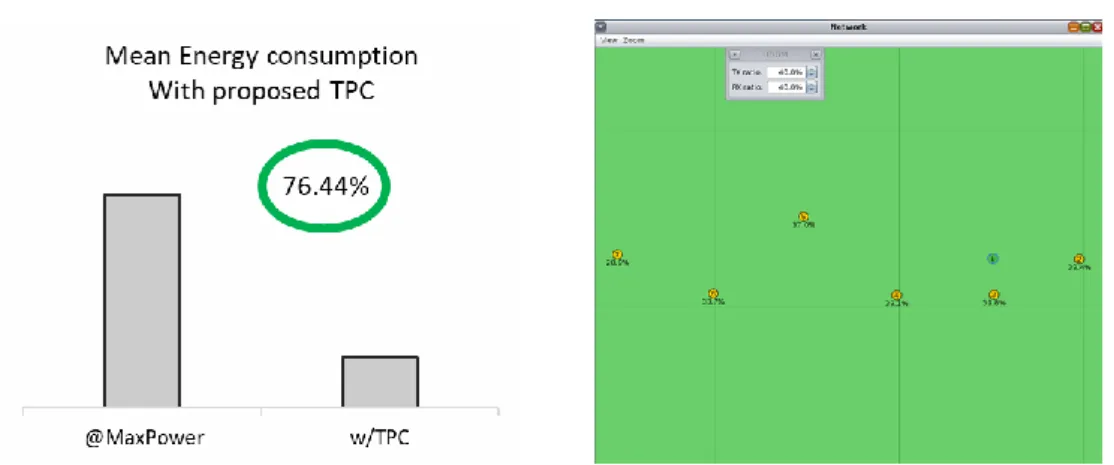
Figure 3-14: Mean energy consumption of ODTPC (left) and experimental setup (right) [64] ... 70
XII
Figure 3-16: Itron wireless IoT Module ... 71
Figure 3-17: Experimentation floor deployment plan I ... 72
Figure 3-18: Transmission Power Amplifier Control Register for ATRF215 Tranceiver .. 73
Figure 3-19: Circuit connection to measure the current ... 74
Figure 3-20: Current consumption at different power levels for ATRF215 ... 74
Figure 3-21: Timeline showing transmitting in different time slots (TSN) ... 76
Figure 3-22: Received Signal Strength (RSSI) of all clients over time ... 77
Figure 3-23: ETX and EWMA_ETX for a case of 2/7 at CPCR ... 78
Figure 3-24: Average energy consumed per frame and % Improvement in Total TX Energy ... 79
Figure 3-25: Total frame losses and PDR in a network ... 80
Figure 3-26: Average TX Energy consumed per client ... 81
Figure 3-27: Total TX Energy consumption of the clients ... 81
Figure 3-28: Client 8 adapting power over time with EWMA ETX with REACT-P ... 82
Figure 4-1 : Format of the MR-O-QPSK PHY PPDU ... 85
Figure 4-2: Format of the PHR for MR-O-QPSK ... 85
Figure 4-3: Rate Mode mapping for MR-OQPSK @100Kchips/sec ... 85
Figure 4-4: Reference Modulator diagram for MR-OQPSK [30] ... 86
Figure 4-5: Trade off between data rate, distance, SNR, and range [77] ... 88
Figure 4-6: Experimental PPDU frame duration for 142B MPDU frame at different rate modes ... 91
Figure 4-7: Agilent EXA Signal Analyzer in lab ... 92
Figure 4-8: Average network energy consumption and Total CCA busy counts at different bit-rates for the case of 2/7(a) and 4/7(b) ... 93
Figure 5-1: Tradeoffs in LLNs or LPWANs ... 96
Figure 5-2: Estimated Remaining Life Time (ERLT) calculation ... 105
Figure 5-3: REACT deployment plan ... 108
Figure 5-4: Average Energy consumed per unique frame received for CLient 7 at different rates and attenuation ... 109
Figure 5-5: PDR of client 7 at defferent rates and attenuation ... 109
Figure 5-6: Average network energy consumption and % improvement of REACT and REACT-P ... 112
Figure 5-9: Network lifetime when different % of nodes are dead ... 114
Figure 5-10: Total CCA busy counts in a network ... 115
Figure 5-11: Energy consumed per TX frame for the case of 5/7 ... 116
Figure 5-12: Total TX energy consumption per node ... 117
Figure 5-13: PDR per Node ... 117
Figure 5-14: Average Network Energy consumption and % improvement w.r.t. CPCR for different constant rates for 2/7 case. ... 118
Figure 5-15: Total CCA busy counts at different rates ... 119
Figure 9-1: Snapshot of COOJA simulator ... 137
Figure 9-2: FLowchart for initializing the control mechanism ... 140
Figure 9-3: Setting up energy level array ... 141
Figure 9-4: Flowchart to compare the energy levels used by qsort ... 142
Figure 9-5: Main function of Transmission power and rate control algortihm for REACT ... 146
Figure 9-6: Flowchart showing the bootstrap phase ... 148
Figure 9-7: Flowchart for calculating the ETT ... 149
Figure 9-8: Flowchart for calculating TX Energy consumption ... 149
Figure 9-9: Flowchart for claculating the path loss ... 150
Figure 9-10: Flowchart showing BEW Mechanism ... 150
Figure 9-11: Flowchart for the actions for increasing the power/energy level ... 151
Figure 9-12: Flowchart showing the process for decresing the power/energy level ... 152
Figure 9-13: Flowchart showing process for keeping the same level ... 152
Figure 9-14: Flowchart showing safe2Decrease Module ... 153
Figure 9-15: Flowchart showing out_of_coverage detection mechanism ... 154
Figure 9-16: Flowchart to update the last stable energy/power level ... 155
XIV
Table 1-1: Various applications of IoT ... 8
Table 1-2: Various power sources choices for IoT devices ... 16
Table 2-1: Comparison table between Signal-based and Statistics-based link quality metrics ... 33
Table 3-1: Existing packet level TPC algorithms ... 44
Table 3-2: REACT-P Algorithm Parameters ... 57
Table 3-3: Algorithm parameters for Simulation ... 64
Table 3-4: REACT-P Simulation Parameters ... 65
Table 3-5: CC2420 Output power settings and typical current consumption @ 2.45GHz [47] ... 65
Table 3-6: Algorithm parmeters for experimentation ... 72
Table 3-7: REACT-P Experimentation Parameters ... 72
Table 3-8: Different settings for controlling the output power in ATRF215 transceiver ... 73
Table 3-9: Client IDs involved with different setup for REACT-P Test ... 75
Table 4-1: Different receiver sensitivities at different rate modes for MR-OQPSK ... 87
Table 4-2: Existing transmission rate control algorithms ... 88
Table 4-3: Calculated and Experimental frame duration at different rates ... 91
Table 5-1: Existing transmission power and rate control algorithms... 97
Table 5-2: TX Energy consumed (µJoules) for different combination of power and rate levels ... 103
Table 5-3: Calculation of Remaining life time of Client 7 ... 105
Table 5-4: Experimental parameters for one-sink-one-client setup ... 106
Table 5-5: Experimental parameters for 7 clients star topology setup ... 107
Table 5-6: Approximate distance of clients from sink for REACT deployment plan ... 108
Table 5-7: Client IDs involved with different setup for REACT Test ... 110
Acronym Full Form AC : Alternating Current
ACK : Acknowledgement
AIAD : Additive Increase Additive Decrease AIMD : Additive Increase Multiplicative Decrease
BER : Bit Error Rate
BEW : Binary Exponential Window CCA : Clear channel Assessment
CoAP : Constrained Application Protocol COOJA : COntiki Os Java
CoRE : Constrained RESTful Environment CPCR : Constant Power at Constant Rate CSMA : Carrier Sense Multiple Access
CSMA/CA : Carrier Sense Multiple Access/ Collision Avoidance CTS : Clear To Send
dB : Decibels
DBR : Discovery Beacon Request DC : Direct Current
DGRM : Directed Graph Radio medium EB : Enhanced Beacon
ERLT : Estimated Remaining Life Time
ETSI : European Telecommunication Standard Institute ETT : Expected Transmission Time
ETX : Expected Transmission Count
EWMA : Exponential Weighted Moving Average HTTP : Hyper Text Transfer Protocol
IEEE : Institute of Electrical and Electronics Engineering IETF : Internet Engineering Task Force.
IoT : Internet of Things
LLN : Low Powered and Lossy Network LoRA : Long Range
XVI LSL : Last Stable Level
M2M : Machine to Machine
MAC : Medium Access Control Layer MPDU : MAC Protocol Data Unit MR-OQPSK : Multi-Rate-OQPSK
ODTPC : On Demand Transmission Power Control OQPSK : Offset Quadrature Phase Shift Keying
OSI : Open System Interconnection PAR : Packet Acknowledgement Rate PCB : Printed Circuit Board
PDR : Packet Delivery Ratio PER : Packet Error Ratio PHY : Physical Layer
PPDU : PHY layer Protocol Data Unit PRR : Packet Reception Ratio
PSDU : Physical layer Service Data Unit PSR : Packet Reception Success Ratio
REACT : Responsive Energy-efficient Adaptive Control of Transmission
Power and Rate
REACT-P : Responsive Energy-efficient Adaptive Control of Transmission
Power
REACT-PR : Responsive Energy-efficient Adaptive Control of Transmission
Power and Rate
RF : Radio Frequency
RISC : Reduced Instruction Set Computing
ROLL : Routing Over Low powered and Lossy Network RPL : IPv6 Routing Protocol for LLNs
RSSI : Receive Signal Strength Indicator RTS : Request To Send
RX : Reception
SLP : Sleep/ideal state SNR : Signal to Noise Ratio TCP : Transport Control Protocol TPC : Transmission Power Control TSCH : Time Slotted Channel Hopping
TSN : Time Slot Number TT : Transmission Time TX : Transmission
UDP : User Datagram Protocol
Wi-SUN : Wireless Smart Ubiquitous Network WLAN : Wireless Local Area Network
1. Introduction
Contents
1.1 Internet of Things (IoT) ... 3
1.2 Thesis Motivation and Scope ... 18
1.1 Internet of Things (IoT)
1.1.1 BackgroundThe Internet of things (IoT) builds the potential for a world in which physical objects can communicate with one another or with humans intelligently and react with respect to the changes in the surrounding and become active participants in this smart world. Kevin Ashton first used the term Internet of Things in 1999 [1]. The number of connected things went increasing and in 2008, this number was greater than the people living on earth. Availability and affordability of such devices grow every year. Today, IoT is not only a technology but has also become an ecosystem. This technology has been existing for few decades but were not working together. With the advent of cheaper processing power, low power radio transceiver hardware, communication costs and some marketing, these forces have molded the IoT of today. Billions of gadgets/devices will gather data/information from nearly everything and, practically everyone. Almost any device with electronic components can be shaped for the IoT, and in the next five years, more will.
Raun has described IoT as: “A world where the real, digital and the virtual are converging
to create a smart environment that make energy, transport, home, industries, cities and many other areas more intelligent” [2].
Figure 1-1: IoT Landscape
Figure 1-1 shows an IoT landscape including but not limited to implementation of IoT devices. IoT helps in modernizing infrastructure and improving operations, enhancing
Shakya, Nikesh Man Introduction
efficiency and cost savings, business transformation services for more value-added services to consumers. The rise of the Internet of Things (IoT) is the most important advancement in the growing evolution of the smart world. The number of connected devices is increasing exponentially. As the next 10 billion IoT devices come online, the industry will face some challenging encounters, such as ensuring the device security, powering billions of sensors, etc.
IoT solutions can be divided into different categories based on their: i) Communication Technology ii) Network Topology and iii) Open-Standard stack versus proprietary solutions. Various communication technologies offer communication solutions for IoT devices, for example: Cellular Communication, Wired Networks, and RF Wireless networks (such as IEEE 802.15.4, Wi-Fi, NFC, Bluetooth)
In the last decade, star topology, combined with long range RF technology based on a proprietary network stack has been the mainstream solution deployed to harvest sensor data. In this solution, very similar to cellular networks, a gateway is installed on top of a pole, tower or a high-rise. To achieve long-distance coverage, low bit-rate RF technologies (in the order of 100 bits per second) are embedded in the gateway and at the endpoints. The communication may be unidirectional or bidirectional.
In parallel, there have been considerable advances in meshed sensor networking. Meshed topology provides scalability, self-healing, low powered, flexibility, reliability and reduced network infrastructure cost. Moreover, short-range RF technologies with much higher bit-rates (more than 100kbits/s) can be deployed in this topology. This means more real time data is collected and more service options can be offered.
Proprietary protocol stacks, tailored for various IoT applications, while usually robust and efficient, when it comes to their interoperability and openness to other systems, they limp. To unravel this issue, many standardization activities in IETF (Internet Engineering Task Force), IEEE and ETSI (European Telecommunications Standards Institute) are in process to provide open standard solutions[3]–[8]. There are dedicated alliances such as Wi-SUN which “promotes the adoption of open industry standards in wireless smart utility networks” [8]. Wi-SUN network is developed as per IEEE Standard 802.15.4e/g [5], [6] that defines PHY and MAC layer specifications. This permits multi-vendor products to interoperate seamlessly.
IPv6, together with wireless mesh, offers some ready solutions for large scale, low power and lossy sensor networks. IP-based devices can connect easily with existing IP networks, providing end to end connectivity. Recent advances in communications have made the IPv6 protocol possible and efficient for the use in Low Powered and Lossy Networks (LLNs) that are constituted by devices compatible with the IEEE802.15.4 standard.
1.1.2 IoT Predictions
Forecasting the future is not an easy task. There have been different estimates and forecasts from different firms depending on their own definition of IoT. Popular IoT forecast by Cisco of 50 Billion Devices by 2020 has been outdated [9]. According to IHS, It has been forecasted that the number of connected devices will grow from an installed base of 17 billion in 2016 to 125 billion in 2030 [10]. According to Machina Research [11], in August 2016, 11% of the connections in 2025 will use Low Power Wide Area (LPWA) connections. In [12], it has been roughly estimated that there will be around 23 billion battery operated IoT devices in 2025 as shown in Figure 1-3. With the involvement of battery, device lifetime would be a major challenge.
According to MachNation forecast data, 2018 [13] , IoT platform revenue will grow 89% in 2018. MachNation forecasts that IoT platform revenue in 2018 will reach USD3.3 billion to USD 64.6billion by 2026 (Figure 1-6). According to I-scoop, IoT spending is forecasted to surpass the $1 trillion mark in 2020 [14].
Figure 1-4 shows the top ten IoT segments based on 1600 real IoT projects in 2018 excluding the consumer IoT projects, done by IoT Analytics in January, 2018 [15]. IIoT (Industrial IoT) platforms is taking the lead in the IoT platform market as most platforms focus on industrial segments says IoT Analytics [16] as shown in Figure 1-5.
Shakya, Nikesh Man Introduction
Figure 1-2: Number of connected devices from 2015 to 2025 [10]
Figure 1-4: Global share of IoT projects and trends [15]
Shakya, Nikesh Man Introduction
Figure 1-6: Worldwide IoT Application Enablement and Device Management Platform Revenue [13]
1.1.3 Various Applications of IoT
The applications of IoT are increasing day by day. From a small pill to big airplanes, simple smart kettles to complex man-less vehicles, everything has become a part of IoT. Table 1-1 lists some of the applications of IoT that are compiled from various sources [12], [15], [17]– [20].
Table 1-1: Various applications of IoT
Application Area Application Edge Device Power
Source
Smart Home
Home Automation Smoke sensors, window Battery
Smart Lighting Smart LED bulb, gateway
Mains
Smart Appliances
Washing machine, dish cleaner, coffee machine, refrigerator, etc.
Mains
Health Care Physical activity monitoring
Activity tracker, wearable devices
Battery
Sleep monitoring Sleep sensor Battery Dental health Electrical toothbrush Battery Emergency notification Emergency tag(watch) Battery Fall detection Fall sensor Battery Nutrition monitoring Smart cup Battery
Smart Grid Metering application Smart gas/water meter Battery
Electric meters Mains
Smart mobility
Smart roads Sensors in road Battery
Car-to-car communication Various devices in the car
On-board
Smart Logistic
Product tracking/Item
location RFID tag
Battery
Quality of storage, shipment
and condition monitoring Dedicated sensors
Battery
Smart Agriculture
Cattle monitoring/tracking RFID tag, GPS transceiver
Battery
Irrigation monitoring Dedicated sensors Battery Green Houses Dedicated sensors Battery
Smart City
Smart street lighting Street lights Mains Smart parking Sensors in parking lot Battery Air-quality Monitoring Dedicated Sensors Battery
Smart Security
Intrusion detection Door, window sensors, smoke sensors,
Battery
Perimeter Access Control Presence sensors, proximity
Battery
Explosive and hazardous
gases/ radiation Dedicated sensors
battery
Smart
Environment monitoring
Air/Water quality
monitoring Dedicated sensors
Battery
Flood monitoring Dedicated sensors Battery Forest fire monitoring Dedicated sensors Battery Landslide/avalanche
prevention Dedicated sensors
Shakya, Nikesh Man Introduction
Earthquake early detection Dedicated sensors Battery Snow level/ Glacier
monitoring Dedicated sensors
Battery
Underwater sensor networks
Aquatic life tracking/
sensing Dedicated sensors
Battery
Underground
sensor networks Dedicated sensors
Battery
With an extensive range of IoT applications, a multitude of power source requirements come into play. Home appliances and industrial automation equipment both traditionally are connected to mains lines, making power readily available. Other applications which are deployed in unfavorable areas inconvenient for mains line power generates a necessity for autonomous power sources. It is obvious from the table above that, many IoT applications require the edge devices to run on battery. More details on this challenge on powering the IoT devices is explained in sub-section 1.1.6.
1.1.4 An IoT Device
Figure 1-7 shows a general block diagram of an IoT/Sensor Device. Processing platform may include one or more processors/chips, memory, one or more secondary storages, one or more input/output ports or devices. One of more communication interfaces may provide wired or wireless communication. It includes a power supply sub-system that may be mains line powered or battery powered. With the speedy advancement in IoT, it is important to remember that the key drivers behind IoT are the sensors, actuators and transceivers. In order to create smarter cities and smarter homes, edge intelligence is critical, without which, IoT would not scale. It would be beneficial by bringing some intellegence at the edge so that billions of IoT devices may be able to make their own decisions locally for various cases thereby reducing traffic and latency for making decisons. A connected object or thing can have few or thousands of sensors and actuators. Connected sensors and actuators have become the heart of IoT applications. They are giving our world a digital nervous system [18].
Figure 1-7: Block diagram of a typical IoT device
Sensors and actuators exist since long before the IoT in its current meaning and are ubiquitous in, for example, buildings, factories, energy and much more [18]. A sensor is a device that senses, detects, measures or specifies any physical quantity such as light, heat, sound, presence, pressure, motion, moisture, or similar entities, by converting them into any other form most being electrical pulses. As the sensors are basically the first source to capture raw data, it is clear that sensors are crucial IoT components and need to provide precise information but with strict power budget constraints. Actuators are just like sensors. While sensors sense, actuators act. They are there to trigger some actions in the physical world. In order to create a connected IoT network, the transceivers communicate to one another. As a basic home example, a sensor senses the occupancy of the room and the temperature and depending on control/management system, the actuator turns on/off the air-conditioning providing electricity savings.
The hardware together with software and external factors, such as the environment and the interaction with the network, dictate the power profile drain of each node [21]. Internet of Things (IoT) devices are supposed to be deployed 'everywhere' and to be accessed 'any time' from 'anywhere' [22]. Many of these devices perform control and monitoring tasks in the smart-x applications and hard to access or inconvenient areas. For successful realization of such applications, an IoT device should be tiny and autonomous while including sensing/actuating, processing and wireless communications capabilities. These limitations and simple requisites infer strict requirements for the energy storage and power management
PROCESSOR(s)
SECONDARY STORAGE DEVICES(s)
SENSOR(s)/ ACTUATOR(s) DEVICE(s) COMMUNICATION SYSTEM/ INTERFACE POWER SUPPLY MEMORY INPUT(s)/ OUTPUT(s) EXTERNAL MEMORY DATA PROCESSING LOGIC
Shakya, Nikesh Man Introduction
of IoT devices to ensure their perpetual operation, given neither cable-power nor battery replacement are suitable options in those conditions, or simply because of convenience (quick "cable-free" and "no maintenance" installations are very tempting indeed).
1.1.5 IoT Open Standard Protocol Stack
There are many proprietary protocols in IoT to tackle the various challenges in the IoT. But when it comes to the concept of interoperability, they linger. Proprietary solutions suffer from vendor-locking. Although various alliances support these proprietary solutions, such as LoRA (Long Range) [23] , M2M (Machine to Machine) [7], Sigfox [24], Zigbee [25] Alliances but most of them are not standardized. It was predicted that by 2018, the “open data platform” will be emerged as the next frontier in IoT domain [19]. Wi-SUN (Wireless Smart Ubiquitous Networks) [8] is an alliance that promotes open standards. The following Figure 1-8 shows the protocol stack for a constrained IoT environment which are based on open standards.
Figure 1-8: Open wireless standard reference model for IoT
The following sub-sections explain briefly about the various layers of the stack.
1.1.5.1 Application Layer
CoAP (Constrained Application Protocol), is a light-weight Web Transfer Protocol, standardized by IETF Constrained RESTful Environment (CoRE) in RFC 7252 [26]. It is specially designed for constrained devices and constrained networks for Internet of Things.
Transport Layer: UDP
IPv6 Routing: RPL
6LoWPAN Adaptation Layer Application 1 ICMPv6 MAC and PHY NET Layer: IPv6 (if needed)
Application Application 2 Application N
IEEE
802.15.4e Non IEEE 802.15.4
(Bluetooth Low Energy, WiFi, NFC, Cellular) IEEE 802.15.4g C om m un ic ati on P ro fi le
It can be transparently mapped to the HTTP (Hyper Text Transfer Protocol). CoAP runs on UDP (User Datagram Protocol) and has methods like GET, POST, PUT, and DELETE. It uses small and reduced set of headers.
1.1.5.2 Transport Layer
IoT devices mainly employ TCP (Transport Control Protocol) or UDP. As implementation of TCP is complex, it is difficult to employ on resource constrained devices like sensors. Hence, most of the IoT applications are better-suited with UDP protocols, which is much faster than TCP and have lower overheads. But UDP being connection-less protocol, it may need to be combined with application layer to improve its reliability.
1.1.5.3 Network Layer
This layer defines the overall routing of the data packets. It supports IPv6. IETF (Internet Engineering Task Force) RPL (Internet Engineering Task Force IPv6 Routing protocol for low power and lossy Networks, RFC 6550 [27] ) from working group ROLL [3] is used as a routing protocol. In order to accommodate the large IPv6 packets over 802.15.4 MAC/PHY frames, 6LowPAN (IPv6 over Low Power Wireless Personal Area Network, RFC 4944 [28]) is used as an adaptation layer that provides encapsulation and header compression techniques. In the scope of this thesis, routing is not taken into account as the tests were performed on a Star network with a single sink.
1.1.5.4 PHY/MAC Layer
IEEE 802.15.4 is a standard for wireless communication between devices in constrained environment (low data rate, lossy) with limited resources (memory, power, bandwidth). It is standardized by IEEE similar to IEEE 802.11 for Wi-Fi or IEEE 802.3 for Ethernet. IEEE 802.15.4e [29] and IEEE 802.15.4g [30] are the enhanced MAC and PHY layers respectively based on IEEE 802.15.4 Standard.
This thesis mainly focuses on these two layers. In this research, we will be using IEEE 802.15.4e/g as the MAC/PHY layer. This PHY layer supports the rate and multi-regional Offset Quadrature Phase Shift Keying (MR-OQPSK) PHY. The MAC layer IEEE 802.15.4e supports Time Slotted Channel Hopping (TSCH) and Carrier sense Multiple Access with collision avoidance (CSMA/CA) techniques.
Shakya, Nikesh Man Introduction
Besides these, the protocols may consist of other technologies such as IEEE 802.11 Wi-Fi, 2G/3G/LTE/Cellular, Bluetooth Low Energy, Satellite, etc. Each of these technologies has its tradeoffs in terms of power consumption, range and bandwidth as shown in Figure 1-9.
Figure 1-9 illustrates the relative standby energy consumption of various wireless communication technologies (as well as Ethernet) and their typical data transfer rates and communication ranges. From this figure, it can be perceived that higher data rates and longer ranges tend to equate to higher standby energy consumption.
Figure 1-9: Tradeoffs in various IoT enabling communication technologies
1.1.6 Power Sources for IoT Devices: A Big challenge
Any electrical/electronic device requires power in order to operate. There are numerous potential alternatives for powering the devices [31], depending on the use case: nearby AC line, available DC line, energy harvesting and battery. There are basically 4 ways or their combination to power IoT devices.
1.1.6.1 AC Line:
Alternating Current (AC) line can provide unlimited power as required by the device and hence may seem to be the easiest choice. But the problem is that it requires the device to remain closer to the source and thus limits the portability/mobility of the IoT device. Also, there is a need of an AC/DC converter. These converters are large in size and expensive. A small AC/DC circuit can be built on-board on the IoT PCB (Printed Circuit Board) but this gives rise to safety and regulatory-approval issues due to the presence of direct line voltage, in addition to the cost and the size burden.
1.1.6.2 DC Line:
DC line can be a good choice if an IoT device is to be used near it such as in a home appliance. It is because a simple on-board DC/DC converter can be small in size, low-cost and reliable. It is necessary to ensure that the IoT device is able to consume the current from the DC line when it needs. This option also requires the IoT device to remain close to the source. Hence, although inline DC power sources are constant, they are often impractical in many instances.
1.1.6.3 Energy Harvesting:
Energy Harvesting is often a very good option, as it can be a hassle-free, moderate-cost and almost "free-ride" source. The three common harvested power sources include thermoelectric (thermopiles, thermo couples), kinetic or vibration (piezo), and photovoltaic (solar) systems. Unfortunately, energy harvesting is often impractical because there is no reliable or consistent source of energy to be scavenged, as some IoT devices are placed in dark and/or quiet places where the energy cannot be easily scavenged. This technology is not mature enough in terms of size and cost at this time. As they scavenge the energy from the ambient sources which are influenced by the weather conditions, energy harvesting devices cannot generate sufficient energy in a nonstop active mode; therefore, an alternative power source needs to be incorporated when using energy harvesting-powered devices. Hence, energy storage such as battery is still essential to guarantee smooth operation of an energy-harvesting IoT device.
1.1.6.4 Battery:
At first glance, this may seem like an unattractive option, since batteries eventually need to be replaced or recharged. However, if the battery is of proper size and type, it is actually often the most convenient choice because it provides flexibility, mobility and cost-effective
Shakya, Nikesh Man Introduction
solution. For instance, a lithium cell with suitable attributes and capacity can offer several years of power at a low cost.
The first two choices require the IoT device to remain tethered and hence limits flexibility and mobility. Inline power sources are constant but may be often impractical or expensive in many instances.; the third has more freedom and can be a "something-for-nothing" source but the IoT device is still constrained by the placement of the harvesting transducer and lack of consistent power supply; and the battery-only option offers the greatest flexibility, cable-free installations and low cost, however, it will require periodic replacement.
The following table gives the glance on various power source choices for IoT devices [22]
Table 1-2: Various power sources choices for IoT devices
Technology Pros Cons
Non-rechargeable batteries Convenience Cost Replacement Ecology Rechargeable batteries Rechargeable
Limited charge-discharge cycles Feasible with energy harvesting
Printable batteries
Easy fabrication process Customizable cell (voltage, capacity, size)
Thin and flexible
May damage at 40-50 °C Not mature enough
Solid-state batteries
Easy integration with IC Easy to miniaturize Thin and flexible
Low power density Not mature enough
Super capacitors 'Unlimited' charge-discharge
cycles Self-discharge
Energy harvesting Continuously replenishes
energy resources
Depends on ambient conditions (in some cases)
Requires extra hardware and power conditioning
1.1.7 Energy Consumption in IoT: A Taxonomy
Many IoT edge devices run on battery and various applications require them to keep running for years. IoT applications requiring battery operated edge devices are the major driver for novel low energy/power consumption communication standards specifically developed for IoT. The consumers would not accept low battery lifetimes. It may be cost-prohibitive to substitute exhausted batteries or even impossible in certain hostile environment. Hence, prolonging the lifetime is very important. Therefore, when there is involvement of battery, the node’s power becomes the most vital resource that must be used in a well-planned and efficient manner.
IoT applications can range from small sized healthcare surveillance systems to large scaled environmental monitoring or smart metering. A lot of research works have been done and are ongoing especially in optimizing the energy consumption covering several areas from physical to network layers of a protocol stack. There are various techniques of conserving the energy (energy saving techniques) in a wireless sensor network. The following presents the taxonomy of major existing approaches to tackle the energy consumption problem for battery-operated nodes. This taxonomy in Figure 1-10 is compiled from various sources [32]–[35]. These researches mention that the transmitting radio is the most dominant energy consumer. Hence, this thesis focuses on TX power and TX bit-rate control techniques to provide energy efficiency.
Shakya, Nikesh Man Introduction
Figure 1-10: Various energy saving techniques for WSN/IoTs
1.2 Thesis Motivation and Scope
Although IoT has numerous potentials to save both time and resources for many applications, it has its own set of unique problems. A survey in 2015 shows that the major concerns are security, privacy, connectivity and device management [36]. A single IoT solution technology cannot suffice all the possible applications. Different factors must be considered when choosing connected devices and protocols for a particular IoT application.
IoT sensor nodes are often referred to as Constrained Network Devices. They are small devices with limited memory/buffer, limited processing capabilities and limited power resources or working on batteries that are deployed in a huge scale. Such nodes are often deployed in harsh, lossy environments [37], [38]. The network itself is constrained that has various traits like lossy and unreliable links, low data rates, duty-cycles and asymmetric links. Such class of a constrained network with constrained devices is known as Low-powered and Lossy Networks (LLNs) [3]. For such constrained devices and constrained network, energy consumption or the device lifetime becomes the major issue. When there are billions of connected devices deployed, recharging them over months is practically impossible. So, the main topic in the IoT is the battery life. Whoever is able to provide a technology that correctly manages the battery life is a clear winner and hence is the main scope of this thesis.
Radio Optimization TX power Control Modulation Optimization TX bit-rate control Cooperative Communicatio n Directional Antennas Energy Efficient Cognitive Radio Data Reduction Aggregation Adaptive Sampling Compression Network Coding Sleep/Wake up Schemes Duty Cycling Passive Wake up Radios Scheduled based MAC Protocols Topology Control Routing Cluster Architecture Energy as Routing Metric Multipath routing Relay Node Placement Sink Mobility Battery Repletion Energy Harvesting Wireless Charging
When energy efficiency becomes the most important factor, various energy saving techniques are needed which were discussed in Section 1.1.7 that points to an important outcome: Radio Transmission is one of the major sources of energy consumption in today's rising IoT devices in low powered and lossy networks. There are several parameters to optimize the energy consumption in IoT/WSN domain, but from this thesis point of view, transmission power and transmission bit-rate are the two radio parameters that principally impact the energy consumption along with the radio coverage, interference, link reliability, channel/spatial reuse, etc. They are the key factors influencing the connectivity, performance and the lifetime of a node/network. Transmitting at a constant high/low power or rate leads to an inefficient energy usage due to the varying, unstable and unpredictable radio links. Fortunately, there are some existing transmission Power and/or Rate Control algorithms that control the power or rate or both to provide energy savings. Each of them has its strengths and weaknesses. Some have initial overheads, and some are difficult to implement. Most existing solutions use single link quality metric for channel quality estimation. Some define static thresholds on their signal metrics that limit their adaptability. While some current power control algorithms were designed for sensor nodes, all the existing rate control and rate/power control solutions were addressed for the 802.11 WLAN. Most of them are validated via simulations only whereas some via experimentation. Some have defined unrealistic assumptions such as: not considering collisions or fading, having priori knowledge about the channel conditions, number of nodes, number of collisions, etc which are always not practical.
An efficient transmission (TX) power/rate control algorithm for the constrained devices in IoT/WSN should have low overheads and must be energy efficient. They need to be adaptive and versatile to different environment conditions; yet be simple and easily implementable in the real sensor/IoT platform. There is not a single existing solution that succeeds to satisfy all these requirements on their own. Due to aforementioned problems and design challenges for a reliable and robust transmission power/rate control techniques, there is a need of a new algorithm that performs an energy-efficient power and/or rate control which can be easily implemented in a real sensor platform.
The main scope of this thesis will be focused on the Low Powered and Lossy Network (LLNs) or Low Power Wide Area Networks (LPWANs) where the nodes themselves have limited power. This thesis focuses primarily on the applications of IoT that do not involve mobility of the end points, do not have very high traffic rates and are delay-tolerant. Some
Shakya, Nikesh Man Introduction
examples of such applications may include: Smart metering, home automation, environmental monitoring and control, etc. This thesis focuses on a star network with long range communication where the deployed end-nodes send their packets to a central controller or sink based on event or periodically in a bubble-up fashion.
1.3 Content of PhD
1.3.1 Research Objectives and Contributions
Uncertainty in the radio links for a constrained wireless network is inevitable. The radio environment and the location where an IoT sensor node is deployed have a huge impact on the communication reliability. This would in turn effect the energy consumption of a node due to failures and need of retransmissions. Consequently, this will impact the node lifetime and hence the network lifetime. As discussed before, the evolution of IoT devices will increasingly involve batteries. Extending battery life clearly delivers economic benefits to IoT device manufacturers, management and end-users.
Hence, the overall research objective of the thesis is to reduce the energy consumption and prolong the device lifetime. Among the various techniques, this thesis focuses on controlling the transmission power and/or the transmission bit-rate as a means to improve the energy consumption while having similar reliability. There are various design goals that needs to be fulfilled in order to have an efficient control mechanism by bringing intelligence to the edge. They are summarized in the followings:
▪ The algorithm should have minimum communication overheads and short initial phase.
▪ The algorithm should be able to respond and adapt appropriately to the fast-fading as well as slow-fading environments. It should be versatile to different radio conditions.
▪ The algorithm must reduce energy consumption while maintaining similar reliability ▪ The algorithm should work well in both congested and uncongested environment. ▪ The developed algorithm should be simple and easy to implement in the real IoT
In order to develop a robust, reliable, responsive and energy-efficient power/rate control algorithm to fulfill the design goals defined earlier, following research objectives are addressed in this thesis:
RO1. Study of the impact of the transmission power and rate on the network
Before one can fully understand the transmission power/rate control mechanism, it is important to first understand the impacts of the transmission power and rate on the network. Hence, the first research objective was to understand the impacts of the power/rate on the various performance metrics such as energy consumption, interference, channel occupancy, packet delivery. In this research objective, it is shown how changing the transmission power and /or transmission bit-rate would help to reduce the transmission energy consumption while maintaining similar packet delivery performance.
RO2. Subjective analysis and selection of link quality metrics
It is equally necessary to understand link quality estimation technique and various available link quality metrics. They play a crucial role in the power or rate control mechanisms. The first contribution of this thesis is that it provides a rigorous analysis of the existing link quality estimation metrics and provide the pros and cons of each. This thesis provides a method to estimate the link quality by using multiple link quality metrics: One being the primary and the other being the secondary to better evaluate the channel.
RO3. Design, develop and implement an energy-efficient algorithm to dynamically control the power level
With the design challenges in mind, to start with the control mechanism, first a control algorithm was designed and developed that only changes the power level dynamically during the run time phase at a fixed transmission bit-rate. Various functional blocks were defined during the process that provides novel and effective approaches in adapting the power. The developed algorithm was evaluated using both simulation and experimentation. The second contribution of this thesis is hence the development of a new responsive energy-efficient adaptive control algorithm for transmission power.
RO4. Design, develop and implement an energy-efficient algorithm to dynamically control the transmission power and rate.
As it was observed from the experiment and literature work that, adapting transmission bit-rate further helps to save the energy consumption. Hence, this RO4 aims to extend the design
Shakya, Nikesh Man Introduction
from the RO3 to support the rate adaptation as well. With some changes in the functional process, a responsive, energy-efficient transmission power and rate control was devised that adapts either the power level or rate level or both as per the link conditions. This proposed design was then evaluated using experimentation.
The research objectives and the contributions from this thesis all tend to assemble to attain the ultimate goal of this thesis which is to provide an energy efficient communication while maintaining similar reliability by dynamically changing the power level and/or rate level.
1.3.2 Structure of Thesis
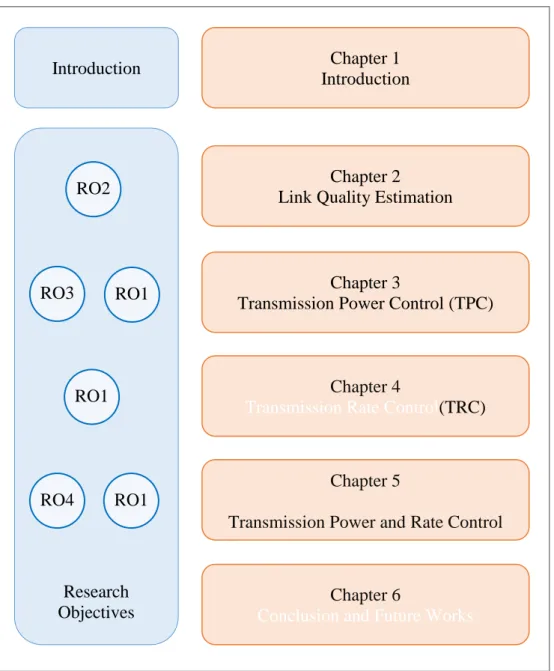
The remaining part of the thesis is organized as follows. In Chapter 2, we start by looking into the various link quality metrics to estimate the wireless channel conditions along with their pros and cons. This chapter ends with the selection of the link quality metrics for performing the power/rate control. In Chapter 3, we focus on transmission power control mechanism. We study about various impacts of the transmission power on the network, perform literature review on the existing algorithms. As a first step, this chapter presents a new design and concept for energy-efficient algorithm that performs an adaptive control of the power level only at a fixed bit-rate and highlights the novelty. The proposed algorithm is then evaluated using simulation and experimentation. Chapter 4 presents the study of the impact of transmission rate on the network metrics along with the literature review on the existing rate control mechanisms. This chapter shows some experiments at different bit-rates as well. In Chapter 5, we will see how the design idea from Chapter 3 is upgraded to take the transmission bit-rate into account to provide higher energy efficiency. Various experimentations were performed, and their results were shown in this chapter. Chapter 6 concludes the thesis work and indicates the future work in this area.
Figure 1-11: Research objectives addressed in each chapters
Introduction Chapter 1 Introduction
Chapter 2
Link Quality Estimation
Chapter 3
Transmission Power Control (TPC)
Chapter 4
Transmission Rate Control(TRC)
Chapter 5
Transmission Power and Rate Control
RO1 RO1 RO1 RO2 RO3 RO4 Chapter 6
Conclusion and Future Works
Research Objectives
2. Link Quality Estimation
2.1 Radio Link Quality ... 27
2.2 Signal-Based ... 28
2.3 Statistics Based ... 30
2.4 State of art and Review on signal and statistics-based metrics ... 32
2.5 Choice of Link Quality Metric ... 34
2.1 Radio Link Quality
Wireless mediums are highly volatile in nature even for immobile nodes because of several reasons such as single or multi-path signal fading or attenuation, shadowing, collisions, interferences, noises, motion of foreign objects, dense vegetation, orientation of the antenna, remaining battery lifetime, etc. [39]–[42]. The real world wireless network exhibit rich channel dynamics including random channel errors, mobility-induced channel variation and contention from the hidden stations [43]. These transmission quality variations can be classified as either transient short-term modification to the wireless medium or durable long-term modification. Typically, if someone walks around, closes the door, turns on microwave devices or moves big objects around, these will influence the transmission medium but not for long time whereas moving to a new area or change of the weather can have longer enduring impact.
Distance is not the only metric to consider while choosing the optimal power or rate [44]. Radio communication quality between low power sensor devices is affected by spatial and temporal factors i.e. they depend on the space and time and the individual hardware. The spatial factors include the surrounding environment, such as terrain type (such as grassy, indoor, outdoors, parking etc.) and the separation between the transmitter and the receiver. Temporal factors are the dynamic factors that include environmental changes such as weather conditions including temperature and humidity, background noise and the movement of foreign objects [40]–[42]. Because of these random environmental dynamics, the electromagnetic phenomenon such as degree of reflection, refraction, scattering and/or fading of the radio waves will also change resulting in the change of the radio quality.
Adapting to such link conditions and predicting its future state is a thorny problem and requires an efficient link quality estimation (LQE). Choosing a proper link quality metric and making an accurate estimation is crucial for the design of a transmission power and rate control as it has a direct impact on the efficiency and the stability of the entire algorithm and the system. A link estimator should be accurate, reactive, efficient and stable while minimizing both memory requirements and traffic overhead [39], [45], [46]. To elaborate, LQE should be energy efficient as energy is the major concern in WSN/IoT, LQE should minimize the communication overheads, LQE should be accurate. The last one is an obvious one as any false estimation would lead to unstable system. LQE should be reactive. It is necessary to react quickly to the persistent changes in the link conditions. LQE should be
Shakya, Nikesh Man Link Quality Estimation
stable which refers to the capability to tolerate the short-term variations in the link quality to prevent from unnecessary changes. Reactivity and stability are often at odds with each other. A good link quality estimator is the one that can provide a good tradeoff between reactivity and stability [39].
Hence, to design a proper transmission power and rate control algorithm, it is necessary to correctly set the TX power level and the rate level considering these various factors into account. Figure 2-1 shows some of the popular available radio link quality metrics used in most of the existing power/rate control mechanisms. They can be broadly categorized into signal-based and statistics-based metrics. They are explained in the next few sections.
Figure 2-1: Various link quality metrics from various OSI layers
2.2 Signal-Based
The RSSI (Received Signal Strength Indicator), the LQI (Link Quality Indicator), the SNR or SINR (Signal to interference/noise Ratio) are the signal-based metrics used in most
RSSI
LQI
SNR/SINR
PRR
Neighbors CountETX/ETT
Higher Layers
MAC
Physical
Signal-based Statistics-basedOSI Reference Model
R ece iv e r-si de Sen de r-s id e
Link Quality
Metrics
transmission power and/or rate control algorithms. As the name suggests, these metrics are signal based. Radio transceiver chips measure the signal level during the reception of a frame and instantly provide these metric values from the physical layer- hence they are also categorized as hardware-based metrics. As the signal level is greatly affected by the time varying interference, fading and noise floor present, it may not provide the exact information. Being hardware-based, any mis-calibration may also lead to provide wrong estimates of the link quality. It has been stated that 802.15.4 compliant radios such as CC2420 [47] and Atmel AT86RF215 [48] introduce systematic errors and inaccuracy in their measurements.
Sender-based transmission control algorithms using signal-based metrics require a feedback mechanism to send back these direct or processed metric values to adjust the power/rate level at the sender. These metrics do not consider the collisions or retries that have been performed at the sender side. They provide the link quality information when a frame has been successfully decoded at the receiver side. Moreover, these metrics can only be obtained when the frame is received successfully at the receiver and acknowledged back to the sender. So, the signal-based metric alone may not be able to provide efficient estimates about the radio link quality when used alone. However, with signal-based metrics, direct control techniques can be applied using some approximation, mapping, formula or predictive models to converge to the appropriate level of rate and/or power quickly. Brief descriptions of some signal-based metrics are provided in the following sub-sections.
2.2.1 RSSI
The RSSI, Received Signal Strength Indicator, is a signal-based link quality metric and is simply the measure of signal power at the incoming frame. It is the signal strength of last 8 symbols of the incoming 802.15.4 frame. It is measured in dBm and may range from -120dBm to 0dBm. The pure received signal and the noise floor at the receiver sums up to give the RSSI value. It is correlated with PRR (Packet Reception Ratio) except when operating at the edge of receiver sensitivity. This information is obtained only when the frame has been successfully received. Same is true for the LQI.
2.2.2 LQI
The Link Quality Indicator (LQI) represents the quality of the wireless link. Usually this value results from the correlation of multiple symbols within the received frame and


![Table 3-5: CC2420 Output power settings and typical current consumption @ 2.45GHz [47]](https://thumb-eu.123doks.com/thumbv2/123doknet/11413696.288463/85.892.248.664.871.1124/table-output-power-settings-typical-current-consumption-ghz.webp)