HAL Id: hal-01135637
https://hal-mines-paristech.archives-ouvertes.fr/hal-01135637
Submitted on 25 Mar 2015HAL is a multi-disciplinary open access archive for the deposit and dissemination of sci-entific research documents, whether they are pub-lished or not. The documents may come from teaching and research institutions in France or abroad, or from public or private research centers.
L’archive ouverte pluridisciplinaire HAL, est destinée au dépôt et à la diffusion de documents scientifiques de niveau recherche, publiés ou non, émanant des établissements d’enseignement et de recherche français ou étrangers, des laboratoires publics ou privés.
Global and regional potential for bioelectricity with
carbon capture and storage
Olivia Ricci, Sandrine Selosse
To cite this version:
Olivia Ricci, Sandrine Selosse. Global and regional potential for bioelectricity with carbon capture and storage. [Research Report] Working Paper 2011-03-03, Chaire Modélisation prospective au service du développement durable. 2011, pp.20 - Les Cahiers de la Chaire. �hal-01135637�
Les Cahiers de la Chaire
Global and regional potential for bioelectricity
with carbon capture and storage
Chair
e Modé
lisa
tion pr
ospectiv
e au se
rvice du dé
veloppe
me
nt dur
able
Olivia RICCI
LEO
University of Orleans/CNRS
Sandrine SELOSSE
CMA
MINES ParisTech
Abstract
Among technological options to mitigate greenhouse gas (GHG) emissions, Biomass En-ergy with Carbon Capture and Storage technology (BECCS) is gaining increasing atten-tion. This option offers a unique opportunity for a net removal of atmospheric CO2 while it fulfills energy needs. This results analysis appears in line with the growing body of li-terature using bottom-up energy models and shows that BECCS has an important role to play in the future energy mix. Most of those studies focus on BECCS global potential whe-reas it is of interest to understand where this mitigation will be deployed. This key issue will strongly depends on regions’ biomass resources and storage sites endowment. The aim of this study is to assess the global and regional potential of BECCS up to 2050 and to compare it to the deployment of CCS in the power generation. This analysis is conduc-ted with the global multiregional TIAM-FR optimization model. Investigaconduc-ted climate po-licy scenarios led to a considerable expansion of renewable energy and CCS and BECCS technologies in the power sector. CCS from fossil fuel is mainly deployed in fast deve-loping countries, well endowed with coal and, BECCS is highly distributed in devedeve-loping countries even if biomass resources are widely available in all regions. This response to carbon constraint is however dependent of the consideration of CO2 negative emissions and of the incentives and appropriate policies created by States. In addition, it required the development of a regulatory framework, sustained R,D&D and infrastructures investments.
Keywords: Biomass, Bioenergy with carbon capture and Storage, Long-term
energy modelling, TIAM-FR
Global and regional potential for bioelectricity
with carbon capture and storage
Olivia Ricci*, Sandrine Selosse**
* LEO, UMR 6221 (University of Orleans - CNRS) Rue de Blois, 45607 Orleans Cedex 2, France olivia.ricci@univ-orleans.fr
** MINES ParisTech, Center for Applied Mathematics (CMA) Rue Claude Daunesse, 06904 Sophia Antipolis, France sandrine.selosse@mines-paristech.fr
1. Introduction
Fossil fuels (coal, oil and gas) will remain the dominant sources of energy over the next decades. As a result, CO2 emissions drastically increase to unsustainable levels. Carbon capture and storage (CCS) is a promising technology to achieve a deep cut in emissions and reverse this trend (IEA, 2008). It consists of capturing CO2 from large stationary sources, transporting it and storing it in geological formations where it can no longer contribute to global warming. CCS is mostly associated with the use of fossil fuels whereas it can also be combined with bioenergies (BECCS). This option is gaining increasing attention as it offers a unique opportunity for a net removal of atmospheric CO2 while it fulfills energy needs such as electricity, heat, hydrogen and biofuels (Obersteiner et al., 2001). Conside-ring that carbon from biomass is neutral (because it is included in the natural carbon cycle), BECCS can lead to “negative emissions”, given sustainable biomass harvesting practice and the permanent geological storage of CO2. A growing body of literature using bottom-up energy models shows that BECCS has an important role to play in the future energy mix. Under low stabilization targets, models predict that the availability of BECCS decreases the cost of mitigation. In fact, when stringent targets are applied negative emissions become a valuable option (Azar et al., 2006, 2010; Luckow et al. 2010, Katofsky et al., 2010, van Vuuren et al, 2007).
Most of those studies estimate the global potential of BECCS in reducing emissions assu-ming that all world regions act together under a common policy. This is an efficient situa-tion where all countries face an unique carbon price. The uniqueness of the price leads to the equalization of marginal abatement costs across polluters and therefore enables emis-sions reductions at the least cost. What happens in a more realistic second-best framework where heterogeneous regions have different concerns in terms of environmental policies? Many countries have made pledges to UNFCCC in January 2010 under the Copenhagen Accord to reduce GHG emissions that should be taken into account. Moreover, it is of in-terest to understand where BECCS will be deployed. This key issue will strongly depends on regional biomass resources and storage sites endowment.
The aim of this study is to assess the global and regional potential of BECCS in the power sector up to 2050 assuming environmental policy scenarios based on the commitments an-nounced by countries. This allows us to analyze how those commitments affect the future power mix and particularly the deployment of CCS technologies. This analysis is conduc-ted with the global multiregional TIAM-FR optimization model, the French version of the TIMES Integrated Assessment Model developed under the Energy Technology Systems Analysis Programme (ETSAP) of IEA. To analyze possible alternative development paths of the system we also investigated a global environmental scenario with distinct constraints on the deployment of CCS and BECCS technologies.
The paper is organized as follows: Section 2 describes the methodology used for the analy-sis and the environmental scenarios. Section 3 presents the results of the long-term model-ling. The final section concludes by a discussion about the potential of deployment of fossil and biomass CCS.
2. Methodology and climate scenarios
2.1 TIAM-FR
TIAM-FR is the French version of the TIMES Integrated Assessment Model, a widely used, linear programming TIMES family model developed under the Energy Technolo-gy Systems Analysis Program (ETSAP) of IEA. TIAM-FR is a bottom-up enerTechnolo-gy system model. It depicts the world energy system with a detailed description of different energy forms, technologies and end-uses constituting the Reference Energy System (RES). The RES network, reported in the figure 1, links these commodities to several thousand existing and future technologies characterized by its economic and technological parameters in all sectors of the energy system (agriculture, industry, commercial, residential and transport; taking into account conversion and electricity sector). The system includes the extraction, transformation, and distribution, trade of various energy forms and materials, and end-uses.
Figure 1: Synthetic view of the reference energy system
TIAM-FR is driven by the end-use demands and aims to supply energy services at mini-mum global cost by simultaneously making decisions on equipment investment and ope-ration, primary energy supply, and energy trade (Loulou and Labriet, 2007). The main outputs of the model are future investments and activities of technologies for each time period. Furthermore, the structure of the energy system is given as an output, i.e. type and capacity of the energy technologies, energy consumption by fuel, emissions, energy trade flows between regions, a detailed energy system costs, and marginal costs of environmental measures as GHG mitigation targets.
TIAM-FR is geographically integrated in 15 world regions: Africa (AFR), Australia-New Zealand (AUS), Canada (CAN), China (includes Hong Kong, excludes Chinese Taipei; CHI), Central and South America (CSA), Eastern Europe (EEU), Former Soviet Union (includes the Baltic states, FSU), India (IND), Japan (JPN), Mexico (MEX), Middle-East (includes Turkey; MEA), Other Developing Asia (includes Chinese Taipei and Pacific Is-lands; ODA), South Korea (SKO), United States of America (USA) and Western Europe (EU-15, Iceland, Malta, Norway and Switzerland; WEU). It covers the time horizon from
2005 to 2100; nevertheless, this study is investigated until 2050.
Through its integrated climate module, it allows analyzing and making assumptions on at-mospheric GHG concentrations and temperature changes. It integrates CO2, CH4 and N2O emissions from each fuel combustion and process.
In the model, biomass is characterised by manifold sources - industrial waste, municipal waste, landfill gas, bioenergy crops, and solid biomass resources – and the fact that it is not traded between regions.
The maximum amount of available biomass for each region is determined exogenously according to IEA data. The global potential is estimated at 234 EJ per year in 2050. In the literature biomass potential varies greatly given the different assumptions on land use, yield development, food consumption and other criteria of sustainability such as water scarcity and loss in biodiversity (van Vuuren et al, 2009). This potential varies between 100 EJ and 400 EJ per year over the period 2050-2100.
TIAM-FR integrates several carbon capture and sequestration technologies derived from fossil or bioenergies resources. In the power sector, the model considers two technologies of capture for bioplants: pre-combustion for biomass gasification process and post-com-bustion for direct compost-com-bustion process. Cumulated storage capacities assumed in the model
TIAM-FR are 14,800 Gt of CO2 with 12,600 Gt of CO2 that can be stored in deep saline
aquifers (annexe 1).
2.2 Climate scenarios
A baseline business as usual (BAU) scenario without any emission constraint was first calculated. In this reference scenario, no climate policy is assumed. The BAU scenario outlined some key patterns in the evolution of the energy system, and served as the starting point for the analysis. Carbon constraints scenarios allowed us to investigate the changes induced by a strong environmental policy. Thus, the BAU scenario was compared to the emission mitigation scenarios to assess the implications on the future development of the energy system and to formulate policy recommendations. So, to analyze possible alterna-tive development paths of the system we investigated two climate scenarios according to different assumptions of carbon mitigation on different regions of the world or at a global level over the period 2005-2050.
Table 1: Regional CO2 mitigation targets for 2020 and 2050
The first one, the S1 scenario, is a regional scenario considering Copenhagen pledges in 2020 and assuming new targets for 2050. This scenario only involves industrialized and fast developing countries. Developing countries are not constrained by the environmental
policy. More precisely, this regional scenario represents the lower CO2 mitigation targets by 2020 expressed to UNFCCC for the Copenhagen Agreement in January 2010 by Europe, the United States of America, Australia, Canada, Japan, China and India. The table 1 pre-sents these regional commitments.
Targets by 2050 of industrialized countries consist in assumptions we made as regards the international convergence on long-term objectives in term of GHG emissions reductions. Concerning the United States and Canada, we consider targets that they also pledged a CO2 mitigation target of 30% by 2025, 42% by 2030 and 83% by 2050. Note that for China and India, the 2020 commitment is not on the emission level but on the carbon intensity. This means that Indian and Chinese GDPs will continue to rise but their carbon emissions will have to increase at a lower rate due to greater energy efficiency and investment in greener technologies. In the 2050 target, we suppose that China and India pledge on emission level.
Table 2: Understanding the regional CO2 mitigation targets for 2020 and 2050
Regions 2020On 1990 scale2050 2020On 2005 scale2050
Europe -20% -80% -18% -79% Japan -25% -80% -32% -82% Australia +9% -77% -13% -82% USA -0,3% -80% -17% -83% Canada +3% -79% -17% -83% China +301% +109% +73% -10% India +332% +86% +110% -10%
An important and well-known observation to note concerns the choice of reference year. In-deed, while Europe and Japan pledge for a CO2 emission mitigation target up to 2020 com-pared to 1990 levels, other regions take 2005 (or 2000 for Australia) as the reference year. This naturally has a significant impact on targets. The previous table showed what these targets represent in a common reference base (same base year, same type of mitigation). The second scenario, the S2 scenario, is a coupled regional and global scenario. It takes into account disparities between regions expresses with the 2020 targets and adds a global
constraint that consists in reducing CO2 emissions by 50% in 2050 compare to the year
2000, in line with the consensual 2°C objective expressed to UNFCCC since COP15 and the Fourth Assessment Report of IPCC (IPCC, AR4). For 2050, all regions are concerned by this global target but they are not constraint at a beforehand determinate level of CO2 emissions.
To analyze possible alternative development paths of the system we investigated theses environmental scenarios with distinct constraints on the deployment of CCS and BECCS technologies.
2.3 CO2 mitigation context
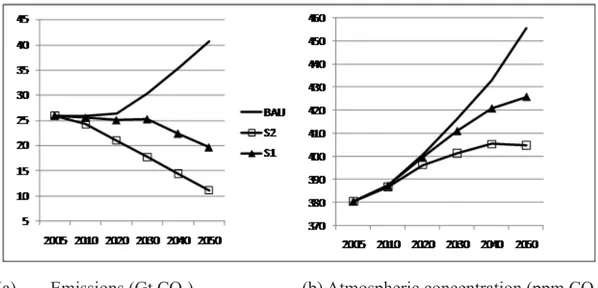
Efforts to reduce emissions in both climate scenarios are reported in figure 2, such as in-duced changes in the CO2 atmospheric concentration. In the BAU scenario, latter reaches
455 ppm in 2050; while beyond 400 ppm CO2 it will not be possible to stabilize global
Figure 2: Global carbon emissions and the resulting CO2 concentrations
(a) Emissions (Gt CO2) (b) Atmospheric concentration (ppm CO2)
In S1 scenario, the CO2 atmospheric concentration pursues its growth, even if it slows down and goes to 425 ppm in 2050. Meanwhile, the global constraint consisting in reducing CO2 emissions by 50% in 2050 compare to the year 2000, expressed in the S2 scenario, allows stabilization of the atmospheric concentration at 405 ppm, so close to the consensual
glo-bal objective addressed to UNFCCC. To respect the climate targets, world CO2 emissions
should decrease by 1.3 Gt and 5.3 Gt in 2020, respectively in S1 and S2, and by 21 Gt and 30 Gt in 2050 compared to the BAU pathways.
The commitments pledged by the states in S1 scenario do not dramatically reduce emis-sions in 2020, and are not sufficient in the context of the pathway expressed by S2, to reach
the global UNFCCC objective. To achieve the overall objective of 2°C, a wider CO2
miti-gation is required and particularly, developing countries will have to participate to the CO2 emissions reductions efforts (Dellink et al. 2010; Selosse et al., 2010). Table 3 shows how the emissions reduction effort is share out between groups of countries:
- Industrialized countries (IC): Australia, Canada, Europe (Western and Eastern), Ja-pan and United States of America; regions constrained in S1 and S2 scenarios;
- Fast developing countries (FDC): China and India; regions constrained in S1 and S2 scenarios;
- Developing countries (DC): Africa, Central and South America, Former Soviet Union, Middle East, Mexico, Other Developing Asian countries and South Korea; re-gions constrained in S2 scenarios.
In S1 scenario, the CO2 emissions reductions are primarily led by industrialized countries in 2020. In 2050, the goal of reducing emissions by 10% for China and India can achieve over 50% of the overall objective. The S2 scenario benefits to industrialized countries in 2050 by comparison with the S1 scenario and developing countries are heavily constrained in 2020
and 2050. They have to decrease their CO2 emission by 29% and 64% respectively in 2020
and 2050 by comparison with the trend expressed by the BAU, against 14% and 62% for developed countries. Expected contributions from fast developing countries are also higher in S2 scenario than in S1 scenario, whatever the period. The potential to reduce emissions at least cost appears more important in developing and fast developing countries than in industrialized countries. In addition, S2 shows that fast developing countries should reduce in a larger extend their CO2 emissions (and not their carbon intensity) in order to achieve the overall objective of 2°C.
We study energy mix evolution from 2005 to 2050 in light of these scenarios. We particu-larly analyze the deployment of CCS and BECCS in the power generation.
3. Results analysis
3.1. Primary energy consumption : the biomass development
Global primary energy consumption in the BAU scenario increases by 1.6% per year between 2005 and 2050, reaching 816 EJ in 2050 (Figure 3). Renewable energies are de-veloped. However, fossil fuels remain the dominant sources of primary energy worldwide (70%) in 2050. Coal, oil and gas account for 25%, 24% and 21% of the global consump-tion. The contribution of low carbon-emitting sources (nuclear, renewable and biomass) is 30%. The share of renewable energies, nuclear energy and biomass accounts respectively for 13%, 9% and 8% of the primary energy demand. The environmental scenarios S1 and S2 have a real impact on the primary energy mix. Demand for biomass and renewable en-ergies increases significantly compare to the BAU while demand for coal and oil decreases sharply.
Figure 3: World primary energy consumption (EJ)
In S1, renewable energies and biomass increase by 235% and 52% in 2050, respectively, relative to the BAU (in 2050). Coal, oil and gas demands decrease by 68%, 27% and 25%. Thus, fossil fuels and non-GHG emitting energies account for respectively 40% and 60% of the primary energy consumption. In S2, in 2050, the share of fossil fuels in total
consump-tion decreases more strongly than in S1 (34% against 40%) and coal accounts for only 3% of consumption. However, biomass has an important role to play in this scenario. Its de-mand increases greatly and its share reaches 16%.
Fast developing and developing countries are largely responsible for the expected increase in primary energy demand in the BAU. Consumption from China and India rises by 217% between 2005 and 2050 (figure 4). By 2050, these two countries represent 31% of the glo-bal demand as against 19% in 2005. China is the largest consumer of coal (100 EJ). There-fore, there is a great potential for carbon capture and storage technologies development in this country. The implementation of environmental policies creates a dazzling deployment of renewable energy in those both countries. However, the share of coal and gas remain significant in the scenario S1. In S2 scenario, the share of coal and gas drastically decreases and is replaced by an increasing use of biomass. Industrialized countries also use renewable energy in scenarios S1 and S2. In addition, their demand for biomass is multiplied by more than 3 in S1 and S2 relative to the BAU in 2050.
Figure 4: Primary energy consumption by region (EJ)
World biomass consumption in 2005 is 48 EJ of which about one third is traditional bio-mass used for domestic use (heating, cooking, etc.). In 2050, it reaches 71 EJ in the BAU, 105 EJ in S1 and 148 EJ in S2 (Figure 5). This result shows that the constraint on the avai-lability of biomass is not saturated. In 2005, biomass comes mainly from forestry residues, called solid biomass (85%). From 2020, the environmental constraints in the two scenarios increase the competitiveness of dedicated crops.
Therefore, in 2050 in S1 and S2, respectively, 36% and 44%, of the biomass come from crop (in S2 it represents 60EJ), 54% and 41% from solid biomass and 7.5% and 11.4% from municipal and industrial wastes. The economic potential of biomass from TIAM-FR is in line with the evaluation of van Vuuren et al, (2009) on sustainable biomass potential. They estimate a maximum potential for biomass issued from crop of 65 EJ in 2050. This estimation takes into account constraints on land degradation, water scarcity and loss of biodiversity. The availability of CCS technology increases the demand for biomass. Figure
6 shows that in the scenario S2 without BECCS1 (S2-NoBECCS), the demand for biomass
is about 20% lower compared to the scenario with BECCS, so S2 (Figure 5).
Figure 6: World biomass consumption in 2050 when CCS is not available (EJ)
Demand for biomass is very important in developing countries where it is mainly used for domestic purposes (figure 7). In 2050, in S2, the demand increases by 94% compared to BAU in those countries. The quantities consumed in Africa, South-East Asia and Central and South America are 21 EJ, 18 and 12 EJ respectively. India and China relies also heavily on biomass. In total, 50 EJ are consumed in these two countries in the scenario S2 in 2050.
Figure 7: Biomass consumption by regions (EJ)
When there is no environmental policy, biomass consumption in industrialized countries is relatively low in 2050 (only 9 EJ). However, the implementation of environmental policies increases biomass competitiveness. Consumption is multiplied by 3.2 by comparison with the BAU and three quarters of this demand come from the United States and Western Eu-rope. The impact of environmental policy scenarios is particularly noticeable in the power
sector, and notably as regards the development of CCS technologies.
3.2. Power generation
Figure 8 describes the electricity mix evolution between 2020 and 2050 in view of the climate scenarios investigated. The power generation increases from 61.7 EJ in 2005 to 126.5 EJ in 2050 in the BAU scenario. In 2050, the electricity mix is composed of 43% by coal, 20% by nuclear, 15.9% by gas and oil, 11% by hydro, 10% by renewable, and 0.1% by biomass.
Figure 8: Electricity mix (EJ)
The implementation of an environmental policy constraint (S2) induces the integration of carbon capture and storage technologies into this sector from 2020. This development is intensifying from 2030. In 2050, CCS is developed at 23% and 30% respectively in S1 and S2. Almost all coal and gas plants are fitted with a CCS technology in the scenario S2. This explains the low contribution of coal and gas without CCS (0.2% for coal and 2% for gas in S2, in 2050).
This result is consistent with the literature. In their model, Luckow et al. (2010) lead to the following result: coal is only used with CCS from 2050 as a result of an ambitious environ-mental policy. The «Blue map» scenario of the International Energy Agency also predicts a 100% CCS development on coal power plants in 2050. Renewable energy and hydraulic energy increase in S1 and S2. In 2050, their shares in the production were respectively 34% and 11% in S1 and 37% and 12% in S2. The share of nuclear energy, meanwhile, remains stable.
In 2050, when CCS technology is not available (Figure 9), the environmental objective is achieved by the rapid deployment of renewable energy. In scenario S2-NoCCS the share of renewable energy increases by 58% compared to scenario S2 and in S1-NoCSC it in-creases by 47% compared to the scenario S1. When BECCS technology is not developed (NoBECCS scenario), the share of fossil-CCS grows slightly in scenario S1-NoBECCS (+3%). In scenario S2, however, renewable energy is deployed to compensate the absence of negative emissions.
Figure 9: Electricity mix in 2050 (%) with or without BECCS or CCS
CCS technologies enter the market in 2020. Scenario S2 leads to a faster deployment of CCS and BECCS from 2030. In 2050, 30 EJ of electricity is produced with a CCS tech-nology in S1 and 39 EJ in S2. The share of BECCS in this total is significant, 44% of the total deployment will come from bioelectricity in S1 and 69% in S2. It means that, in 2050, BECCS «generates» about 10% of the electricity in S1 and 20% in S2.
3.3. Carbon capture and storage technologies
Capture technologies are mainly used on direct biomass combustion power plants to induce large amounts of negative emissions. Thus, co-firing power plants (biomass and coal) that we have incorporated in the model are not deployed. Coal power plants that dominate the market are integrated gasification technology with combined cycle (IGCC). Emissions are captured with a pre-combustion technology. When the policy is more ambitious (S2), CCS is also developed on natural gas combined cycle plants (NGCC).
The distribution by regions (Figure 11) clearly shows that industrial countries implement CCS primarily on biomass resources in the two scenarios. In addition, when the policy is ambitious (S2) all regions primarily use BECCS. As in the analysis of Sands et al. (2011), low-emission technologies, such as commercial biomass and carbon dioxide capture and storage, are prominent in the mitigation scenarios, and the most stringent scenario, limiting the increase of the world CO2 emissions in 2050, requires a negative emissions technology such as bio-electricity combined with CCS.
CCS from fossil fuels is, in turn, more deployed in China and India. Developing countries don’t have to take any measures to reduce GHG emissions in S1. Therefore, CCS is deve-loped at 70% in China and India in 2050. In both countries, CCS from coal is used from 2030. BECCS enters the market in 2040 to satisfy the environmental constraint of 2050. In 2050, 74% of the deployed CCS in the electricity sector is applied to fossil fuels and 26% to biomass. China is the biggest market for CCS development in the electricity sector. The environmental constraint for industrialized countries is stronger in S1 than in S2 (Table 3). Thus, these countries use more BECCS to generate negative emissions. In 2050, 9.3 EJ of electricity are fitted with a CCS technology and 80% of this CCS is applied to 100% biomass power plants. The main countries that develop CCS and BECCS are in order: the United States (4.8 EJ), the Western Europe (2.3 EJ), the Eastern Europe (1.5 EJ), Japan (0.5 EJ) and Canada (0.03 EJ).
Figure 11: CCS deployment in the power sector across regions (EJ)
In scenario S2, where effort is more evenly distributed between world regions, CCS is also extended to developing countries. In 2050, these countries primarily rely on BECCS, 68% of the developed CCS is applied to this resource. Some countries well endowed with biomass only developed BECCS. This is the case of Africa, Central and South America and South-East Asia. The Middle East and the Former Soviet Union, meanwhile, mostly use CCS on gas power plants. These results also show that India and China extensively use BECCS in scenario S2. Indeed, the effort to reduce emissions is very consistent for both countries in 2050 so they value the negative emissions.
The potential of BECCS is better dispersed worldwide than the one of CCS. In scenario S2, in 2050, direct combustion technology of biomass are developed up to 23% in China, 17% in India, 14% in the United States, 13% in South-East Asia, 7% in Central and South
America, in Western Europe and in Africa, 4% in the former Soviet Union, 3% in Eastern Europe and 1% in Australia, in Canada, in Japan, in South Korea and in the Middle East. These results confirm that CCS and BECCS potential depends on regional disparities in terms of emission reduction objectives and fossil and biomass resources countries’ endow-ments. Storage capacities assumed in the model TIAM-FR (Appendix 1) are sufficiently large and distributed across the planet to not constrain the CCS deployment in our scena-rios. In total, the potential introduced in the model is 14,647 Gt of CO2 with 12,648 Gt of CO2 that can be stored in deep saline aquifers. These assumptions are in the range of the IEA which estimated a global potential in deep saline aquifers between 2,000 and 20,000 Gt of CO2 . The Intergovernmental Panel on Climate Change (IPCC) estimates that there is 1,500 to 14,000 Gt of potential CO2 storage.
Figure 12: Stored emissions (Gt CO2) in the power sector
In 2050 in the power sector, a total of 5.7 Gt in scenario S1 and 7.6 Gt of CO2 in scenario S2 are stored per year; respectively 2.8 Gt and 1.7 Gt are from fossil fuels and 2.8 Gt and 5.8 Gt are from biomass combustion (Figure 12). In the same period, in the energy sys-tem, a total of 8.2 Gt in scenario S1 and 9.8 Gt of CO2 in scenario S2 are stored per year; respectively 5.3 Gt and 4 Gt are from fossil fuels and 2.9 Gt and 5.8 Gt are from biomass combustion. The storage of emissions is carried out over 95% in saline aquifers. So, a noticeable part of the CO2 mitigation effort comes from the storage of emitted CO2 by the energy system processes.
4. Discussion
This paper is devoted to discussing the global and regional potential of the CCS and BECCS in the power sector in different climate policy contexts. The availability of these techno-logies in the long-term energy model TIAM-FR has enabled us to analyze the effects of
CO2 emission reduction measures pledged by the States in the Copenhagen Accord and
confirmed in the Cancun Accord, on the evolution of the electricity mix and the deployment
of CCS technologies. First of all, the commitments to reduce CO2 emissions and carbon
intensity announced by the industrialized countries, India and China are insufficient to meet the global target of 2°C. The carbon intensity reduction objective of China and India for 2020 is insufficient to drastically reduce global emissions. Indeed, as economic growth in
these countries sharply increases, this type of commitment helps to relieve a little the en-vironmental constraint but they stay large contributor of the climate warming. Thus, it is expected that fast developing and developing countries participate actively in the emissions reduction effort by setting binding targets as soon as 2020. In this context, not only a higher contribution of fast developing countries is expected but also the necessary participation of developing countries and so, an international cooperation is required to reach the global climate target. The problem is about the fair and plausible level of their contribution firstly according to growth and development perspectives and secondly, according to their techno-logical options. Indeed, the technotechno-logical progress is also a determinant issue.
Investigated environmental policy scenarios led to a considerable expansion of renewable energy and CCS and BECCS technologies in the power sector. In 2050, CCS and BECCS «generate» 23% of the electricity in the scenario S1 and 30% in scenario S2. The results show that BECCS can have an important role to play, particularly in the most stringent scenario. About 40% of CCS applications are completed on biomass power plants in S1 and 70% in S2. From 2030, CCS is applied to direct combustion of biomass in order to generate large amounts of negative emissions. In 2050, in scenarios S1 and S2 respectively
5.7 Gt and 7.6 Gt of CO2 are captured and stored in the power sector. CCS and BECCS
deployment is highly dependent on fossil fuels and biomass resources of each country. Thus, CCS from fossil fuel is mainly developed in fast developing countries that are well endowed with coal. CCS from coal is growing at over 70% in China. BECCS deployment however is better distributed because biomass resources are widely available in all regions. It is developed up to 23% in China, 17% India, 14% in the United States, 13% in South-East Asia, 7% in Central and South America, Western Europe and Africa, 4% in the Former Soviet Union, 3% in Eastern Europe and 1% in Australia, Canada, Japan, South Korea and the Middle East.
The deployment of fossil and biomass CCS appears as a response of carbon constraint es-pecially for fast developing and developing countries. CO2 capture and storage offers the potential for near-zero CO2 emissions from fossil-based power plants and CO2 negative emission from biomass-based power plants. A major issue related to the deployment of CCS and BECCS is their economic viability. To become significant, economic incentives will be needed. It seems important to mention that negative emissions are not considered in the Kyoto framework. Thus, there are currently no incentives for firms to capture CO2 from
biomass. The development of biomass CCS could also be linked to CO2 emissions
invento-ries and accounting and, particularly to this consideration of negative emissions. More spe-cifically, there is a need to study the possible routes to incentivize biomass and CCS using Kyoto mechanisms. According to their future and evolution, flexible mechanisms, clean development mechanisms (CDM) and joint implementation (JI) could become options for development projects in developing countries, considering their potential (ibid.). Moreover, safety problems and social acceptability have also to be considered in terms of risks and concerns for long-term CO2 geological storage. A regulatory system is required to frame the selection of appropriate sites, the long-term ownership and liabilities, a monitoring pro-gramme to detect problems. For example, in case of carbon leak back into the atmosphere, methods have to be developed to stop or control CO2 releases.
The lack of maturity of BECCS technology can also be identified as an obstacle. Carbon capture, in the context of enhanced oil recovery, exists and consists in a proven technology already used in the oil industry to increase oil production. But proven cost-effective means
for removing and sequestering most of the CO2 emissions from coal-based power plants do not currently exist (Segadelli, 2008). These technologies are however considered as econo-mically feasible under specific conditions (Appendix 2). The situation is the same for bio-plants. The role of the CCS and BECCS in mitigating climate change partly depends on the capability to reduce costs and, by consequence, on the commercialisation at an industrial scale in the marketplace (technology learning) and on sustained Research, Development & Demonstration. In addition, distance from source of CO2 capture and storage site involve the necessary need, and so cost, to develop infrastructure for transporting CO2.
Potential for fossil and biomass exists but regulatory barriers have to be discussed and
removed as knowledge gaps have to be filled in. The increasing need to limit CO2
emis-sions and the current limits of alternative technologies constitutes assets in this sense. For example, renewables options are far to be excluded of the debate but they also must be thinking with the structural costs of investments in the power network required to integrate intermittent energies. So a complete and complex chain of processes and procedures have to be thought and determined in the design of future energy policies.
Appendix 1. Storage capacities in GtCO2
Appendix 2. Current maturity of CCS system components (adapted from Segadelli, 2008)
I: Research phase II: Demonstration phase
III: Economically feasible under specific conditions IV: Mature market
References
Azar C., Lindgren K., Larson, E., Möllersten,K. (2006). Carbon capture and storage from fossil fuels and biomass costs and potential role in stabilizing the atmosphère, Climatic Change, Vol. 74, pp. 47-49.
Azar C., Lindgren K., Obersteiner M., Riahi K., Van Vuuren D. and Michel K., (2010), The feasibility of low CO2 concentration targets and the role of bio-energy with carbon capture and storage (BECCS), Climatic Change,Vol. 100, pp. 195-202.
Dellink R., Briner G. and Clapp C., (2010), Costs, Revenues, and Effectiveness of the Co-penhagen Accord Emission Pledges for 2020, Documents de travail de l’OCDE sur l’envi-ronnement, No. 22, Publication de l’OCDE.
Den Elzen M. And Höhne N (2008), Reductions of greenhouse gas emissions in Annex I and non-Annex I countries for meeting concentration stabilisation targets, Climatic Change, 91, pp.249-274.
Gurand B. (2007), Energy and Environment. The risks and Challenges of a foretold crisis (Energie et environnement. Les risques et les enjeux d’une crise annoncée), EDP Sciences, 324p.
Gemenne F. (2010), Geopolitics of Climate Change (Géopolitique du changement clima-tique), Armand Colin, Perspectives géopolitiques, 255p.
Goldemberg J. and Tadeo Prado L. (2010), “The ‘decarbonization’ of the world’s energy matrix”, Energy Policy, Vol. 38, pp. 3274-3276.
IEA (2008), CO2 Capture and Storage – A key carbon abatement option, OECD/IEA, ISBN 978-92-64-041400, 266p.
IPCC (2007), Climate Change 2007, Fourth Assessment Report (AR4).
Katofsky R., Stanberry M., Frantzis L., Achieving climate stabilization in an insecure world: does renewable energy hold the key? Report International Energy Agency - Re-newable Energy Technology Development (2010).
Luckow P., Wise M., Dooley J.J., Kim S., Large-scale utilization of biomass energy and carbon dioxide capture and storage in the transport and electricity sectors under stringent CO2 concentration limit scenario, International Journal of Greenhouse Gas Control, Vol. 4, (2010), pp. 865-877.
Obersteiner M., Azar C., Kauppi P., Möllersten K., Moreira J., Nilsson S. (2001), Managing Climate Risk, Science, 294, 5543, (2001), pp. 786–787.
Loulou R. and Labriet M., ETSAP-TIAM: the TIMES integrated assessment model (Part I: Model structure), Computational Management Science, doi: 10.1007/s10287-007-0046-z, (2007a)
Ricci O. and Selosse S. (2011), Global and regional potential for biomass energy with carbon capture and storage, International Conference on Carbon Reduction Technologies (CaRe Tech), Polish Jurassic Highland, Poland, 19-22 September.
negotiations: Comparative analysis of Brazil, China, India, Mexico, and South Africa”, Energy Policy, Vol. 38, pp. 4582-4591
Segadelli A. (2008), Prospective market penetration of clean coal technologies in APEC de-veloping economies: influencing factors and regulatory incentives, APEC Energy Working Group on Clean Fossil Energy, 22 February.
Selosse S., Assoumou E. and Maïzi N. (2010), CO2 mitigation targets and technological
limits: Prospective analysis with the TIMES integrated assessment model (TIAM-FR), In-ternational Energy Workshop (IEW), Stockholm, Sweden, June 21-23.
Sands R., Beckman J. And Evans S. (2011), General equilibrium characterization of Bio-electricity with carbon dioxide capture and storage (CCS), International Energy Workshop, Stanford University, July 6-8.
Stephens J.C. and van der Zwaan B. (2005), “CO2 Capture and Storage (CCS): exploring
the research, development, demonstration, and deployment continuum”, BCSIA Discus-sion paper, Harvard University
van den Broek M., Veenendaal V., Koutstaal P., Turkenburg,W. And Faaij A. (2011), Impact of international climate policies on CO2 capture and storage deployment: Illustrated in the Dutch energy system, Energy Policy, 39, pp. 2000–2019.
van Vuuren, D., Den Elzen, M., Lucas, P., Eickhout, B., Strengers, B., et al (2007). Stabili-zing greenhouse gas concentrations at low levels: an assessment of reduction strategies and costs, Climatic Change, Vol. 81, pp. 119-159.
van Vuuren, D., van Vliet, J., Stehfest, E. (2009). Future bio-energy potential under various natural constraints. Energy Policy Vol. 37, pp. 4220-4230.
Vieillefosse A. (2009), Climate change (Le changement climatique), La Documentation Française, 180p.
Contact
Nadia MAÏZI
Directrice du Centre de Mathématiques Appliquées (CMA)
MINES ParisTech / CMA Rue Claude Daunesse BP 207
06904 Sophia Antipolis
Tel: +33(0)4 97 15 70 79 / Fax: +33(0)4 97 15 70 66 Courriel: nadia.maizi@mines-paristech.fr
Jean-Charles HOURCADE
Directeur du Centre International de Recherche sur l’Environnement et le Développemenr (CIRED)
CIRED
Campus du Jardin Tropical 45 avenue de la Belle Gabrielle 94736 Nogent sur Marne Cedex
Tel: +33(0)1 43 94 73 63 / Fax: +33(0)1 43 94 73 70 Courriel: hourcade@centre-cired.fr