HAL Id: hal-03035538
https://hal-cnrs.archives-ouvertes.fr/hal-03035538
Submitted on 2 Dec 2020HAL is a multi-disciplinary open access archive for the deposit and dissemination of sci-entific research documents, whether they are pub-lished or not. The documents may come from teaching and research institutions in France or abroad, or from public or private research centers.
L’archive ouverte pluridisciplinaire HAL, est destinée au dépôt et à la diffusion de documents scientifiques de niveau recherche, publiés ou non, émanant des établissements d’enseignement et de recherche français ou étrangers, des laboratoires publics ou privés.
R2D2 spherical TPC: first energy resolution results
R Bouet, J Busto, V Cecchini, C Cerna, A Dastgheibi-Fard, F Druillole, C
Jollet, P Hellmuth, I Katsioulas, P Knights, et al.
To cite this version:
R Bouet, J Busto, V Cecchini, C Cerna, A Dastgheibi-Fard, et al.. R2D2 spherical TPC: first energy resolution results. arXiv , 2021, 16, pp.P03012. �10.1088/1748-0221/16/03/P03012�. �hal-03035538�
R2D2 spherical TPC: first energy
resolution results
R. Bouet
aJ. Busto
bV. Cecchini
a,fC. Cerna
aA. Dastgheibi-Fard
cF. Druillole
aC. Jollet
aP. Hellmuth
aI. Katsioulas
dP. Knights
d,eI. Giomataris
eM. Gros
eP. Lautridou
fA. Meregaglia
a,1X. F. Navick
eT. Neep
dK. Nikolopoulos
dF. Perrot
aF. Piquemal
aM. Roche
aB. Thomas
aR. Ward
dM. Zampaolo
caCENBG, Université de Bordeaux, CNRS/IN2P3, F-33175 Gradignan, France bCPPM, Université d’Aix-Marseille, CNRS/IN2P3, F-13288 Marseille, France cLSM, CNRS/IN2P3, Université Grenoble-Alpes, Modane, France
dSchool of Physics and Astronomy, University of Birmingham, B15 2TT, United Kingdom eIRFU, CEA, Université Paris-Saclay, F-91191 Gif-sur-Yvette, France
fSUBATECH, IMT-Atlantique, Université de Nantes, CNRS-IN2P3, France
Abstract. Spherical gaseous time projection chamber detectors, known also as spherical
proportional counters, are widely used today for the search of rare phenomena such as weakly interacting massive particles. In principle such a detector exhibits a number of essential features for the search of neutrinoless double beta decay (ββ0ν). A ton scale experiment using a spherical gaseous time projection chamber could cover a region of parameter space relevant for the inverted mass hierarchy in just a few years of data taking. In this context, the first point to be addressed, and the major goal of the R2D2 R&D effort, is the energy resolution. The first results of the prototype, filled with argon at pressures varying from 0.2 to 1.1 bar, yielded an energy resolution as good as 1.1% FWHM for 5.3 MeV α tracks having ranges from 3 to 15 cm. This is a milestone that paves the way for further studies with xenon gas, and the possible use of this technology for ββ0ν searches.
1
Corresponding author
Contents 1 Introduction 1 2 R2D2 setup 3 2.1 Detector description 3 2.2 Custom electronics 5 2.3 Operation 6 3 Simulation 8 4 Signal treatment 9 5 Results 15 5.1 Detector stability 15 5.2 Energy resolution 17 6 Future improvements 19 7 Conclusions 20 1 Introduction
Determining the nature of neutrino has now become a necessity in the field of particle physics, and in the related domains of astrophysics or cosmology. The neutrino could be a Majorana particle (i.e. its own anti-particle) or a Dirac particle (neutrino and anti-neutrino are distinct particles) and the most sensitive way to elucidate this property is to look for neutrinoless double beta (ββ0ν) decay forbidden by the SM [1, 2]. Such a process requires that the neutrino is a Majorana particle, and an observation would clarify its nature and would provide the most sensitive laboratory technique for measuring the neutrino mass. Furthermore, the observation of ββ0ν decay would have consequences on cosmology on our understanding of the creation of matter at the beginning of the Universe: a Majorana neutrino is mandatory in the theoretical models including a lepto-genesis phase to explain the baryon asymmetry in the Universe.
The experimental search is based on the detection of the two electrons emitted in the decay and on the reconstruction of their kinetic energy. In case of aββ0ν decay, the kinematics of the two body reaction foresees that the sum of the energy of the electrons must be equal to the transition energy Qββ. Such a peak has to be identified and distinguished from the
background issued by natural radioactivity and from the energy tail of the allowed ββ2ν decay. For this, high energy resolution, low radioactivity materials and isotopes with high Qββ must be privileged in order to operate in a region of interest (ROI) with higher energy
compared to natural radioactivity.
Nowadays the theory fails to predict the best target and the expected half-life for ββ0ν decay. There is a large panel of experimental detection techniques for rare searches, which are usually based on a pure calorimetric approach with a large target mass, and on the use of low radioactive materials. Some of them benefit, in addition, from an excellent energy resolution and/or low threshold and/or tracking. The typical experimental techniques used for ββ0ν
decay search exploit: germanium semiconductors such as GERDA [3], bolometers such as CUORE [4], gaseous or liquid TPC such as EXO-200 [5], tracking-colorimetry technique such as SuperNEMO [6], and liquid scintillators such as KamLAND-Zen [7], which achieved the best sensitivity on the effective neutrino massmββ of 65 – 165 meV depending on the nuclear
matrix elements [8]. For a comprehensive review of the different experimental searches see Ref. [9]. Despite the different techniques used, the sensitivity of almost all experiments is limited by background (in particular coming from radon contamination), which reduces the advantage given by an increase of the target mass.
Driven by the need of large detectors with zero background to improve the sensitivity on ββ0ν decay search, the Rare Decays with Radial Detector (R2D2) R&D effort aims at the development of a new concept of detector based on spherical gaseous time projection chambers (TPC) also called spherical proportional counters (SPC).
The low detection threshold capability of the SPC, down to a single ionisation electron, has been demonstrated [10]. For this reason they are today used for the search of light weakly interacting massive particles (WIMPs) as dark matter candidate by the NEWS-G collaboration [11,12]. Experimentally, there are strong similarities between searches for light dark matter candidates and searches forββ0ν decays: only few events per year are expected for detectors using targets of several tens or hundreds kg and several years of taking data. The challenge is to drastically reduce background coming from the natural radioactivity, and to reach unprecedented level of radio-purity in the detector material.
A spherical high pressure gas TPC is a detector which reduces the impact of radioactivity the most effective way, limiting the detector material. Inside the sphere the only mechanical parts are constituted by the central anode and its supporting rod. Furthermore, such a detector meets the two additional requirements needed in ββ0ν decays search: a large mass and a good energy resolution. A large isotope mass can be contained in a small volume: a sphere of 1 m radius could contain 1 ton of136Xe at a pressure of 40 bar. Concerning energy resolution, high pressure gas TPC could in principle achieve a sub-percent energy resolution at the relevant Qββ, which was demonstrated so far in ionization mode up to 60 bar [13].
Assuming an energy resolution of 1% FWHM at the xenonQββ of 2.458 MeV, the sensitivity
of a detector filled with136Xe at a pressure of 40 bars was investigated [14], and the obtained results are indeed the origin of the R2D2 R&D effort. A detector of 200 kg of136Xe could reach values of effective neutrino mass in the range 35 - 70 meV, improving the current world best sensitivity by a factor of two [7], whereas a ton scale detector could cover the inverted mass hierarchy region, measuring a neutrino effective mass of the order of 10 meV. The sensitivity of the proposed detector is shown in Fig. 1 as a function of its mass, for one year of data taking, assuming the parameters (i.e. background, energy resolution and signal efficiency) of Ref. [14].
The perspective to achieve an excellent energy resolution at the per-cent level and to develop a tracking capability inside the gas, the simplicity of the detector with only one readout channel, and the very low material budget induced by its very simple mechanical structure, make the proposed technology ideal to search for ββ0ν decays.
The path to a final ton scale detector to explore the inverted mass hierarchy region involves several intermediate steps to validate the different detector features, the first one being the possibility to reach an energy resolution of 1% FWHM at 2.458 MeV. To validate this critical point a prototype, conceived and built at CENBG, has been filled and then operated with 98% argon + 2% methane in order to verify all the technical aspects and to fully characterise the detector response.
0 200 400 600 800 1000 Detector mass (kg) 4 − 10 3 − 10 2 − 10 1 − 10 1 > (eV)β β <m
Figure 1: Allowed regions for the e↵ective Majorana mass as a function of the lightest neutrino mass, m1for normal ordering (cyan, HN) and m3for inverted ordering (blue, HI). The oscillation parameters are varied within 3 ranges while the Majorana CP phases are treated as free parameters. The horizontal band is the excluded region of the e↵ective Majorana mass parameter by current neutrinoless double-beta decay measurement, while the vertical band is the excluded region of the mass scale by cosmological observations.
The experimental search is based on the detection and measurement of the sum of the kinetic energies of the two emitted electrons which must be equal to the Q-value of the transition, Q2 , if the electrons are the only light particles
in the final state, as happens for example in the case of light neutrino exchange mechanism. Therefore, the sensitivity of the experiments will depend on their capability to distinguish this process from the background dominated by the ambient natural radioactivity and by the allowed 2⌫2 decay. Huge e↵orts have been made in these last decades to improve the particle identification and the energy resolution of the detectors. In parallel, production and selection of radiopure materials as well as new anti-radon strategies continue to be developed. The detectors must also be able to accommodate large isotope masses, today typically of the order of few tens or hundreds of kilograms, depending on the experimental approach. Investigating di↵erent isotopes is also part of the strategy in a context where theoretical predictions are not reliable enough yet.
Most of the 0⌫2 experiments exploit a homogeneous approach, i.e. the detector coincides with the source, enhancing the efficiency for the collection of the electrons emitted in the decay. It is the case for the germanium semiconductors (GERDA, MAJORANA, LEGEND), bolometers (CUORE, CUPID, AMoRE), gaseous or liquid TPC (NEXT, PANDA-X-III, EXO-200, nEXO), crystals at ambient temperature (COBRA, CANDLES, AURORA) and liquid scintillators (KamLAND-Zen, SNO+). This last technology reached the best sensitivity on m — m < 65 165 meV depending on the nuclear matrix elements — with the KamLAND-Zen experiment exploiting 1000 tons of liquid scintillator loaded with xenon-136 (350 kg). A di↵erent approach consists in separating the source and the detector. The loss of efficiency is compensated by the better topological reconstruction of the single electrons, which could be very appealing in case of discovery. The NEMO detectors are the only ones to have proven the technology feasibility with a gaseous tracker volume surrounded by a scintillator calorimeter. The already measured or expected sensitivities of most of the projects are given in Figure 2.
2
SuperNEMO
The SuperNEMO detector capitalizes on a unique tracker/calorimeter detection technique (”tracko-calo”) which was successfully operated with the NEMO-3 experiment (running from 2003-2011 at the LSM underground laboratory) [14]. This technology has been initiated in the 1980’s in France playing an important role in the development, exploitation and management of the successive NEMO projects.
Today the collaboration consists of 21 laboratories from 9 countries (France, Czech Republic, Finland, Japan, Russia, Slovakia, UK, Ukraine, US) including 6 IN2P3 laboratories: CENBG, CPPM, LAL, LAPP, LPC-Caen and LSM.
The full SuperNEMO detector has been designed to hold 100 kg of double-beta decay isotope (selenium-82 as baseline) to reach a sensitivity of the order of 1026 years to the half-life of decay, corresponding to a 50–100 meV
e↵ective Majorana neutrino mass (Figure 2, points SN-Se and SN-Nd for 100 kg of selenium-82 and neodynium-150 respectively).
SuperNEMO is a detector with multi-observables that allows full topological reconstruction of events resulting in a powerful background rejection. A background index b⇠ 8 ⇥10 5 counts/(keV.kg.y) is expected in the region
of interest. The topological reconstruction and the kinematic information on individual particles (single energy, 2
Figure 1. Expected sensitivity for neutrinoless double beta decay search using a SPC in terms of its mass assuming the parameters of Ref. [14] for one year of operation (left). The width of the blue band is due to the uncertainty on the nuclear matrix elements which are used to convert the limit on the
lifetime to the limit on the effective mass. The allowed regions for the effective neutrino mass mββ
as a function of the lightest neutrino mass for normal and inverted hierarchy are also shown (right) with the same vertical scale for a direct comparison.
Despite the final experiment will use xenon as gas to fill the detector, operating the detector with argon represents an efficient and cost-effective manner to access all the technical aspects of the detector while optimizing the xenon recuperation system. Indeed argon is wasted at each filling whereas xenon is quite expensive and needs to be recovered and possibly purified at each filling. In addition the energy resolution should be intrinsically better in xenon since the number of electrons produced for a given deposited energy is higher with respect to argon [15], making the energy resolution obtained with argon a conservative limit.
To exploit the most the particular electrostatic topology of the spherical TPC, and achieve the best possible performances, intensive use of signal processing techniques becomes also critical. The signal treatment is fundamental to extrapolate information on the events, such as the track direction, from the specific features of the waveforms. The comparison of the data taken with the prototype with the simulated ones is important to validate this point and confirm our understanding of the detector response.
In this paper we report on measurements carried out with α sources, in particular to evaluate the energy resolution for long penetrating α tracks inside the detector. A detailed data-simulation comparison and signal treatment analysis are also presented showing a deep understanding of the detector response.
2 R2D2 setup
2.1 Detector description
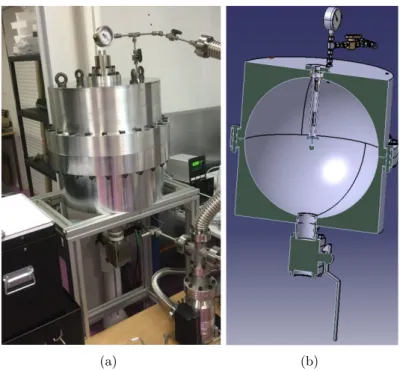
The R2D2 setup consists of a 20 cm radius sphere for a volume of approximately 33.5 L which could contain about 7.9 kg of xenon at a pressure of 40 bars. Given that high-radiopurity is not critical at this stage of the investigations, aluminium was chosen for the detector construction. Such a choice was driven by the in-house capabilities of CENBG of machining aluminium allowing for cost containment. The detector was built starting from two cylindrical
(a) (b)
Figure 2. Actual realisation (a) and mechanical drawing (b) of the R2D2 detector. The two
hemi-spheres can be seen as well as the pressure gauge, the HV connectors on top of the detector, and the large valve at the bottom to allow for the insertion of a radioactive source.
blocks of aluminium which were machined in order to form two semi-spheres inside, and then bolted together as shown in the mechanical drawing in Fig2.
The anode at a positive high voltage, leading to the drift of the ionisation electrons and their subsequent amplification to form the observed signal, is located at the centre of the grounded sphere. The sensor [16] (i.e. the central anode) consists of a 2 mm diameter stainless steel sphere connected to an insulated wire of 150 µm diameter, which is held in place by a supporting grounded rod. More details on the detector working principle and on the sensor itself can be found in Ref. [11,17,18].
Electronics play a critical role in the detector operation since the requirements in terms of low noise, and immunity to radio frequency interferences (RFI), to achieve a good energy resolution are relatively stringent. Details on the specific developments are given in Sec. 2.2, whereas the main elements of the electronic chain are listed below:
• HV splitter. The HV cable connecting the sensor to the power supply is also used to extract the signal: to separate the signal a dedicated splitter box has been prepared at CENBG.
• Preamplifier. A preamplifier for impedance matching, shaping and amplification of the signal is needed before passing it to the acquisition card. For that we used a custom made low noise resistive feedback charge sensitive preamplifier, with an adapted frequency bandwidth, conceived at CENBG in the framework of the OWEN project [19].
• HV power supply. HV power supply can be an important source of detector instability and a possible source of noise. We used a commercial CAEN power supply DT8034 [20]
Rf Cf Q sensor HV Vo (t) polarization T1 JFET (a)
The layout of the preamp (Figure 5) has been optimized for noise and parasitic
capacitance. The pinout is pin compatible with the CREMAT CR-110, which is our
reference.
Figure 5: OWEN Charge Sensitive Preamplifier.
In order to polarize the sensor, the preamplifier is coupled to a high voltage filter
described in the simplified circuit above. A noise measurement was made under these
conditions. For comparison, with the high voltage filter, the equivalent noise charge for
the CREMAT CR-110 is 856e
-
and 566e
-
for the OWEN preamp (figure 6a 6b).
Figure 6a: Baseline noise measurement (CREMAT on left, OWEN on right)
Figure 6b: Response of 1fC input charge (CREMAT on left, OWEN on right)
(b)Figure 3. (a) Simplified circuit of the OWEN charge sensitive preamplifier with polarisation. The
dashed box represents the HV splitter box. (b)Final realisation of the OWEN charge sensitive
pream-plifier.
with a current monitor at the level of 0.5 nA and a voltage ripple below 10 mV. • DAQ. The DAQ is done using a CALI card developed for, and widely used by spherical
gaseous detectors such as NEWS-G experiment [11], read by the SAMBA acquisition software [21].
2.2 Custom electronics
A charge sensitive preamplifier was developed at CENBG in the framework of the OWEN (Optimal Waveform recognition Electronic Node) project [19]. This circuit integrates the current signal coming from the sensor on the feedback capacitance Cf, then it generates an
output voltage signal which is proportional to the original input charge Q registered by the central anode. The output voltage signal slowly decreases according to the time constant τ . As shown by the equivalent circuit (see Fig. 3(a)), the relation between the output voltage pulse Vo(t) and the decay time constant τ is given by:
Vo(t) =−
Q Cf
e−t/τ. (2.1)
From equation2.1, it can be seen that the signal charge pulses Q collected by the sensor are converted into voltage pulses with amplitude Vo(0) =−Q/Cf and τ = Rf × Cf. In our case
the value of the feedback capacitor Cf is 1.5 pF and the one of the feedback resistor Rf is
100 MΩ.
The architecture of the preamplifier is based on the established design by T.V. Blalock [22]. Usually, the preamplifier uses a Field Effect Transistor (FET) as an input element associated with a bipolar transistor to form a cascode. In order to improve the gain bandwidth product (GBW), a transistor T1 used as a current amplifier is inserted between the FET and the bipolar transistors as shown in Fig.3(a).
Table 1. Full specification of the OWEN preamplifier.
Gain 0.75 V/pC
Customizable gain Yes Feedback Cf 1.5 pF FeedbackRf 100 MΩ Decay time 150 µs Baseline noise 920 µV pp Risetime 93 ns SNR 1868 Linearity 1 fC to 2 pC Cost 20 euro
The layout of the preamplifier shown in Fig. 3(b) has been optimized in terms of noise, frequency bandwidth, and parasitic capacitance. The pinout is pin compatible with the CREMAT CR-110-R2 [23], which was used for the first tests on detector stability. In order to polarize the sensor, the preamplifier is coupled to a high voltage filter shown in the dashed box of Fig.3(a).
To evaluate the performance of the preamplifier, a noise measurement was carried out. The full specifications of the OWEN preamplifier can be found in Tab. 1. The HV splitter was based on an existing one developed for the SEDINE [24] detector and an optimization for the R2D2 detector is foreseen for a possible further reduction of the electronic noise.
The gain of the CREMAT preamplificator is 1.4 V/pC whereas for the OWEN preamplifier a gain of 0.75 V/pC was measured. This difference is due to an additional amplification stage which was avoided in the OWEN preamplifier. The OWEN preamplifier meets the low noise requirements needed by the R2D2 detector and it was therefore chosen as baseline option. In addition, the OWEN preamplifier has the advantage of having customizable parameters allowing for a better matching between the filter and the preamplifier bandwidth acceptance.
2.3 Operation
For a good detector performance, contamination of the gas volume with electronegative im-purities has to be minimised. In particular the presence of oxygen would result in a loss of signal radially dependent, degrading the achievable energy resolution. The ArP2 mixture (i.e. 98% Ar and 2% CH4) is extremely pure with a contamination at the level of 1 ppm, which is sufficient for our detector as demonstrated by the results presented in this paper.
The detector has been heated for several weeks at 80◦C in order to reduce the material outgassing during operation, and it is systematically pumped to a vacuum at the level of 10−6 mbar before each filling. The limiting factor comes from the oxygen contamination in the gas: a vacuum of 10−6 mbar corresponds to a purity of 5 ppb at 1 bar, negligible with respect to the gas contamination at the level of 1 ppm. The system leakage was also measured with an helium leak tester and no leak was observed at the level of 5× 10⁻⁹ mbar/s. The
main contribution to vacuum loss is therefore due to outgassing of materials and a value of 2× 10⁻⁶ mbar/s was measured. Such a value is acceptable in this R&D phase assuring a good detector stability for several weeks.
Alpha source (6 mm x 6 mm support) flat on sphere with alphas
emitted isotropically Po 210 alphas of 5.3 MeV Source support Supporting rod cos θ=0 cos θ=-0.5 cos θ=-1 (a) Central anode (1 mm radius) Supporting rod HV connector Rod supporting metal ring Ground connection for the supporting rod
Viton joint for mechanical decoupling
of the supporting rod
20 cm
210Po source
(b)
Figure 4. (a) 210Po α source setup. The colour code represents the initial direction of the emitted
α-particles which corresponds to the one used in the plots showing the output of the simulation. (b)
Schematic drawing of the experimental setup showing the central sensor support and the 210Po α
source.
the final experiment will observe electrons, at pressures below 10 bar it is very difficult to contain them in the small detector volume, therefore α particles were used despite their ionisation quenching [25].
A 210Po source producing a singleα of 5.3 MeV with an activity of 4 Bq was used, allowing to quickly evaluate the detector gain. The main drawback of such a source is the electric field distortion due to the source itself and its support (see schematic drawing in Fig. 4(a)). Although the source is on the outer surface to minimise potential perturbation of the electric field, a weak distortion could still be present being more relevant for short alpha particle tracks i.e. at high pressure. Furthermore some α particles lose part of the energy in the source support yielding a low energy tail which slightly spoils the gaussian peak we want to measure as explained in Sec. 5.2.
The detector is sensitive to acoustic and electronic noise as well as to temperature vari-ations. To work in the best available condition, the R2D2 prototype was installed at the PRISNA facility [26] at CENBG, where the temperature is kept constant within 1 degree and human activity is reduced the most. All the electronic devices have been grounded to a large metallic plate on which the detector is hosted, and all commercial power supplies have been replaced with laboratory power supplies to reduce the electronic noise. To reduce vibrational noise impacting the baseline stability, and therefore the resolution, the sensor supporting rod has been mechanically decoupled from the rest of the detector through a joint as shown in Fig.4(b). A sizable impact on the noise reduction at low frequencies was observed (factor of about 2 at 60 Hz) and for the next detector upgrade a dedicated system to reduce vibration on the central sensor will be developed.
1 10 102 3 10 104 E-Field Strength [V/cm] 0 5 10 15 20 25 s] µ Drift Velocity [cm/ (98%:2%) 4 Ar:CH 200 mbar 1100 mbar (a) 1 10 102 3 10 104 E-Field Strength [V/cm] 0 0.05 0.1 0.15 0.2 0.25 0.3 0.35 0.4 ] 1/2
Transverse Diffusion Coefficient [cm
(98%:2%) 4 Ar:CH 200 mbar 1100 mbar (b) 1 10 102 3 10 104 E-Field Strength [V/cm] 0 0.05 0.1 0.15 0.2 0.25 0.3 0.35 0.4 ] 1/2
Longitudinal Diffusion Coefficient [cm
(98%:2%) 4 Ar:CH 200 mbar 1100 mbar (c)
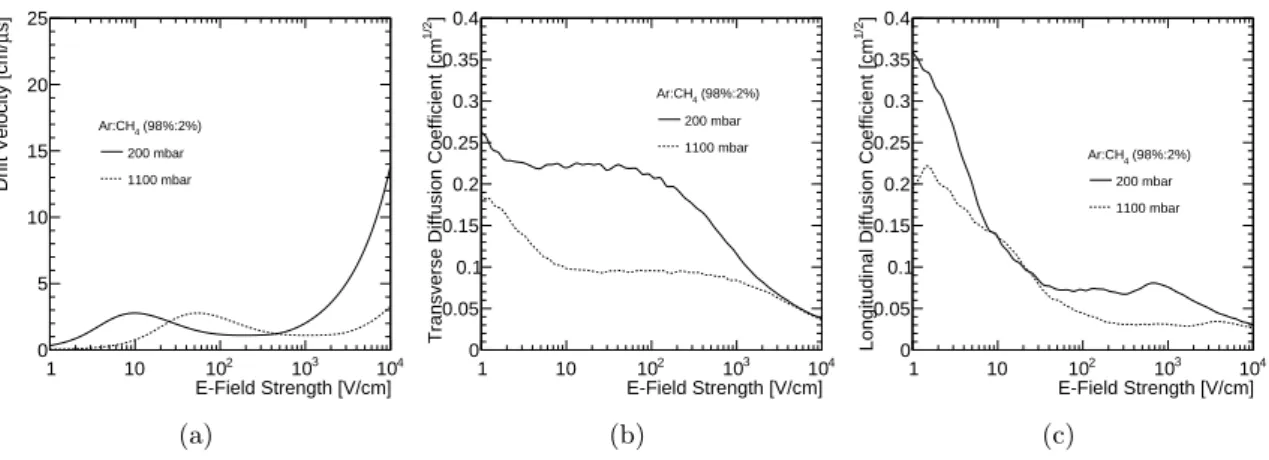
Figure 5. Electron transport parameters ((a)drift velocity, (b) transverse and (c) longitudinal
dif-fusion coefficients) as a function of the electric field in Ar:CH4 98%:2% as estimated by Magboltz at
200 mbar and 1.1 bar.
3 Simulation
The framework presented in Ref. [27] has been used to simulate the experimental set-up, combining Geant4, a toolkit for the simulation of particle interactions with matter [28], and Garfield++, a toolkit for the detailed simulation of gaseous particle detectors [29, 30]. Garfield++ interfaces to Heed, for particle interactions [31], and Magboltz, for modelling electron transport parameters in gases [32]. The electric field in the detector is described using the ANSYS finite element software [33].
The electron transport parameters in the gas mixture, crucial input to the simulation, are estimated using Magboltz. In Fig. 5, the drift velocity, as well as the longitudinal and trans-verse diffusion coefficients are presented for the two gas pressures considered in this study i.e. 200 mbar and 1.1 bar.
The gain of the gas mixture is typically governed by the Townsend coefficient, however, in gas mixtures like Ar:CH4the Penning effect is observed. The methane ionisation potential
is lower than the ionisation potential of argon, and potential ionisations of the latter may lead to ionisation of the former. In the calculations a transfer probability of 15% [34] was used. Electro-negative molecules, like O2, tend to attach electrons, which subsequently do not
contribute to the signal formation. The attachment coefficient for ArP2 at 200 mbar with different levels of O2 contamination are presented in Fig. 6. The presence of methane in the
gas mixture leads to attachment in regions with large electric field values, whereas oxygen results in attachment in regions with low magnitudes of the electric field, which, due to the 1/r2 radial dependence of the electric field, cover the vast majority of the gas volume. The
probability of an electron to give an avalanche is shown in Fig. 7(a) as a function of the electron initial position for different levels of impurities at 200 mbar with anode voltage at 720 V. The corresponding probability for ArP2 at 1.1 bar with anode voltage at 2000 V is shown in Fig. 7(b). From these results it is evident that minimising the amount of impurities is of paramount importance.
The comparison of the simulated signal to registered waveforms (see Fig. 9 in Sec. 4) shows a good agreement. This simulation can therefore be used to investigate the properties
1 10 102 3
10 104
Electric Field Strength [V/cm]
5 − 10 4 − 10 3 − 10 2 − 10 1 − 10 Attachment Coefficient [1/cm] (98%:2%) 200 mbar 4 Ar:CH Contamination 2 O 5 ppm 1 ppm 0.5 ppm 0.2 ppm 0.1 ppm 0 ppm
Figure 6. Attachment coefficient as a function of electric field in ArP2 for different level of O2
contamination at 200 mbar. 2 4 6 8 10 12 14 16 18 20 Starting Position [cm] 0 0.1 0.2 0.3 0.4 0.5 0.6 0.7 0.8 0.9 1
Probability of Avalanche (Normalised to Pure)
Contamination 2 O (98%:2%) 4 Ar:CH 5 ppm 1 ppm 0.5 ppm 0.2 ppm 0.1 ppm 0 ppm (a) 2 4 6 8 10 12 14 16 18 20 Starting Position [cm] 0 0.1 0.2 0.3 0.4 0.5 0.6 0.7 0.8 0.9 1
Probability of Avalanche (Normalised to Pure)
Contamination 2 O (98%:2%) 4 Ar:CH 5 ppm 1 ppm 0.5 ppm 0.2 ppm 0.1 ppm 0 ppm (b)
Figure 7. The survival probability of an electron as a function of its initial position for different
levels of O2 contaminations: (a)for ArP2 at 200 mbar and an anode voltage of 720 V, and (b) for
the same gas mixture at a pressure of 1.1 bar and anode voltage of 2000 V.
of the events. In Sec. 4 several variables extracted from the signal waveforms are presented and used to extract events properties such as α direction or mean distance from the anode. Those variables are benchmarked with the simulation to validate the obtained distributions, confirming our correct understanding of the detector behaviour.
4 Signal treatment
Signal formation in SPC is subject to three main effects which make the analysis of long tracks more complicated with respect to the conventional treatment already established in
Figure 8. Average amplitude of the waveforms versus the frequency before filtering (blue), for the front parts of waveforms not containing a transient (orange), and after filtering (green).
the case of point-like energy deposits [12,35].
The mean drift time to the anode of primary electrons (PEs) produced in the initial ionization of the gas depends on their production point in the detector volume. For detectors larger than∼ 10 cm in radius, due to the electric field dependence of 1/r2 (wherer is the distance from the central anode), the drift time can be as large as tens of µs (even much larger if low voltages are applied to the anode). Along the drift, electrons are also subject to a Gaussian diffusion whose standard deviation increases as r3. Both mechanisms entangle and introduce
a significant temporal dispersion, even for electrons produced at the same time. When the electrons reach the high field region, approximately 1 mm from the sensor, the avalanche produces the ions which slowly drift towards the cathode, reaching the detector surface in times as long as few seconds. Since their velocity decreases while travelling in a weakening electric field, they induce less and less signal, and the stronger part of the ionic current is produced in the first hundreds of µs of this displacement. Combined with the bandwidth of our electronics (i.e. < 100 MHz), the ionic contribution becomes then the dominant current which is integrated by the resistive feedback charge sensitive amplifier. Merged with the time constant (RC = 150 µs) of the amplifier, all these effects lead to a significant ballistic deficit. The maximum amplitude of the signal no longer faithfully reflects the deposited energy, and its rise time no longer depends entirely on the initial location of the event. To correct for this bias, the raw waveform (or voltage pulses) of the amplifier has been deconvoluted assuming a simple exponential decay i.e. e−t/RC for its impulse response.
The processing chain for extracting our observables starts recording the raw amplifier wave-form S(i) of 4166 samples digitized at a sampling frequency f e of 2.08 MHz with a transient located at 50% of the waveform length. A baseline correction to zero is applied to the raw signal before applying the deconvolution algorithm. In order to attenuate a part of the radio-frequency interference captured during the readout process, several types of composite filtering can be used [36,37] depending of the observed level on noise (see fig.8).
Finally, before computing the deconvoluted waveform, the raw one is renormalized by the impulse response of the amplifier following:
S(i) = S(i)/(RC/te) (4.1)
wherete is the sampling period (te = 1/f e) and RC/te =Pn=∞
n=0 e(−n∗te/RC).
As a cross check, the computation of the deconvoluted signal has been performed both in the frequency domain and directly in the temporal domain [38,39]. For each raw and deconvoluted waveform, an amplitude threshold is determined at 3 standard deviations from the noise calculated using the first part of each waveform in the interval of sample [0 – 1750]. The first sample crossing the thresholds is kept as a starting marker for the determination of the observables described below. The variables related to signal amplitude or integral are given in DAQ units (ADU) whereas the temporal ones are given in µs. Usually, 3 observables can be extracted from the raw signal of the integrator, as shown in Fig.9(a):
• The integral of the transient, Ct, which correspond to the area of the transient defined in the sample interval [threshold marker – 4166].
• The rise time of the transient, Rt, defined as the duration of the sample interval [thresh-old marker – sample of the maximum].
• The maximum amplitude, Ma, of the raw signal.
For the deconvoluted signal, which corresponds to the initial induced current, 4 primary observables can be declined in order to describe the great variety of shapes:
• The integral of the transient, Qt, calculated as the area of the transient for the sample interval [threshold marker – 4166]. This quantity, which must be equal to Ct, makes it possible to verify the accuracy of the calculation of the deconvoluted signal.
• The total duration of the transient, Dt, defined as the time over threshold. It enables to estimate the signal width, without the long tail of the total ion train.
• The full width at half maximum, Dh, which is dedicated to evaluating the width of the current distribution, in particular with respect to Dt.
• The maximum amplitude Ad, of the deconvoluted signal.
From these direct observables, 2 additional quantities, of composite natures, were also derived to further characterize the shape of the current signal:
• The peak time Pt, giving the sample location of the signal maximum as a percentage of Dt, using : Pt (%) = Pt (s)× 100 / Dt (s). It indicates the location of the maximum of signal in unit of Dt, and gives the direction of the track relative to the anode as shown in Fig. 10.
• The ionization density Di = Qt / Dh, which aims to quantify, in another way, the temporal distribution of the PEs upon their arrival at the anode. Although not formally demonstrated in this work, this observable seems to be particularly sensitive to the average distance of the trace to the cathode (several other combinations of primary observables - such as Ad/Qt, Ma/Rt, Ct/Rt, etc. - seem to provide similar information).
Pt Dt Rt Ma Qt Ct Ad Dh (a) 0 20 40 60 80 100 t [ s] 0 10 20 30 40 50 A.U. Pulse Current (b)
Figure 9. (a)Real pulse with definition of observables used for the raw signal and for the deconvoluted
one. (b)Example simulated pulses, showing both the current and voltage signals.
Anode
Po 210 source -
a (5.3 MeV) emitted in
4p srCathode (3) (2) (4) (qp/2) (1) (q=p) a range Anode rod Blob position (~direction)
*
Shape of the current (~distance)Figure 10. Interpretation of observables in relation to the different configurations of the tracks and geometry of the detector. The four typical configurations of tracks (labelled 1, 2, 3, and 4) correspond
In Fig. 9(b)a simulated pulse produced by a 5.3 MeVα particle is shown to be compared to the real signal of Fig. 9(a). In the example both the current and voltage pulses are shown, equivalent to the deconvoluted and raw signals, respectively.
Typical 2D distributions are presented in Fig. 11and compared to the usual representation, rise time versus maximum amplitude (Ma, Rt) (see Fig. 12), historically used for analyzing the output signals of the charge integrator [40]. As it can be seen in Fig. 12, with the210Po source, the ballistic deficit induces a significant spreading of the source spot. The combination of Ma and Rt observables does not provide a correct interpretation of the energy deposited. This is no longer the case using Ct and Qt. The data can be compared directly to the expected 2D distributions obtained with the simulation and the agreement is very good (see Fig. 11) both in terms of pattern and on the absolute time scale. Such an agreement could be reached after including the electronic noise in the simulation.
Some characteristics of long tracks can be inferred from the introduced observables. In this context, the peak time Pt allows in addition to estimate the direction of the track relative to the anode. Indeed, for a track subject to a significant energy deposit at its end (Bragg peak), the deconvoluted signal must show a peak corresponding to this deposit. Therefore, a track pointing towards the anode will present a maximum close to the beginning of the signal, leading to a Pt in the range (0% < Pt < 50%). This corresponds to typical configurations of the tracks labeled 1, 2 and 3 in Fig. 10. Tracks pointing towards the cathode will present instead a maximum in the second part of the signal (50% > Pt > 100%). This is indeed confirmed by the simulation results of Fig.11(d) where the direction of tracks is represented by the colour scale: the colour indicates the initial zenithal direction of the α particle, where cos θ = −1 denotes an α particle emitted directly towards the anode (see Fig. 4(a) for a graphical explanation).
Given the overall signal formation mechanism, for uniform primary ionizations, interpretation of Pt is more complex. For a deposit developing perpendicular to the radius, both ends of the track have identical radial distances to the anode. The maximum of the signal will be approximatively located halfway along the track (at the minimum impact parameter point relative to anode). Consequently, since the deconvoluted signal will have a bell-like shape, Pt should be around 50%. Such a situation is represented by track labeled as 4 in Fig.10, which corresponds to an α-particle stopped in the cathode before losing all its energy in the gas. Considering instead other directions, the uniform ionization will lead to a similar Pt for the two orientations (towards the anode or the cathode), with a value of slightly less than 50%. These cases point out the limit of this simple model.
A more intuitive interpretation can be deduced from the observable Di shown in Fig. 11(d)
and Fig.11(f). Indeed, compared to the simulation results indexing the direction of the track, the experimental distribution of the events reasonably suggests that the Di observable could be related to the average distance from the track to the cathode.
The main features of the presented detector understanding were checked by locating in the 3-dimensional space (Qt, Dt, Rt) the events produced by a 210Po source positioned on the internal surface of the cathode. As shown in Fig. 13, the triplet of observables (Qt, Dt, Rt), extracted from the deconvoluted waveform, significantly improves the classification of interacting events inside the detector as well as the interpretation of the data.
2000 4000 6000 8000 10000 12000 14000 16000 Qt [ADU] 0 50 100 150 200 250 300 350 400 Dt [ s] 100 101 102 Events (a) 2500 5000 7500 10000 12500 15000 Qt [ADU] 0 50 100 150 200 250 300 350 400 Dt [ s] Simulation 720V, 200mbar Ar/CH4 (98/2%) 1.0 0.8 0.6 0.4 0.2 0.0 Ini tia l d ire cti on co s (b) 2000 4000 6000 8000 10000 12000 14000 16000 Qt [ADU] 0 10 20 30 40 50 Pt [%] 100 101 102 Events (c) 2500 5000 7500 10000 12500 15000 Qt [ADU] 0 10 20 30 40 50
Pt [%] Simulation720V, 200mbar Ar/CH4 (98/2%)
1.0 0.8 0.6 0.4 0.2 0.0 Ini tia l d ire cti on co s (d) 2000 4000 6000 8000 10000 12000 14000 16000 Qt [ADU] 0 1000 2000 3000 4000 5000 6000 7000 8000 Di [A DU / s] 100 101 102 Events (e) 2500 5000 7500 10000 12500 15000 Qt [ADU] 0 2000 4000 6000 8000 10000 Di [A DU / s] Simulation 720V, 200mbar Ar/CH4 (98/2%) 1.0 0.8 0.6 0.4 0.2 0.0 Ini tia l d ire cti on co s (f)
Figure 11. Example of 2D representation of events for different observables for data at 200 mbar
and 720 V (Dt vs Qt (a), Pt vs Qt(c), Di vs Qt(e)) and corresponding simulation (Dt vs Qt(b), Pt
vs Qt (d), Di vs Qt (f )). For the data the colour stands for the number of event in the bin whereas
for the simulation the color indicates the original α direction: cos θ =−1 for tracks going towards the
central anode and cos θ = 0 for tracks emitted orthogonally to the radial direction. The figures were
0 5 10 15 20 25 30 35 Ma [ADU] 20 40 60 80 100 Rt [ s] 100 101 Events (a) 0 5 10 15 20 25 30 35 Ma [ADU] 20 40 60 80 100 Rt [ s] Simulation 720V, 200mbar Ar/CH4 (98/2%) 1.0 0.8 0.6 0.4 0.2 0.0 Ini tia l d ire cti on co s (b)
Figure 12. 2D distribution of rise time Rt versus maximal amplitude of raw signal Ma for data (a)
and simulation (b). The ballistic deficit makes the Ma variable not suitable for reconstructing theα
energy. Qt [ADU] 2000400060008000 1000012000 1400016000 50 100 150Dt [ s] 200 250300 350 Pt [%] 0 10 20 30 40 50 60 (a) Qt [ADU] 200040006000 800010000 1200014000 16000 150 200 Dt [ s] 250 300 350 400 Pt [%] 0 5 10 15 20 25 0.8 0.6 0.4 0.2 Ini tia l c os d ir. (b)
Figure 13. 3D-plot of the observables (Qt, Dt, Pt) measured for the 210Po source and a pressure of
200 mb (a). The corresponding plot obtained with the simulation is also shown(b).
5 Results
5.1 Detector stability
Initially, the detector stability over time was studied to understand how the possible oxygen increase due to leakage/outgassing would impact the gain. The 210Po α source was used, placed at the bottom of the sphere at a distance of 20 cm from the central sensor as explained in Sec. 2.3.
To disentangle detector effects from changes due to the temperature or to the electronics response variations, in each run a pulse (delta shape) was injected in the test-in input of the preamplifier with a generator at a frequency of 0.5Hz. This allows not only to evaluate possible
0 20 40 60 80 100 120 140 160 180 200 220 4 4.5 5 5.5 6 6.5 7 7.5
Reconstructed Equivalent Energy (MeV)
Generator pulse 7429 ± 1 keV Source signal 5305 ± 1 keV Low energy shoulder due to the source support
Figure 14. Example of the signal integral output for a run with201Po source. The low energy shoulder
due to the source support is clearly seen.
gain variations due to electronics or external conditions, but also to control the impact of the noise on the energy resolution.
The first few hours after switching on the HV were discarded to allow the detector to reach a stability regime and then we took runs of 30 minutes. One of the output of the DAQ is the integral of the signal in ADU: this was converted into equivalent reconstructed energy assuming a linear scale using as anchor point in the conversion the 5.305 MeV α peak of the
210Po source as shown in Fig.14. These two peaks are fitted with Gaussian functions to find
the mean and its error, and those values were monitored over two weeks. Note that these runs were not good for energy resolution measurements and the width of the Gaussians are quite large. This is due to the fact that a commercial CREMAT preamplifier CR-110-R2 [23] was used in the electronic chain with the addition of two diodes to avoid damaging the preamplifier on possible discharges of the sensor. No discharges were observed and the preamplifier was eventually replaced by OWEN one (see Sec.2.2) with the advantage of having the protection diodes integrated and a reduction on the baseline fluctuation.
The time variation of the signal integral is seen in Fig. 15. The generator pulses are rather stable as expected (blue line), nonetheless for the first two days an increase of the signal value is observed. We expected to reach a signal stability more rapidly since the temperature of the electronics should normally be stable in a few hours. The cause of such an electronic gain change might therefore be a different one, probably related to external and electronic noise. The same signal increase at the beginning of the run is observed for α signals (red line). The use of a pulse generator allows us to disentangle the real variations of the detector gain since we can correct for the electronic gain eliminating such variations. We multiplied the integral
0 50 100 150 200 250 300 350 Time since the beginning of the run (hours) 80 85 90 95 100 105 ) (%) 0 Signal(t) / Signal(t Generator Source Source corrected
Figure 15. Time variation of the integral for generator pulses (blue line), α signal (red line) and α
signals corrected according to the generator pulse value (green line).
value for a factor corresponding to the gain changes of the generator:
Sc(t) = S(t)×
G(t0)
G(t)
whereSc(t) is the corrected source integral at a time t, S(t) is the original source integral at
a timet, and G(t) and G(t0) the generator signal at a time t and at the beginning of the run
(t0) respectively.
We see that once the signal is corrected we observe a gain loss in time as expected and the loss amounts to about 0.05% of the signal per hour. Such a small loss can be corrected offline and allows for a good quality data taking for periods of weeks. In addition it could be avoided reducing the leaks and materials outgassing and recirculating the gas through an oxygen removal cartridge.
5.2 Energy resolution
To compute the energy resolution we used the OWEN preamplifier to have the smallest pos-sible noise. Fluctuation of the baseline would indeed directly affect the energy reconstructed which is computed integrating the signal waveform subtracting the baseline. We obtained a baseline noise (i.e. RMS variation of baseline of a single event in 1 ms before the trigger) of about 8.2 ADU and an RMS on the baseline value (i.e. RMS of the mean baseline value of all the events) of 13.1 ADU (without the RC× fe normalisation).
With the obtained noise we achieved a width on the reconstructed pulse generator signal which corresponds to an intrinsic energy resolution of 0.5% FWHM at the α peak. Such a spread is driven by the electronic chain (preamplifier, DAQ, HV) and could eventually be the ultimate limiting factor. One of the goals of the OWEN project is indeed to develop a custom low noise readout in order to reduce the most the contribution of the electronics. The
11000 12000 13000 14000 15000 16000 17000
Qt [ADU]
40
50
60
70
80
90
100
110
Dh
[
s]
10
010
1Events
Figure 16. Two dimensional plot of signal width at half maximum Dh versus the measured charge
Qt of the 5.3 MeVα signal at 1.1 bar and 2000 V.
resolution of the α events is of course much worse since we have to account for the smearing due to the source itself (estimated to about 0.4%), and for possible inhomogeneities on the central anode (i.e. different gain depending on the starting point of the ionization electrons). The signal treatment presented in Sec. 4 was applied to the registered waveforms of a run taken at 1.1 bar with a voltage of 2000 V on the central anode. To have a cleaner sample and eliminate tracks hitting the cathode, signals with a width at half maximum smaller than 65 µs are excluded as it can be seen in Fig. 16, where the low energy tail would be removed with the applied cut. The reconstructed charge Qt, converted into visible energy as done in Sec. 5.1, shows a resolution of 1.2% FWHM as presented in Fig. 17(a), where we excluded from the fit the remaining low energy shoulder due to tracks hitting the source support. Such a tail is anyway intrinsic to the source itself (i.e. deposited Po on silver support): despite the Po has been deposited on the silver surface a Geant4 simulation showed the existence of such an energy loss for α particles crossing very tiny amounts of material at the level of 100 nm. This means that the deposit itself could screen some alphas emitted more in the core of the Po source producing the observed tail at energies lower than the expected alpha emission one.
One important point to assess is to make sure that the energy resolution is not degraded going from point-like energy depositions to long tracks, which would be the case for the electrons emitted in the ββ decays. At 1.1 bar, α signals are not point-like energy deposits but rather tracks of 3–4 cm. To further study this point, a run at 200 mbar with a HV of 720 V was taken where the α tracks have a mean length of about 15 cm. The high voltage
0 100 200 300 400 500 600 5.1 5.2 5.3 5.4 5.5 5.6 5.7
Reconstructed Equivalent Energy (MeV)
1.2% FWHM resolution (a) 0 200 400 600 800 1000 1200 5.1 5.2 5.3 5.4 5.5 5.6 5.7
Reconstructed Equivalent Energy (MeV)
1.1% FWHM resolution
(b)
Figure 17. Integral of the 5.3 MeVα signal at 1.1 bar and 2000 V(a)and at 200 mbar and 720 V(b).
The Gaussian fit in red shows an energy resolution of 1.2% FWHM and 1.1% FWHM respectively.
was tuned in order to have almost the same gain as in the run at 1.1 bar. The obtained energy resolution is 1.1% FWHM, which is better than the resolution obtained at 1.1 bar, demonstrating that the resolution is not degraded when tracks are long. Results for such a run are shown in Fig.17(b). The possible explanation for the improvement at low pressure is that longer tracks are less affected by electric field distortions around the source support. In additions such tracks reach regions closer to the central sensor and are therefore less affected by electronegative impurities as detailed in Sec. 3.
If we subtract quadratically to the resolution the contribution due to the electronics and the source (i.e. 0.6% overall) we obtain 0.97% which is not far from the ultimate detector require-ment (i.e. 1% at 2.458 MeV). Further improverequire-ments will come from a more homogeneous and spherical sensor and from a reduction of the baseline fluctuation affecting the signal integral. Note that, for ArP2, the expected intrinsic energy resolution due to stochastic fluctuation of the number of generated electrons-ion pairs is expected to be 0.24%.
The excellent energy resolution is an important milestone in the R2D2 project demon-strating that the energy resolution of the spherical TPC detector is not affected by long tracks. This is a crucial condition for the final goal of the project i.e. the search of the ββ0ν process where long electron tracks have to be measured.
6 Future improvements
The R&D roadmap foresees measurements at high pressure to see if and how the gain changes since the proposed detector forββ0ν decay search is expected to be filled with xenon at 40 bar. The actual prototype allowed for a first evaluation of the energy resolution at low pressure with argon, however the device is not certified to be operated at high pressure. A sphere certified to allow for measurements up to 40 bars is under conception.
Another important point to control and improve is the uniformity of the electric field. The measurements presented in this paper are taken in the lower half of the sphere, where no field distortions should be present other than the possible one due to the α source support. However, the presence of the rod holding the central sensor results into a deformation of
the electric field lines. A possible solution under study at CEA is to apply a degraded high voltage along it in order to have an homogenous electric field. In addition to test the whole volume of the detector without introducing any field distortion the possible use of a 220Rn source is under study.
A point that has to be kept in mind is that the final detector should be operated with xenon gas therefore the energy resolution should be assessed in the same condition. This was not done so far since operating with argon is cheaper and we can afford throwing it away after each filling, which is not the case when running with xenon. For this reason a recuperation system based on cryogenic pumping using liquid nitrogen is under preparation at CPPM. Gas purity is another critical item to be addressed when moving to xenon since the drift velocity of electrons is about two orders of magnitude smaller with respect to argon, and the probability of a signal reduction due to oxygen or electronegative impurities is much higher. For this reason we foresee to flush the xenon gas through an oxygen capture cartridge to further reduce the oxygen contamination and a recirculation system is under construction to systematically purify the gas between runs.
Finally operating the detector at high pressure implies a very high voltage on the anode. A possible use of the detector in ionisation mode instead of the presented proportional mode is under discussion, however in order to mitigate the problem of the high voltage a dedicated multi-anode central sensor called “ACHINOS” is under test at CEA [41, 42]. Such a sensor would have the additional advantage of allowing a possible coarse tracking.
For what concerns the electronics possible upgrades could come from an optimized high voltage filter to reduce the electronic noise as explained in Sec. 2.2, and from the possibility of performing a multi-channel readout as needed by the ACHINOS sensor.
7 Conclusions
R2D2 is an R&D project aiming at a ton scale spherical xenon TPC for the search of theββ0ν process. The first prototype was built at CENBG with the main goal of demonstrating that an energy resolution at the level of 1% FWHM can be achieved at 2.458 MeV i.e. at the Qββ
of136Xe. First tests were carried out with argon allowing to understand the detector response. Signal shape analysis showed that the main characteristics of the ionization track (distance and direction relative to the anode) can be obtained. The developed methods could also apply to cylindrical proportional counters. A resolution at the level of 1.1% was achieved with α’s at 5.3 MeV. We also demonstrated that the energy resolution is not degraded going from point-like energy deposits to long particle tracks. This is critical in the search of the ββ0ν process where electrons tracks of several centimeters should be reconstructed. This first step is an important achievement for the R2D2 project paving the way for xenon measurements expected in a near future. The technical improvements discussed in Sec.6, together with the fact that intrinsic resolution of xenon should be better with respect to argon, given the higher number of electrons per unit deposited energy, should allow to gain the waited factor of 1.5 and meet the requirements for the final detector.
Acknowledgments
The authors would like to thank the IdEx Bordeaux 2019 Emergence program for the OWEN grant for the “Development of a custom made electronics for a single channel time projec-tion chamber detector aiming at the discovery of neutrinoless double beta decays, and for
possible applications in industry”. In addition we thank the CNRS International Emergency Action (IEA) for the “E-ACHINOS” grant supporting the collaboration between CENBG and Birmingham University. We thank the CENBG technical staff. We thank M. Chapellier for providing the Po source and for useful discussions. This project has received funding from the European Union’s Horizon 2020 research and innovation programme under the Marie Skłodowska-Curie grant agreement no 841261. K. Nikolopoulos acknowledges support by the European Research Council (ERC) grant agreement no 714893.
References
[1] M. Doi and T. Kotani, “Neutrinoless modes of double beta decay,” Prog. Theor. Phys., vol. 89, pp. 139–160, 1993.
[2] S. Pascoli, S. Petcov, and T. Schwetz, “The Absolute neutrino mass scale, neutrino mass spectrum, majorana CP-violation and neutrinoless double-beta decay,” Nucl. Phys. B, vol. 734, pp. 24–49, 2006.
[3] M. Agostini et al., “Improved Limit on Neutrinoless Double-β Decay of76Ge from GERDA
Phase II,” Phys. Rev. Lett., vol. 120, no. 13, p. 132503, 2018.
[4] C. Alduino et al., “First Results from CUORE: A Search for Lepton Number Violation via
0νββ Decay of130Te,” Phys. Rev. Lett., vol. 120, no. 13, p. 132501, 2018.
[5] J. Albert et al., “Search for Neutrinoless Double-Beta Decay with the Upgraded EXO-200 Detector,” Phys. Rev. Lett., vol. 120, no. 7, p. 072701, 2018.
[6] R. Arnold et al., “Probing New Physics Models of Neutrinoless Double Beta Decay with SuperNEMO,” Eur. Phys. J. C, vol. 70, pp. 927–943, 2010.
[7] A. Gando et al., “Search for Majorana Neutrinos near the Inverted Mass Hierarchy Region with KamLAND-Zen,” Phys. Rev. Lett., vol. 117, no. 8, p. 082503, 2016. [Addendum:
Phys.Rev.Lett. 117, 109903 (2016)].
[8] J. Engel and J. Menendez, “Status and Future of Nuclear Matrix Elements for Neutrinoless Double-Beta Decay: A Review,” Rept. Prog. Phys., vol. 80, no. 4, p. 046301, 2017.
[9] S. Dell’Oro, S. Marcocci, M. Viel, and F. Vissani, “Neutrinoless double beta decay: 2015 review,” Adv. High Energy Phys., vol. 2016, p. 2162659, 2016.
[10] G. Gerbier, “NEWS: a new spherical gaz detector for very light WIMP detection,” in 9th Rencontres du Vietnam: Windows on the Universe, pp. 353–357, 2013.
[11] G. Gerbier et al., “NEWS : a new spherical gas detector for very low mass WIMP detection,” 1 2014.
[12] Q. Arnaud et al., “First results from the NEWS-G direct dark matter search experiment at the LSM,” Astropart. Phys., vol. 97, pp. 54–62, 2018.
[13] A. Bolotnikov and B. Ramsey, “The spectroscopic properties of high-pressure xenon,” Nucl. Instrum. Meth. A, vol. 396, p. 360, 1997.
[14] A. Meregaglia et al., “Study of a spherical Xenon gas TPC for neutrinoless double beta detection,” JINST, vol. 13, no. 01, p. P01009, 2018.
[15] J. Weiss and W. Bernstein, “Energy required to produce one ion pair in several noble gases,” Phys. Rev., vol. 103, pp. 1253–1253, Sep 1956.
[16] I. Katsioulas, I. Giomataris, P. Knights, M. Gros, X. Navick, K. Nikolopoulos, and I. Savvidis, “A sparkless resistive glass correction electrode for the spherical proportional counter,” JINST, vol. 13, no. 11, p. P11006, 2018.
[17] I. Savvidis, I. Katsioulas, C. Eleftheriadis, I. Giomataris, and T. Papaevangellou, “Low energy recoil detection with a spherical proportional counter,” Nucl. Instrum. Meth. A, vol. 877, pp. 220–226, 2018.
[18] I. Giomataris et al., “A Novel large-volume Spherical Detector with Proportional Amplification read-out,” JINST, vol. 3, p. P09007, 2008.
[19] https://r2d2.in2p3.fr/owen.html. [20] https://www.caen.it/products/dt8034/.
[21] E. Armengaud et al., “Performance of the EDELWEISS-III experiment for direct dark matter searches,” JINST, vol. 12, no. 08, p. P08010, 2017.
[22] “Instrumentation électronique en physique nucléaire (mesures de temps et d’énergie),” 1968. [23] https://www.cremat.com/CR-110-R2.pdf.
[24] A. D. Fard, P. Loaiza, F. Piquemal, I. Giomataris, D. Gray, M. Gros, P. Magnier, X.-F. Navick, and I. Savvidis, “Background reduction of a spherical gaseous detector,” AIP Conf. Proc., vol. 1672, no. 1, p. 070003, 2015.
[25] J. Lindhard, V. Nielsen, M. Scharff, and P. Thomsen, “Integral equations governing radiation effects,” Mat. Fys. Medd. Dan. Vid. Selsk, vol. 33, no. 10, pp. 1–42, 1963.
[26] http://www.cenbg.in2p3.fr/-Plateforme-PRISNA-.
[27] I. Katsioulas, P. Knights, J. Matthews, T. Neep, K. Nikolopoulos, R. Owen, and R. Ward, “Development of a Simulation Framework for Spherical Proportional Counters,” 2019. [28] J. Allison et al., “Recent developments in Geant4,” Nucl. Instrum. Meth. A, vol. 835,
pp. 186–225, 2016.
[29] R. Veenhof, “GARFIELD, recent developments,” Nucl. Instrum. Meth. A, vol. 419, pp. 726–730, 1998.
[30] H. Schindler, “Garfield++ user guide,” 2019.
[31] I. Smirnov, “Modeling of ionization produced by fast charged particles in gases,” Nucl. Instrum. Meth. A, vol. 554, no. 1, pp. 474 – 493, 2005.
[32] S. Biagi, “Monte Carlo simulation of electron drift and diffusion in counting gases under the influence of electric and magnetic fields,” Nucl. Instrum. Meth. A, vol. 421, no. 1, pp. 234 – 240, 1999.
[33] ANSYS , “Academic research mechanical, release 19.1.”R
[34] O. Sahin, I. Tapan, E. Ozmutlu, and R. Veenhof, “Penning transfer in argon-based gas mixtures,” JINST, vol. 5, no. 05, p. P05002, 2010.
[35] Q. Arnaud et al., “Precision laser-based measurements of the single electron response of spherical proportional counters for the NEWS-G light dark matter search experiment,” Phys. Rev. D, vol. 99, no. 10, p. 102003, 2019.
[36] S. W. Smith, The Scientist and EngineerâĂŹs Guide to Digital Signal Processing. USA: California Technical Publishing, 1997.
[37] R. G. Lyons, Understanding Digital Signal Processing. USA: Addison-Wesley Longman Publishing Co., Inc., 1st ed., 1996.
[38] V. T. Jordanov, “Deconvolution of pulses from a detector-amplifier configuration,” Nuclear Instruments and Methods in Physics Research Section A: Accelerators, Spectrometers, Detectors and Associated Equipment, vol. 351, no. 2, pp. 592 – 594, 1994.
[39] N. S. Nahman and M. E. Guillaume, “Deconvolution of time domain waveforms in the presence of noise,” Tech. Rep. Technical Note 1047, National Bureau of Standards, 1981.
[40] A. Brossard, “Spherical proportional counters; development, improvement and understanding,” Nucl. Instrum. Meth. A, vol. 936, pp. 412–415, 2019.
[41] A. Giganon, I. Giomataris, M. Gros, I. Katsioulas, X. Navick, G. Tsiledakis, I. Savvidis, A. Dastgheibi-Fard, and A. Brossard, “A multiball read-out for the spherical proportional counter,” JINST, vol. 12, no. 12, p. P12031, 2017.
[42] I. Giomataris, M. Gros, I. Katsioulas, P. Knights, J.-P. Mols, K. Nikolopoulos, G. Savvidis, I. Savvidis, L. Shang, and Y. Zhou, “A resistive ACHINOS multi-anode structure with DLC coating for spherical proportional counters,” 3 2020.