Reference Star Differential Imaging of Close-in Companions and Circumstellar Disks
with the NIRC2 Vortex Coronagraph at the W. M. Keck Observatory
Garreth Ruane1,12 , Henry Ngo2 , Dimitri Mawet1,3 , Olivier Absil4,13 , Élodie Choquet1,5,14 , Therese Cook1,6, Carlos Gomez Gonzalez7 , Elsa Huby8, Keith Matthews1, Tiffany Meshkat9 , Maddalena Reggiani4 , Eugene Serabyn3,
Nicole Wallack10 , and W. Jerry Xuan1,11 1
Department of Astronomy, California Institute of Technology, 1200 E. California Boulevard, Pasadena, CA 91125, USA;gruane@caltech.edu 2
NRC Herzberg Astronomy and Astrophysics, 5071 West Saanich Road, Victoria, British Columbia, Canada
3
Jet Propulsion Laboratory, California Institute of Technology, 4800 Oak Grove Drive, Pasadena, CA 91109, USA
4
Space Sciences, Technologies, and Astrophysics Research(STAR) Institute, Université de Liège, Liège, Belgium
5
Aix Marseille Univ., CNRS, CNES, LAM, Marseille, France
6
Department of Physics and Astronomy, University of California, Los Angeles, CA 90095, USA
7
Université Grenoble Alpes, IPAG, F-38000 Grenoble, France
8
LESIA, Observatoire de Paris, Université PSL, CNRS, Sorbonne Université, Univ. Paris Diderot, Sorbonne Paris Cité, 5 place Jules Janssen, F-92195 Meudon, France
9
IPAC, California Institute of Technology, 1200 E. California Boulevard, Pasadena, CA 91125, USA
10
Division of Geological and Planetary Sciences, California Institute of Technology, 1200 E. California Boulevard, Pasadena, CA 91125, USA
11Department of Physics and Astronomy, Pomona College, 333 N. College Way, Claremont, CA 91711, USA
Received 2018 November 28; revised 2019 January 13; accepted 2019 January 14; published 2019 February 14
Abstract
Reference star differential imaging (RDI) is a powerful strategy for high-contrast imaging. Using example observations taken with the vortex coronagraph mode of Keck/NIRC2 in L′ band, we demonstrate that RDI provides improved sensitivity to point sources at small angular separations compared to angular differential imaging(ADI). Applying RDI to images of the low-mass stellar companions HIP79124C (192 mas separation, ΔL′=4.01) and HIP78233B (141 mas separation, ΔL′=4.78), the latter a first imaging detection, increases the significance of their detections by up to a factor of 5 with respect to ADI. We compare methods for reference frame selection andfind that pre-selection of frames improves detection significance of point sources by up to a factor of 3. In addition, we use observations of the circumstellar disks around MWC758 and 2MASSJ16042165−2130284 to show that RDI allows for accurate mapping of scattered light distributions without self-subtraction artifacts. Key words: planets and satellites: detection– protoplanetary disks – stars: imaging – stars: individual (MWC 758, 2MASS J16042165−2130284) – techniques: high angular resolution
Supporting material: data behindfigure 1. Introduction
Adaptive optics (AO) imaging surveys determine crucial occurrence statistics for giant exoplanet populations with masses of1 MJupat orbital separations of>10 au and provide
unique insight into their formation and migration histories (Bowler 2016; Meshkat et al. 2017). Furthermore, resolving
low-mass companions from their host stars reduces measure-ment noise allowing for in-depth spectral characterization, which yields a wealth of information about the physical properties of their atmospheres(Biller & Bonnefoy2017). AO
observations also allow for the detailed mapping of scattered light from dust in circumstellar disks providing context for planet formation theories.
Current and future infrared, high-contrast imaging programs seek to(1)bridge the gap between the search completeness of direct imaging and radial velocity surveys,(2)characterize the atmospheres of lower mass planets, and (3)understand the interaction between planets and the circumstellar disks from which they form. All of the above science cases benefit from minimizing the angular separations from the host star at which instruments are sensitive enough to detect and characterize the planets and disks of interest.
Reducing the inner working angle (i.e., the separation at which the transmission is 0.5) of ground-based, high-contrast imaging systems to their theoretical limits(i.e., ∼λ/D, where λ is the wavelength and D is the telescope diameter; Guyon et al.
2006) opens a critical search space at solar system scales
(1–30 au) for stars within a few hundred parsecs. From a technical point of view, it will also pave the way for studies of temperate exoplanets in reflected light with future large aperture telescopes (D∼30 m), especially in the habitable zones of nearby, late-type stars where the planet-to-star flux ratio is expected to be∼10−8 for planet radii of ∼1 R⊕ (see e.g., Guyon 2018). Looking further into the future, these
developments will also help maximize the number of Earth-like planets orbiting solar-type stars available for study with future exoplanet imaging space missions, such as the Habitable Exoplanet Observatory(HabEx; Gaudi et al.2018) and Large
UV/Optical/IR Surveyor (LUVOIR; The LUVOIR Team2018)
concepts.
The vortex coronagraph mode(Foo et al.2005; Mawet et al.
2005) of the NIRC2 instrument at the W. M. Keck Observatory
(Huby et al. 2017; Mawet et al. 2017; Ruane et al. 2017; Serabyn et al. 2017; Guidi et al. 2018; Reggiani et al. 2018; Xuan et al.2018) has the optical throughput needed to search
for giant planets down to λ/D, or ∼100 mas, for L′ and Ms
bands (λ=3.4–4.8 μm). However, pairing the Keck AO system with a small inner working angle coronagraph does © 2019. The American Astronomical Society. All rights reserved.
12
NSF Astronomy and Astrophysics Postdoctoral Fellow.
13
F.R.S.-FNRS Research Associate.
14
not immediately provide sensitivity to point sources with Δmag3 within 0 5 of the host star in our experience. Surpassing this level also requires optimized observing strategies and post-processing(Mawet et al.2012).
1.1. The Limitations of ADI
High-contrast imaging surveys with Keck/NIRC2 tradition-ally make use of angular differential imaging (ADI; Marois et al. 2006) in the search for giant planets, such as the four
planets discovered orbiting HR 8799(Marois et al.2008,2010; Konopacky et al. 2016). In this strategy, the telescope’s field
rotator is set to vertical angle mode, which keeps the beam fixed in azimuthal orientation with respect to the elevation axis and detector while thefield of view rotates over the course of an observation. This assists in differentiating between true astrophysical objects, which revolve in the image, and starlight that leaks through the coronagraph, which typically leaves a residue of speckles in the image.
Although ADI is the most successful observational strategy for detecting giant planets at wide separations to date (see a recent review by Chauvin2018), it has some innate limitations.
In order to clearly identify companions, each target must be observed for long enough to allow enough parallactic angle (PA) rotation such that a companion would move by a substantial fraction of the width of the point-spread function (PSF). For instance, at the inner working angle of a vortex coronagraph (0 08–0 1 for NIRC2 L′ and Ms bands), the
minimum desired PA rotation is∼30° , which moves the PSF of a companion by an arclength of roughly half of its FWHM. However, due to practical limitations, observations from
ongoing surveys with the Keck/NIRC2 vortex
coronagraph have a median PA rotation of ∼11° (Xuan et al.
2018).
To illustrate the problems associated with scheduling ADI observations, Figure 1 shows the PA rotation achieved from Maunakea, Hawaii(latitude 19°.8 N) in a one hour observation versus the target’s decl. and the timing of the observation. An “on-time” observation (thick, blue dashed line) in this case starts 30 minutes before the target crosses the meridian. The thin black lines shows how the PA rotation degrades when observation is initiated too early or too late by multiples of Δt=15 minutes.
Figure 1 has several important implications that are as follows.
1. Timing constraints. ADI observations must be carried out during a relatively narrow time window to achieve a PA rotation needed to avoid self-subtraction effects(Marois et al. 2006). For example, in order for a planet to move
30°, or roughly an arclength of 0.5×FWHM at an angular separation of λ/D, an observation at the most favorable δ must be initiated within ±68 minutes of the optimal time. Increasing the path length requirement to 1.0×FWHM (i.e., a PA rotation of 60°) reduces the allowable timing error to ±36 minutes. The timing requirement is even more strict at otherδ values. 2. Limited sky coverage. Although targets with decl.> −40°
are observable from Maunakea, achieving a PA rotation of>30° during a one hour observation is only possible on targets between δ=−8° and δ=48° (assuming the observations are timed perfectly). For PA rotation >60°,
theδ range becomes 8°–32°, ruling out more than 90% of the sky.
3. Inefficient surveys of star-forming regions. Many of the most attractive targets for high-contrast imaging in the infrared are in nearby star-forming regions (distances of 120–150 pc), such as the Taurus and ρ Ophiuchi molecular clouds (see, e.g., Bowler 2016). However,
these regions only extend over a few square degrees, allowing for one or two ADI sequences on these targets per night. Therefore, an ADI survey of these regions would need to be carried out over many nights.
4. Limited effective inner working angle. Unless the star falls within the decl. ranges described above and the observations are well-timed, self-subtraction effects at small angular separations(Marois et al.2006) ultimately
limit the sensitivity near to the star and inner working angle of the coronagraph.
5. Erases rotationally symmetric circumstellar disks. Ima-ging scattered light from close to pole-on protoplanetary, transitional, and debris disks with ADI may not be possible because rotationally symmetric features self-subtract in post-processing and complex dust disk distribution become confounded by artifacts (Milli et al.
2012).
1.2. The Limitations of SDI
An alternate speckle subtraction method known as spectral differential imaging(SDI; Sparks & Ford 2002) is applied on
instruments with integralfield spectrographs, such as Palomar/ P1640 (Hinkley et al. 2011), Gemini/GPI (Macintosh et al. 2014), Very Large Telescope (VLT)/SPHERE (Vigan et al.
Figure 1. Parallactic angle rotation during a one hour observation from Maunakea, Hawaii(latitude 19°.8 N) as function of target decl. δ. The dashed blue line represents an observation initiated exactly 30 minutes before the object crosses the meridian. The thin black lines represent observation windows shifted byΔt=15 minutes. The other thick dashed lines indicate the observation with the maximum allowable timing error to achieve a PA rotation that moves a planet by an arclength equal to 1.0×FWHM and 0.5×FWHM at an angular separation of λ/D. Specifically, achieving 60° and 30° PA rotations at the most favorableδ requires the timing error to be <36 minutes and<68 minutes, respectively.
2016), and Subaru/SCExAO/CHARIS (Jovanovic et al.2015; Groff et al.2017). SDI decouples speckles from astrophysical
objects based on their wavelength dependence rather than azimuthal rotation and therefore alleviates some of the aforementioned limitations of ADI. Between the shortest and longest wavelengths, speckles move radially by α×Δλ/λ, whereα is the angular separation in units of λ/D. For instance, a radial change in the position of>λ/D is only seen at angular separations of>5 λ/D using a typical filter with Δλ/λ≈0.2. Therefore, SDI also suffers from self-subtraction effects and is not ideal for imaging close-in point sources or pole-on circumstellar disks. Additionally, Keck/NIRC2 does not have an integral field spectrograph for this purpose, making contemporaneous SDI impossible.
1.3. Reference Star Differential Imaging
Reference star differential imaging (RDI; Lafrenière et al.
2009; Soummer et al. 2011; Gerard & Marois 2016) is an
alternative approach that uses images of other stars to build a model of the stellar PSF. RDI is a commonly used observational strategy for Hubble Space Telescope imaging observations of debris disks (Golimowski et al. 2006; Schneider et al. 2009,2014; Choquet et al. 2016) and vortex
coronagraph observations with the Hale telescope at Palomar Observatory (Mawet et al. 2010, 2011; Serabyn et al. 2010)
where ADI is not possible due to its equatorial mount. In addition, RDI will very likely be applied for high-contrast imaging with future space telescopes, including the James Webb Space Telescope(JWST; Green et al.2005) and the Wide
Field Infrared Survey Telescope(WFIRST; Spergel et al.2015; Bailey et al.2018) as well as the HabEx (Gaudi et al.2018) and
LUVOIR (The LUVOIR Team 2018) mission concepts. The
latter two may push to very small angular separations using vortex or other small inner working angle coronagraphs(Pueyo et al.2017; Ruane et al.2018).
Here, we demonstrate how RDI with Keck/NIRC2 mitigates practical issues associated with ADI (and potentially SDI on other instruments). We demonstrate the benefits of the RDI observing strategy for ground-based imaging studies, especially the detection of point sources at small angular separations and mapping of scattered light from circumstellar disks. In the following sections, we detail the RDI method and strategy (Section2) using three example observing nights that illustrate
the benefits of RDI for point-source detection (Section3) and
for imaging of circumstellar disks (Section 4) with Keck/
NIRC2. Section5discusses ourfindings and the limitations of RDI, including error sources and potential artifacts. Section 6
summarizes our conclusions.
2. RDI Method and Strategy
RDI requires the observer to decide which reference frames and algorithms to use in order to model the stellar PSF. Reference frames may be specific reference stars purposely taken on the same night as the primary observation(e.g., Ruane et al. 2017), frames from other stars that were coincidentally
observed on the same night in the same observing mode(e.g., Xuan et al. 2018), or from an archive of frames across
observing programs(e.g., Choquet et al.2016). Example PSF
reconstruction algorithms include subtracting a scaled version of the reference image (Schneider et al. 2009), principal
components analysis (PCA; Soummer et al. 2012), and
non-negative matrix factorization(NMF; Ren et al.2018).
Xuan et al.(2018) showed that using all frames from a given
night(excluding the target of interest) as reference frames and applying PCA improves the sensitivity to point sources at small angular separations with respect to ADI for many of the targets
in our database of Keck/NIRC2 vortex
coronagraph observations. In the following, we will discuss improvements to this strategy by combining this approach with frame pre-selection.
For each observation, we apply basic preprocessing steps (see AppendixAfor details) and PCA to estimate and subtract the starlight from the images using the Vortex Image Processing (VIP) software package (Gomez Gonzalez et al.
2017). Following Soummer et al. (2012), a single frame may be
written as X=I+A, where I is the stellar PSF after the coronagraph(a speckle field) and A is the companion PSF. The stellar PSF is I X Z, Z , 1 k K k k 1
å
= á ñ = ( ) ( ) ( )where Z{ ( )k}k= ¼1, ,N are a basis set of images derived from a
series of N reference frames Rk
k= ¼1, ,N
{ ( )} , X Zá , ( )kñ is the
projection of the frame onto the kth basis image, and K represents the number of basis vectors used for the PSF model with KN. Here, the basis modes are computed using PCA. In the case of point sources, we empirically determine the number of basis vectors, K, that provides the best sensitivity to fake companions injected in post-processing. Whereas in ADI-processed images the value of K can drastically affect the sensitivity to point sources(Pueyo2016) and the occurrence of
disk artifacts (Milli et al. 2012), RDI results tend to be
relatively insensitive to the choice of K(Soummer et al.2012).
Rather, the choice of which reference frames to use to model the stellar PSF has a dominant effect on the quality of thefinal image.
We explored a number of different methods for reference frame pre-selection. In each case, we compared the potential reference frames, Xi, with the temporal median of the science
frames, M, over a speckle noise dominated region of the image (typically within 5–10 λ/D). We assigned a score to each reference frame using three metrics: the mean square error (MSE), the Pearson correlation coefficient (PCC), and the structural similarity index metric (SSIM) as defined in Wang et al.(2004). The MSE of the kth reference frame is given by
N X M MSEk 1 , 2 i N i k i pix 1 2 pix
å
= -= ( ) ( ) ( ) ( )where Npix is the number of pixels in the comparison region.
The PCC is X M X M PCC cov , std std , 3 k k k = ( ) ( ) ( ) ( ) ( ) ( ) ( )
where cov(.) and std(.) represent the covariance and standard deviation. Specifically, the covariance is given by
P Q N P P Q Q cov , 1 1i , 4 N i i pix 1 pix
å
= - = - -( ) ( ¯)( ¯) ( )where P and Q are the images being compared, with pixel-wise means P¯ and Q¯. The standard deviation is
P N P P std 1 1i . 5 N i pix 1 2 pix
å
= - = -( ) ( ¯) ( )Thefinal metric we consider is the mean SSIM,
N L C S SSIMk 1 , 6 i N i k i k i k pix 1 pix
å
= = ( ) ( ) ( ) ( ) ( )where L, C, and S are the luminance, contrast, and structural terms, which are computed over a FWHM×FWHM window centered on pixel i. The luminance term is
L XM c X M c 2 , 7 i 1 2 2 1 = + + + ¯ ¯ ¯ ¯ ( )
the contrast term is
C X M c X M c 2 std std std std , 8 i 2 2 2 2 = + + + ( ) ( ) ( ) ( ) ( )
and the structural term is
S X M c X M c cov , std std . 9 i 3 3 = + + ( ) ( ) ( ) ( )
c1, c2, and c3are small constants chosen to prevent instability
when the denominator is otherwise close to zero. Qualitatively, Liis the relative change in luminance and responds similarly to
MSE to differences in the pixel counts. Siis almost identical to
the PCC. Thus, SSIM can be thought of as a mixture between the MSE and PCC metrics.
In the following section, we investigate the performance gains achieved by modeling the stellar PSF using the principal
components(PCs) of a set of reference frames selected based on their MSE, PCC, and SSIM values, as compared to the median science frame.
3. Point-source Detection
To illustrate the utility of and trade-offs associated with using RDI for point-source detection, we revisit Keck/NIRC2 observations taken during commissioning of the vortex coronagraph mode on UT2016April13. Table 1 gives the full list of observations, consisting of 11 targets observed over the course of a full observing night for various scientific purposes. The targets span a large range of elevations, spectral types(spec. type), and magnitudes, which we list in the V and Wise W1 bands(3.4 μm; Wright et al.2010). The observations
also vary in the number of frames(Nframes) and total integration
times(tint).
Hinkley et al.(2015) previously identified low-mass stellar
companions orbiting at ∼20 au from two of the observed targets, HIP79124 and HIP78233, using aperture masking interferometry. HIP79124 and HIP78233 are classified as A0V and F0V stars, which reside in the Upper Scorpious subgroup of the Scorpius–Centaurus (USco) association at a distance of ∼120–150 pc (de Zeeuw et al. 1999) and, thus,
have an estimated age of 5–20 Myr (Pecaut et al. 2012; Song et al. 2012). HIP79124 is a triple system with an additional
companion, HIP79124B, at ∼1″ from HIP79124A (Lafre-nière et al.2014). RDI allows us to directly image their close-in
companions, HIP79124C and HIP78233B, even though their angular separation from the host star is<0 2, or 2 λ/D in the L′ band. We use these previously reported astrometric measurements along with data presented in this study(Table2)
to check for common proper motion and confirm that
Table 1
Keck/NIRC2 Vortex Observations in the L′ Band on UT 2016 April 13
Star Name Alt. Name R.A. Decl. Spec. Type Nframes tint(minutes) PA Rot. V W1a
HIP 41152 HD 70313 08 23 48.5 +53 13 11.0 A3V 30 10.0 12°.9 5.54 5.21 DX Leo HD 82443 09 32 43.8 +26 59 18.7 G9V 30 15.0 55°.0 7.01 5.15 TW Hya TWA 1 11 01 51.9 −34 42 17.0 K6V 70 35.0 21°.6 10.5 7.10 V1249 Cen TWA 25 12 15 30.7 −39 48 42.6 M0.5 30 15.0 7°.91 11.2 7.26 V1252 Cen TWA 10 12 35 04.2 −41 36 38.5 M2V 30 15.0 7°.82 13.0 8.09 HIP 66704 HD 119124 13 40 23.2 +50 31 09.9 F7.7V 30 15.0 17°.9 6.32 4.92 HIP 78233 HD 142989 15 58 29.3 −21 24 04.0 F0V 36 18.0 32°.4 9.10 7.63 HIP 79124 HD 144925 16 09 02.6 −18 59 44.0 A0V 23 11.5 16°.9 7.78 6.96 2MASS J16430128−1754274 16 43 01.3 −17 54 27.4 M0.5 30 15.0 11°.8 12.6 8.44 2MASS J17520294+5636278 17 52 02.9 +56 36 27.8 M3.5V 30 15.0 11°.4 13.3 8.20 V4046 Sgr HD 319139 18 14 10.5 −32 47 34.4 K5+K7 20 10.0 5°.63 10.7 7.12 Note.
aWiseW1 mag (3.4 μm; Wright et al. 2010).
Table 2
Best-fit Photometry and Astrometry for the Detected Companions
Companion Dist.(pc)a ΔL′ Sep(mas) PA(°) F/σF Mass(MJup) b
Proj. Sep(au) HIP 79124 B 132±1 2.49±0.04 971.5±1 100.61±0.03 >31 630±17 128±1 HIP 79124 C 132±1 4.01±0.03 192±2 246.5±0.8 36 199±4 25.3±0.3 HIP 78233 B 256±4 4.78±0.12 141±3 6±1 8.6 198±19 36.0±0.9 Notes. a Bailer-Jones et al.(2018). b
Figure 2.MSE(shown as negative logarithm), PCC, and SSIM for all frames from UT2016April13 (grouped by target in an arbitrary order) compared to the median science frame of the science observations:(a)HIP79124 and (b)HIP78233. MSE and PCC respond to differences in the image counts and structure, respectively; SSIM is correlated with both.
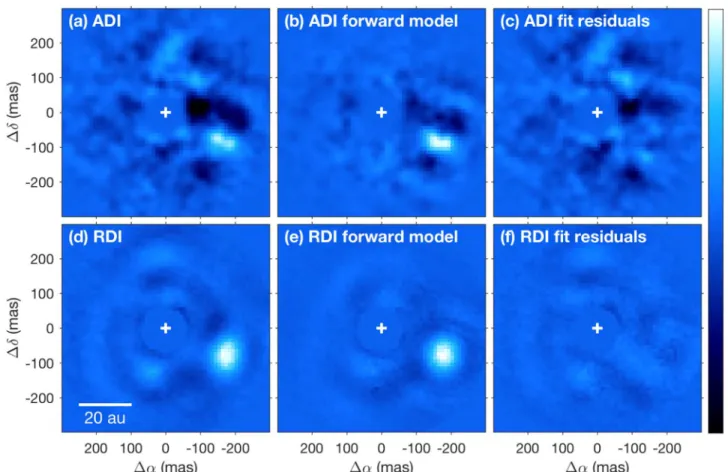
Figure 3.Observation of HIP 79124 C.(a) Image after subtracting stellar PSF using ADI. (b) Best forward model of the point source. (c) Residuals after subtracting the point source from the data.(d)–(f) Same as (a)–(c), but using RDI for the stellar PSF subtraction. North is up and east is left. The companion was retrieved at higher signal-to-noise ratio in RDI compared to ADI.(a)–(c)and (d)–(f)are shown on the same scale.
HIP78233B, HIP79124B, and HIP79124C are all grav-itationally bound to their host star.
Figure2 shows the MSE, PCC, and SSIM for each possible reference frame from UT2016April13, compared to the median frame in the HIP79124 and HIP78233 observations. As predicted, the MSE and PCC respond to different attributes, whereas the SSIM shows similar features to both MSE and PCC. In the case of HIP79124 and HIP78233, the brighter stars(HIP 66704, DX Leo, HIP 41152) had considerably worse MSE and SSIM. Also, HIP79124 and HIP78233 were mutually poor reference stars for one another according to the PCC and the SSIM despite being observed consecutively. This is likely due to variable observing conditions at that point in the night.
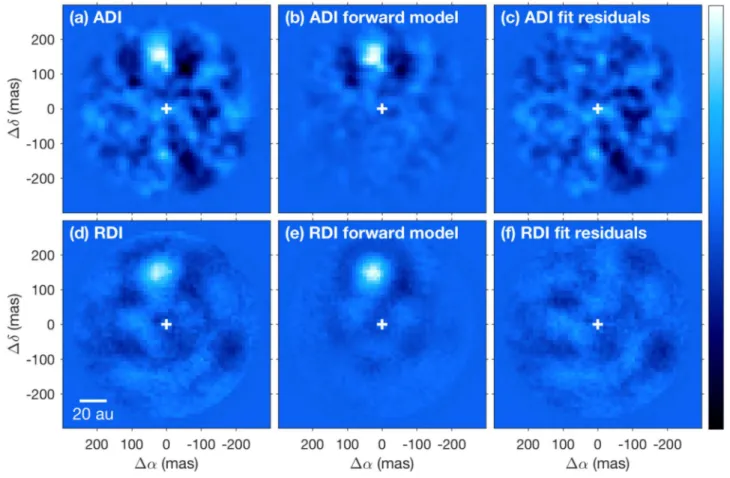
Figures 3 and 4 show the ADI and RDI images of HIP79124C and HIP78233B, respectively. HIP79124C was previously imaged by Serabyn et al. (2017) using RDI.
However, we have recovered HIP78233B for the first time. We show both examples here to demonstrate that, using PCA, the companions are detected at higher significance with RDI compared to our ADI reduction.
In order to determine which reference frames to use, we ordered the reference frames according to the MSE, PCC, and SSIM and varied the number of frames from which we derive the PCs (see Figure 5). In each case, we compute a forward
model of the companion’s PSF (see, e.g., Lagrange et al.2009; Soummer et al. 2012). We subtracted a copy of the off-axis
PSF at the location of the planet in each preprocessed science frame, varied its location and brightness, and repeated the PCA reduction until the values were minimized in thefinal images in a 2×FWHM radius about the companions position using a
downhill simplex algorithm. The forward model is defined as the difference between the original PCA reduction without injected or subtracted companions and the best-fit residuals.
The signal-to-noise ratio (S/N) is defined as the ratio between estimatedflux, F, and the error in the flux fit, σF, as
calculated using the method outlined in AppendixB. Wefind that the MSE and SSIM metrics lead to higher S/N for these objects compared to PCC, with SSIM offering a slight improvement. The optimal number of frames according to SSIM is 237 (out of 336) and 202 (out of 323) for HIP79124C and HIP78233B, respectively. We also opti-mized K in this fashion for each number of reference frames considered, but found that K has much less of an influence on the S/N. At the optimal number of reference frames, we used 11 and 15 PCs for HIP79124C and HIP78233B, respec-tively. Figures 3 and 4 show the result using the optimal combination of parameters. The S/N has a steep drop when using more than ∼230 frames ordered by MSE and SSIM, which occurs when the reduction includes frames from the brightest stars (HIP 66704, DX Leo, HIP 41152). This is expected since we found previously in Xuan et al.(2018) that
the contrast in Keck/NIRC2 images is strongly correlated with stellar magnitude.
Table 2 reports the astrometry and photometry values derived from the highest S/N case. There are a few important differences between the values in Figure 5 and thefinal fits. First, we used the flux and position we retrieved using all reference frames to compute thefitting error in Figure5. In the final fits, we used the actual flux and position retrieved at the optimal number of reference frames and PCs for the injected, fake companion. Second, we applied a correction to the
retrieved flux values to account for the throughput of the coronagraph, which was 81% and 68% for HIP79124C and HIP78233B, respectively, according to our optical model. In the end, we arrived at lower S/N values for each companion than the estimates in Figure5. Thefinal S/N was better with RDI than ADI for both stars. Specifically, for HIP79124C, the S/N in RDI was 36 whereas the best we could achieve in ADI was 7.9 with K=2 and a PA rotation of 17°. Similarly, for HIP78233B, the S/N in RDI was 8.6, but the best we achieved in ADI was 5.1 with K=6 despite having a PA rotation of 32°.
Comparing to Hinkley et al.(2015), the change in astrometry
since 2010 is consistent with orbital motion, leading to thefirst confirmation that HIP78233B is bound. We updated the distances to HIP79124 and HIP78233 based on Gaia DR2 (Bailer-Jones et al. 2018), which gave 132±1 pc and
256±4 pc for the respective stars, rather than the distances of 123 pc and 145 pc used in Hinkley et al. (2015). Our
measured flux ratio for HIP79124C, ΔL′=4.01±0.03, is inconsistent with both Hinkley et al.(2011) and Serabyn et al.
(2017) by a small margin, who report ΔL′=4.3±0.1 and
ΔL′=4.2±0.1, respectively. The increased flux estimate and updated stellar distance predicts a higher mass for both companions. Assuming the BT-Settl evolutionary model (Allard et al. 2012) and an age of 10 Myr, we estimate
minimum masses of 199±4 MJupand 198±19 MJup, which
are well above the hydrogen-burning limit.
For each point-source companion, we use previously reported astrometry along with new data presented in this study to constrain the orbits of each companion around their host stars. Although two data points do not provide a
well-constrained orbit, the long baseline provides some constraint on the actual semimajor axis and eccentricity. We use the Orbits of the Impatient (OFTI; Blunt et al. 2017) algorithm as
implemented by the orbitize software package.15OFTI is a Bayesian rejection-sampling method that excels at finding constraints on long period orbits with sparse data points. We determine the median semimajor axis and 68% confidence intervals to be 37-+1231 au for HIP78233B, 157-+3782 au for HIP79124B, and 26-+820 au for HIP79124C. We also found that the data favors lower eccentricity orbits over high eccentricity orbits. Details of these orbit fits and the asymmetrical posteriors are discussed in Appendix C. The posteriors are also available online as supplementary data for use in other studies.
In the two examples above, we have demonstrated that RDI offers significantly improved S/N for companions at angular separations of 2 λ/D and that frame pre-selection is critical for maximizing the performance achieved with RDI. However, previous versions of the data reduction pipeline used by our team for Keck/NIRC2 vortex coronagraph observations (Xuan et al. 2018) used all available reference frames from a given
night by default. Although there is often an S/N improvement at small separations using all frames over ADI, we are working toward using SSIM or similar metrics to perform the pre-selection of frames in a robust way and reprocessing archival NIRC2 data to reveal new point sources at close separations.
Figure 5.Estimated photometric S/N=F/σFachieved with RDI vs. the number of reference frames for the three frame selection methods. For the sake offinding the
best set of reference frames, we injected a fake companion into the RDI residual cube with the best-fit flux and separation obtained using the maximum number of reference frames.
15
4. Circumstellar Disk Imaging
In addition to improving the sensitivity to point sources at small angular separations, RDI is also advantageous for disk imaging. In the following two examples, we use Keck/NIRC2 observations of circumstellar disks. In each case, reference stars were specifically chosen to be close in elevation when observed and to have similar brightness in the R and L′ bands, where the wavefront sensor and science camera are sensitive.
4.1. MWC758
MWC758 (HD 36112) is a young (3.5±2.0 Myr; Meeus et al. 2012) stellar object in the Taurus star-forming region
(distance of 160 pc; Bailer-Jones et al. 2018) surrounded by a
prominent protoplanetary disk with at least two massive spiral arms seen in scattered light observations(Grady et al. 2013; Benisty et al.2015; Reggiani et al.2018; Ren et al.2018). ADI
images with Keck/NIRC2 from Reggiani et al. (2018) showed
evidence of a potential third spiral arm.
Here, we reprocessed one of the epochs presented in Reggiani et al. (2018) using reference stars observed directly
before and after the previously published ADI sequence. Table3gives the list of observations we used in the reduction. For ADI, we used all of the science frames and K=6. For RDI, we used similar methods as the previous section keeping the best 70% (50 out of 75) of reference frames according to the SSIM metric and used the projection of 25 out of 50 PCs in the PSF model. However, since the reference stars were a good
match to the science targets and conditions were stable during these observations, the variation in MSE, PCC, and SSIM was similar to that of one of the well-correlated observations in Figure 2. Therefore, the RDI image of the disk is visibly unchanged, barring some background variation, whether we use 10% more or less frames or change the number of PCs by ∼20%, while the ADI image is very sensitive to the number of PCs.
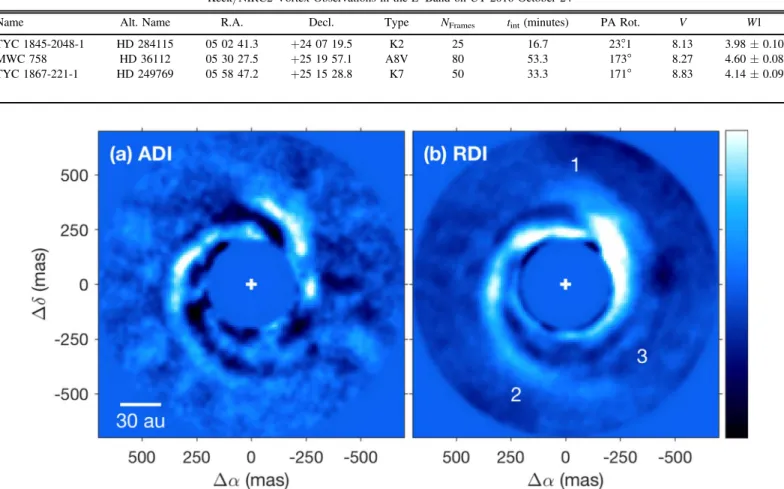
Figure6shows the ADI and RDI images of MWC758. In addition to the famous north and south spirals(labeled as 1 and 2 in Figure 6(b)), we recovered the proposed third spiral arm
feature(labeled as 3) with both ADI and RDI for the first time. The ADI image is dominated by self-subtraction effects, while the RDI image is likely more representative of the true morphology of scattered light features. Although we have confirmed that the proposed third spiral arm was not an ADI artifact, it is unclear from the RDI image whether the feature is truly a third spiral arm or a continuation of the north arm wrapping almost 360° about the star. Nevertheless, this observation demonstrates that RDI is beneficial for mapping scattered light distributions in circumstellar disks without the sharpening of azimuthal features seen in the ADI images.
4.2. J16042165−2130284
We present an observation of the young stellar object 2MASSJ16042165−2130284 (hereafter J1604). J1604 is a K2 star at a distance of 150 pc (Bailer-Jones et al. 2018) and a
Table 3
Keck/NIRC2 Vortex Observations in the L′ Band on UT 2016 October 24
Name Alt. Name R.A. Decl. Type NFrames tint(minutes) PA Rot. V W1
TYC 1845-2048-1 HD 284115 05 02 41.3 +24 07 19.5 K2 25 16.7 23°.1 8.13 3.98±0.10 MWC 758 HD 36112 05 30 27.5 +25 19 57.1 A8V 80 53.3 173° 8.27 4.60±0.08 TYC 1867-221-1 HD 249769 05 58 47.2 +25 15 28.8 K7 50 33.3 171° 8.83 4.14±0.09
Figure 6.Circumstellar disk around MWC 758 after subtracting the stellar PSF using(a)ADI and (b)RDI. Labels 1, 2, and 3 indicate the prominent north and south spiral arms and the potential third arm, respectively.
likely member of USco (Carpenter et al.2014), suggesting an
age of 5–20 Myr (Pecaut et al.2012; Song et al.2012). J1604 is
surrounded by a nearly pole-on(7° inclination; Mathews et al.
2012) pre-transitional disk(Espaillat et al. 2007), the most
massive known (∼0.1 MJup) in USco (Mathews et al. 2012).
Several previous works identified a ring-like disk in scattered light (Mayama et al.2012; Pinilla et al.2015; Canovas et al.
2017; Pinilla et al.2018). This disk has received considerable
attention owing to its variability(Pinilla et al.2015,2018) and
evidence of planet-induced dust filtration(Rice et al. 2006; Canovas et al.2017).
The observing list from UT2017May10 (see Table 4)
consists of seven observations, including J1604 and a reference star, 2MASSJ19121875−2137074 (hereafter J1912), specifi-cally selected prior to the observing night because of its similar brightness and elevation. The remaining five targets were observed as part of an ongoing survey of Mstars (PI: Mawet). Thefirst three Mstar targets were significantly worse reference stars according to their SSIM values because they were much fainter (W1>9) than J1604 (W1=7.61). The other two Mstars had SSIM values close to that of J1912.
Figure7shows the ADI and RDI images of J1604. Since the disk is nearly rotationally symmetric, the ADI image is consistent with noise for all values of K. However, the ring of scattered light is clearly visible in the RDI reduction. For the
RDI image in Figure 7(b), we used the best 88 reference
frames, according to their SSIM values, out of the 150 available and projected 44 PCs to build the stellar PSF model. Again, the morphology of the disk did not change much when changing the number of reference frames or PCs by∼20% in this case. After removing poorly matching reference frames according to the SSIM, the projection coefficients for the first few PCs dominate.
Polarized intensity maps of J1604 from Pinilla et al.(2018)
show azimuthal dips attributed to shadowing by an inner disk. We see similar features labeled as 1, 2, and 3 in Figure7(b).
These dips change with time indicating that the inner regions are highly dynamic, which may be evidence of a close-in massive companion. In the southern part of the disk, we estimate that the inner and outer edges of the bright scattering feature appear at 440 and 500 mas, respectively. Compared to J-band (1.2 μm) observations taken with VLT/SPHERE by Pinilla et al. (2018) who measured a scattered light peak at
430 mas, the scattering surface appears slightly further from the star in the L′ band (3.8 μm), which may be evidence of spatial segregation of dust particle sizes and/or lower opacities at longer wavelengths. In future work, we willfit a forward model of the disk using radiative transfer and further investigate the wavelength dependence of the scattered light surface and
Table 4
Keck/NIRC2 Vortex Observations in the L′ Band on UT 2017 May 10.
Name R.A. Decl. Type Nframes tint(minutes) PA Rot. V W1
2MASS J11110358−3134591 11 11 03.6 −31 34 59.1 M 20 15.0 6°.99 14.4 9.35±0.02 2MASS J11431742+1123126 11 43 17.4 +11 23 12.6 M 20 15.0 10°.1 12.3 9.12±0.03 2MASS J13412668−4341522 13 41 26.7 −43 41 52.2 M3.5 20 15.0 6°.18 14 9.70±0.02 2MASS J16042165−2130284 16 04 21.7 −21 30 28.5 K2 73 54.8 36°.2 11.9 7.61±0.03 2MASS J18580415−2953045 18 58 04.2 −29 53 04.5 M0V 20 15.0 7°.25 11.8 7.86±0.02 2MASS J19121875−2137074 19 12 18.8 −21 37 07.4 M 50 37.5 19°.8 11.3 7.42±0.03 2MASS J20013718−3313139 20 01 37.2 −33 13 13.9 M1 20 15.0 6°.95 12.3 8.14±0.02
Figure 7.2MASS J16042165−2130284 disk after subtracting the stellar PSF using (a)ADI and (b)RDI. Labels 1, 2, and 3 indicate the position of potential shadow features in the disk.
shadowing effects in the disk (N. Wallack et al. 2019, in preparation), all of which would not be possible using ADI.
5. Discussion
The above sections exemplify that (1)combining the small inner working angle vortex coronagraph and RDI is a sensitive technique for discovering faint companions∼100 mas from the star and imaging scattering light from circumstellar disks with Keck/NIRC2 and (2)optimizing the reference frame selection process leads to significant improvement in the quality of the stellar PSF subtraction. In this section, we describe the noise characteristics, artifacts, and limitations unique to this obser-ving mode.
5.1. Treatment of False Positives
Given the typical number of reference frames available per night and the limited diversity they provide, subtraction of the stellar speckle field is imperfect, and the residual speckles in RDI images tend to obey a highly non-Gaussian noise distribution (Goodman 1975; Aime & Soummer 2004),
especially within a fewλ/D of the star. However, the standard detection methods used in high-contrast imaging, including this work, estimate the standard deviation of the speckle noise,σn,
as a function of angular separation from the star and set afixed detection threshold(typically 5σn), which leads to a substantial
increase in the number of false positives compared to what is expected from normally distributed noise. In addition, since the spatial scale of speckles is roughly the FWHM of the off-axis PSF, σnis estimated using only a few independent samples at
small angular separations (Mawet et al.2014). It is therefore
especially challenging to differentiate between bright speckles and true companions in a single observation and to set robust upper limits on the brightness of unseen companions(see, e.g., Ruffio et al.2018) within a few λ/D of the star. More work is
needed to accurately model the residual speckle noise distribution given a set of science and reference frames.
5.2. Typical Artifacts
In addition to the non-Gaussian properties of the stellar speckle noise, there are other artifacts that may lead to false positives. For instance, several dust spots on the vortex focal plane mask in Keck/NIRC2 resemble point sources in RDI images because their brightness is not correlated with that of the star and background and therefore they are not well subtracted in post-processing. This requires the observer to rule out detections corresponding to the location of the dust. We find that having a large amount of PA rotation helps blur these effects in the de-rotation step.
The RDI approach assumes that stellar speckle noise dominates in both the science and reference frames. Generally speaking, RDI tends not to provide improved sensitivity at small angular separations on targets where spatially resolved circumstellar material dominates the speckle noise. In fact, projecting reference frames of point sources onto the science frames in an attempt to model the stellar PSF modifies the appearance of the circumstellar disk and generates additional speckle noise, which may obscure the true scattered light features and generate point-like false positives. Spatially resolved sources also have a mismatch in the radial size of the main stellar residuals that leaves behind a ring-like residual at the outer edge of the central lobe of the stellar PSF. A similar
effect may occur for objects with vastly different colors, though we have not come across a clear example where chromatic effects dominate.
Lastly, there are speckles that appear in NIRC2 images at ∼7 λ/D from the star whose brightness depends on the telescope elevation. We attribute these speckles to segment-to-segment phasing errors that depend on the direction of the gravity vector with respect to the primary mirror and the azimuthal position depends on the position of the rotator. For this reason, it may be beneficial to use reference stars at similar decl. to the science target and similar instrument settings, including the rotator angle.
5.3. Sources of Night-to-night Variance
The methods outlined above may be generalized to include reference frames from multiple observing nights. However, although the stellar PSF is relatively stable throughout an observing night, it tends to vary considerably from night-to-night for a number of reasons.
The calibration of static wavefront error within NIRC2 uses a phase retrieval algorithm to reconstruct the wavefront from defocused images of the internal source. The solution changes on a nightly basis. Additionally, wavefront errors due to the primary mirror must be sensed and corrected by the Shack-Hartmann wavefront sensor in the Keck AO system (Wizino-wich et al. 2000), but segment piston errors (or the terrace
modes) are not seen by the wavefront sensor and are therefore not corrected. This issue may be mitigated by the pyramid wavefront sensor under development at the Keck Observatory (Bond et al.2018).
For these reasons, reference frames are generally not well correlated from night-to-night. Nevertheless, there may be correlations with instrument settings(e.g., the rotator angle and wavefront sensor parameters) or observing conditions that can assist in frame pre-selection, which will be investigated in future work.
6. Conclusion
Using the examples of HIP79124C and HIP78233B, we have demonstrated that RDI offers improved detection of point sources at small angular separation, by up to a factor of 5 with respect to ADI, further unlocking the potential of the vortex coronagraph on Keck/NIRC2. The observations of MWC758 and 2MASS J16042165−2130284 show that RDI is also beneficial for imaging of circumstellar disks because it preserves the morphology, which allows observers to directly interpret the imaged scattered light distribution. We find that frame pre-selection using image comparison metrics, such as the SSIM, significantly improves the performance of RDI, particularly for point-source detection, astrometry, and photo-metry. RDI may help other current and future ground-based instruments achieve better performance at small angular separations, especially when used in conjunction with small inner working angle coronagraphs, and perform more efficient surveys by relaxing PA rotation requirements. RDI may also be the primary strategy for high-contrast imaging with future space missions, including JWST, WFIRST, HabEx, and LUVOIR.
G.R. is supported by an NSF Astronomy and Astrophysics Postdoctoral Fellowship under award AST-1602444. The data
presented herein were obtained at the W. M. Keck Observatory, which is operated as a scientific partnership among the California Institute of Technology, the University of California, and the National Aeronautics and Space Administration (NASA). The Observatory was made possible by the generous financial support of the W. M. Keck Foundation. The authors wish to recognize and acknowledge the very significant cultural role and reverence that the summit of Maunakea has always had within the indigenous Hawaiian community. We are most fortunate to have the opportunity to conduct observations from this mountain.
Facility: Keck:II(NIRC2).
Software:VIP(Gomez Gonzalez et al. 2017
),QACIT-S(Huby et al. 2015, 2017), Astropy(The Astropy
Colla-boration et al. 2018), orbitize(Blunt et al.2018).
Appendix A
Observing and Image Processing Details
In this section, we outline the details of our observations and the image processing steps used in our team’s pipeline(Xuan et al.2018). All of the observations were carried out using the
KeckII telescope, natural guide star AO, the NIRC2 instru-ment, and the vortex coronagraph mode in the L′ band (3.7 μm). The angular resolution was 0 08 and the plate scale was 0 01 per pixel(Service et al.2016). The field rotator was
set to vertical angle mode, such that the telescope pupil tracks the elevation axis, to enable ADI. In addition to the science frames(see Tables1,3, and4), we took several images of the
off-axis PSF with a discrete integration time(DIT) of 0.008 s and 100 coadds as well as images of the sky background with integration times matching that of the science and off-axis PSF frames. The sky, off-axis PSF, and background frames were taken approximately every 30 minutes during the observing sequence. The alignment of the star and the center of the vortex focal plane mask was maintained by the QACITS tip–tilt control algorithm (Huby et al.2015,2017).
In the preprocessing stage, bad pixels identified in the dark frames and sky flats were replaced by the median of neighboring values in all of the frames. The sky flat was the median of 10 images of a blank patch of sky with the coronagraph focal plane mask removed (DIT of 0.75 s, 10 coadds each). We then subtracted sky background frames, taken with the coronagraph in place, from each frame individually using a scale factor to account for background variability. The frames were centered based on the position of the optical vortex core in the median of the science frames and each of individual science and reference frames were registered using the peak of the cross correlation with the median science
frame. Our pipeline crops the raw 1024×1024 pixel frames to 587×587, which is the largest allowable square frame centered on the vortex focal plane mask.
We applied PCA (Soummer et al. 2012) to estimate and
subtract the stellar contribution from each image using the VIP software package(Gomez Gonzalez et al.2017). In the case of
ADI, the PCs of a subset of pixels in the science frames make up the stellar PSF model. Although our standard pipeline uses a set of default annular reduction regions, we generally modify these regions to bound the companion or disk of interest on a case-by-case basis. For RDI, we derive the PCs and the stellar PSF model only from the reference frames. Each frame is derotated such that north is in the vertical direction and the ADI/RDI image is taken to be the temporal median of the derotated frames. We repeat these steps for all possible numbers of PCs. Later, an optimal number of PCs may be defined by maximizing the detection significance of a real or injected companion, depending on the scientific goal. For instance, an observer may wish to use a different number of PCs for point-source detection and disk imaging.
Appendix B
Error Bars for Astrometry and Photometry of Companions To estimate the errors in the position andflux estimates, with the best-fit companion subtracted from the data, we re-injected the PSF into the preprocessed science frames at the same separation and brightness, but varied the azimuthal angle and retrieved the photometry and astrometry using the same method for each injected companion tracing a full circle about the star. The step size in azimuthal angle was 360°/(2πr), where r is the radial position in units of the FWHM, to ensure that each fit was performed at the location of a quasi-independent speckle sample. We took the standard deviation of the measuredflux and position of the injected companions as the error on each parameter. The S/N is defined as the ratio between estimated flux, F, and the uncertainty in the flux, σF.
Appendix C
Orbit Fitting of Point-source Companions with Orbitize and OFTI
In this section, we provide more details on the orbitfit and posteriors on the point-source companions from the systems discussed in Section3. Table5summarizes the astrometry used in our fit. We use stellar distances from Bailer-Jones et al. (2018) of 132±1 pc and 256±4 pc for HIP 78233 and HIP
79124, respectively. We use total system mass estimates from Hinkley et al.(2015), corresponding to 1.7±0.1 MSunfor HIP
78233 and 2.48±0.45 MSun for HIP 79124. We choose
Table 5
Input Astrometry for Orbit Fitting viaOrbitize
UT Date Separation(mas) Position Angle(°) Reference HIP 78233 B Astrometry
2010 Apr 26 133±3 20±1 Hinkley et al.(2015)
2016 Apr 13 141±64 6±1 this work
HIP 79124 B Astrometry
2008 May 25 990±1 98.11±0.05 Lafrenière et al.(2014)
2016 Apr 13 971.5±1 100.61±0.03 this work
HIP 79124 C Astrometry
2010 Apr 5 177±3 242±1 Hinkley et al.(2015)
uninformed priors for all of the parameters. Namely, for the semimajor axis, we choose a prior probability distribution that is uniformly linear in log space(Jeffreys Prior); for inclination, we choose a prior probability distribution corresponding to p(x) ∝sin(x), and for all other parameters, we choose a linearly uniform prior probability distribution. Wefit the companions as point masses and for the HIP 79124 triple system, we treat each companion independently as their large mutual separation would make interactions between the B and C companions very small. The inclination convention is that 0°i<90° orbits are counterclockwise and 90°i<180° are clockwise.
Using orbitizeʼs OFTI algorithm, we sample 100,000 orbits for each of the three point-source companions and compute posterior probabilities. Figure 8 shows the margin-alized posterior probabilities for orbital semimajor axis, eccentricity, and inclination. These figures also include the prior probability to demonstrate how well the data constrains the orbits. The marginalized posterior on the semimajor axis is the best constraint on the companion’s orbit size when accounting for all available astrometry. For HIP 78233 B and HIP 79124 C, the eccentricity and inclination posteriors are not
well constrained and are not very different from the prior. The eccentricity posterior distribution does show that lower values are more likely than higher values and the inclination posterior distribution disfavors a completely edge-on system(inclination of 90°). For HIP 79124 B, the majority of the eccentricity distribution is at a value below 0.5 and the inclination distribution strongly favors an inclination less than 90°, indicating that the object is orbiting counterclockwise from our viewing angle. These posteriors are available as part of this article’s online data for use in further calculations as a table of orbit samples.
ORCID iDs
Garreth Ruane https://orcid.org/0000-0003-4769-1665
Henry Ngo https://orcid.org/0000-0001-5172-4859
Dimitri Mawet https://orcid.org/0000-0002-8895-4735
Olivier Absil https://orcid.org/0000-0002-4006-6237
Élodie Choquet https://orcid.org/0000-0002-9173-0740
Carlos Gomez Gonzalez https: //orcid.org/0000-0003-2050-1710
Tiffany Meshkat https://orcid.org/0000-0001-6126-2467
Figure 8.Marginalized probability density functions(pdfs) for three orbital parameters from orbit fits of three point-source companions. The blue histogram shows the posterior pdf while the orange curve shows the prior pdf. For the semimajor axis pdf, the median and 68% confidence region centered on the median is labeled as a point with horizontal bars. The posterior samples used to generate these pdfs are available as part of the online data. The data used to create thisfigure are available.
Maddalena Reggiani https: //orcid.org/0000-0003-2911-0898
Nicole Wallack https://orcid.org/0000-0003-0354-0187
W. Jerry Xuan https://orcid.org/0000-0002-6618-1137
References
Aime, C., & Soummer, R. 2004,ApJL,612, L85
Allard, F., Homeier, D., & Freytag, B. 2012,RSPTA,370, 2765
Bailer-Jones, C. A. L., Rybizki, J., Fouesneau, M., Mantelet, G., & Andrae, R. 2018,AJ,156, 58
Bailey, V. P., Bottom, M., Cady, E., et al. 2018,Proc. SPIE,10698, 106986P
Benisty, M., Juhasz, A., Boccaletti, A., et al. 2015,A&A,578, L6
Biller, B. A., & Bonnefoy, M. 2017, in Handbook of Exoplanets, ed. H. Deeg & J. Belmonte(Cham: Springer),101
Blunt, S., Ngo, H., Wang, J., et al. 2018, Sblunt/Orbitize: Orbitize Initial Release, Zenodo, doi:10.5281/zenodo.1475227
Blunt, S., Nielsen, E. L., De Rosa, R. J., et al. 2017,AJ,153, 229
Bond, C. Z., Wizinowich, P., Chun, M., et al. 2018, Proc. SPIE, 10703, 107031Z
Bowler, B. P. 2016,PASP,128, 102001
Canovas, H., Hardy, A., Zurlo, A., et al. 2017,A&A,598, A43
Carpenter, J. M., Ricci, L., & Isella, A. 2014,ApJ,787, 42
Chauvin, G. 2018,Proc. SPIE,10703, 1070305
Choquet, E., Perrin, M. D., Chen, C. H., et al. 2016,ApJL,817, L2
de Zeeuw, P. T., Hoogerwerf, R., de Bruijne, J. H. J., Brown, A. G. A., & Blaauw, A. 1999,AJ,117, 354
Espaillat, C., Calvet, N., D’Alessio, P., et al. 2007,ApJL,670, L135
Foo, G., Palacios, D. M., & Swartzlander, G. A. 2005,OptL,30, 3308
Gaudi, B. S., Seager, S., Mennesson, B., et al. 2018, arXiv:1809.09674
Gerard, B. L., & Marois, C. 2016,Proc. SPIE,9909, 990958
Golimowski, D. A., Ardila, D. R., Krist, J. E., et al. 2006,AJ,131, 3109
Gomez Gonzalez, C. A., Wertz, O., Absil, O., et al. 2017,AJ,154, 7
Goodman, J. W. 1975, in Laser Speckle and Related Phenomena, ed. J. C. Dainty(Berlin: Springer),9
Grady, C. A., Muto, T., Hashimoto, J., et al. 2013,ApJ,762, 48
Green, J. J., Beichman, C., Basinger, S. A., et al. 2005, Proc. SPIE,5905, 59050L
Groff, T., Chilcote, J., Brandt, T., et al. 2017,Proc. SPIE,10400, 1040016
Guidi, G., Ruane, G., Williams, J. P., et al. 2018,MNRAS,479, 1505
Guyon, O. 2018,ARA&A,56, 315
Guyon, O., Pluzhnik, E. A., Kuchner, M. J., Collins, B., & Ridgway, S. T. 2006,ApJS,167, 81
Hinkley, S., Kraus, A. L., Ireland, M. J., et al. 2015,ApJL,806, L9
Hinkley, S., Oppenheimer, B. R., Zimmerman, N., et al. 2011,PASP,123, 74
Huby, E., Baudoz, P., Mawet, D., & Absil, O. 2015,A&A,584, A74
Huby, E., Bottom, M., Femenia, B., et al. 2017,A&A,600, A46
Jovanovic, N., Martinache, F., Guyon, O., et al. 2015,PASP,127, 890
Konopacky, Q. M., Marois, C., Macintosh, B. A., et al. 2016,AJ,152, 28
Lafrenière, D., Jayawardhana, R., van Kerkwijk, M. H., Brandeker, A., & Janson, M. 2014,ApJ,785, 47
Lafrenière, D., Marois, C., Doyon, R., & Barman, T. 2009,ApJL,694, L148
Lagrange, A. M., Gratadour, D., Chauvin, G., et al. 2009,A&A,493, L21
Macintosh, B., Graham, J. R., Ingraham, P., et al. 2014,PNAS,111, 12661
Marois, C., Lafrenière, D., Doyon, R., Macintosh, B., & Nadeau, D. 2006,ApJ,
641, 556
Marois, C., Macintosh, B., Barman, T., et al. 2008,Sci,322, 1348
Marois, C., Zuckerman, B., Konopacky, Q. M., Macintosh, B., & Barman, T. 2010,Natur,468, 1080
Mathews, G. S., Williams, J. P., & Ménard, F. 2012,ApJ,753, 59
Mawet, D., Choquet, É., Absil, O., et al. 2017,AJ,153, 44
Mawet, D., Mennesson, B., Serabyn, E., Stapelfeldt, K., & Absil, O. 2011,
ApJL,738, L12
Mawet, D., Milli, J., Wahhaj, Z., et al. 2014,ApJ,792, 97
Mawet, D., Pueyo, L., Lawson, P., et al. 2012,Proc. SPIE,8442, 844204
Mawet, D., Riaud, P., Absil, O., & Surdej, J. 2005,ApJ,633, 1191
Mawet, D., Serabyn, E., Liewer, K., et al. 2010,ApJ,709, 53
Mayama, S., Hashimoto, J., Muto, T., et al. 2012,ApJL,760, L26
Meeus, G., Montesinos, B., Mendigutía, I., et al. 2012,A&A,544, A78
Meshkat, T., Mawet, D., Bryan, M. L., et al. 2017,AJ,154, 245
Milli, J., Mouillet, D., Lagrange, A.-M., et al. 2012,A&A,545, A111
Pecaut, M. J., Mamajek, E. E., & Bubar, E. J. 2012,ApJ,746, 154
Pinilla, P., Benisty, M., de Boer, J., et al. 2018,ApJ,868, 85
Pinilla, P., de Boer, J., Benisty, M., et al. 2015,A&A,584, L4
The Astropy Collaboration, Price-Whelan, A. M., Sipőcz, B. M., et al. 2018,
AJ,156, 123
Pueyo, L. 2016,ApJ,824, 117
Pueyo, L., Zimmerman, N., Bolcar, M., et al. 2017, Proc. SPIE, 10398, 103980F
Reggiani, M., Christiaens, V., Absil, O., et al. 2018,A&A,611, A74
Ren, B., Dong, R., Esposito, T. M., et al. 2018,ApJL,857, L9
Ren, B., Pueyo, L., Zhu, G. B., Debes, J., & Duchêne, G. 2018,ApJ,852, 104
Rice, W. K. M., Armitage, P. J., Wood, K., & Lodato, G. 2006,MNRAS,
373, 1619
Ruane, G., Mawet, D., Kastner, J., et al. 2017,AJ,154, 73
Ruane, G., Mawet, D., Mennesson, B., Jewell, J., & Shaklan, S. 2018,JATIS,
4, 015004
Ruffio, J.-B., Mawet, D., Czekala, I., et al. 2018,AJ,156, 196
Schneider, G., Grady, C. A., Hines, D. C., et al. 2014,AJ,148, 59
Schneider, G., Weinberger, A. J., Becklin, E. E., Debes, J. H., & Smith, B. A. 2009,AJ,137, 53
Serabyn, E., Huby, E., Matthews, K., et al. 2017,AJ,153, 43
Serabyn, E., Mawet, D., & Burruss, R. 2010,Natur,464, 1018
Service, M., Lu, J. R., Campbell, R., et al. 2016,PASP,128, 095004
Song, I., Zuckerman, B., & Bessell, M. S. 2012,AJ,144, 8
Soummer, R., Hagan, J. B., Pueyo, L., et al. 2011,ApJ,741, 55
Soummer, R., Pueyo, L., & Larkin, J. 2012,ApJL,755, L28
Sparks, W. B., & Ford, H. C. 2002,ApJ,578, 543
Spergel, D., Gehrels, N., Baltay, C., et al. 2015, arXiv:1503.03757
The LUVOIR Team 2018, arXiv:1809.09668
Vigan, A., Bonnefoy, M., Ginski, C., et al. 2016,A&A,587, A55
Wang, Z., Bovik, A. C., Sheikh, H. R., & Simoncelli, E. P. 2004,ITIP,13, 600
Wizinowich, P., Acton, D. S., Shelton, C., et al. 2000,PASP,112, 315
Wright, E. L., Eisenhardt, P. R. M., Mainzer, A. K., et al. 2010,AJ,140, 1868