THERMO-ELASTIC DEFORMATION MEASUREMENT OF THE EUCLID
NEAR INFRARED FOCAL PLANE ARRAY BY LONG WAVE INFRARED
DIGITAL HOLOGRAPHY
J.-F. Vandenrijt1, C. Thizy1, L. Salvador1, F. Beaumont2, J. Garcia2, L. Martin2, C. Fabron2, E. Prieto2, T. Maciaszek2, M. Georges1, E. Renotte1.
1Centre Spatial de Liège – Université de Liège, Avenue du Pré Aily, 4031 Angleur, Belgium.
2Laboratoire d’Astrophysique de Marseille, Rue Frédéric Joliot Curie, 13013 Marseille, France.
I. INTRODUCTION
The Near Infrared Spectrometer and Photometer (NISP) is an instrument onboard the Euclid mission from the European Space Agency. Its role is to measure the redshift of galaxies by observing adjacent non-overlapping areas of sky. The instrument focal plane array (FPA) is composed of 16 detectors mounted on a structure cooled down to 95 K. The flatness of the FPA has to be ± 10 µm to achieve the required imaging performance of the instrument.
In this paper we present the thermal vacuum test performed on the demonstration model of the FPA to measure its thermo-elastic deformation when cooled down to its operational temperature.
The measurement system selected is a long-wave infrared (LWIR) digital holographic interferometer. It is composed of a CO2 laser emitting at a wavelength of 10.6 µm combined with a commercial thermographic camera. The surface of the FPA being specular, the speckle wavefront is produced by illuminating a diffuser with the laser beam, and is then observed after reflection on the FPA surface. This reflected speckle wavefront behaves exactly as if the FPA was a diffusive surface, producing its own speckle, allowing the measurement of its deformation. This technique has been previously demonstrated to measure the surface displacements of specular sample under thermal vacuum conditions [1]. The choice of this system was driven by the fact that the required measurement accuracy is ± 1 µm, which is compatible with this kind of instrument. Also, this type of interferometer is less sensitive to mechanical vibration perturbations, which makes its implementation in a vacuum chamber easier.
A temporal phase unwrapping algorithm has been implemented in order to measure the relative out-of-plane displacement between each detector [2]. The measurement uncertainty of the system was evaluated in the laboratory by measuring the tilts and out-of-plane translations of a spare detector. These displacements were measured in parallel with a visible interferometer.
The FPA is part of the NISP Detection System (NI-DS). In order to be representative of the flight configuration, the whole NI-DS is implemented in the vacuum chamber. A thermal analysis has been carried out to design the thermal tent around the NI-DS in order to reach the required temperature on the detectors (90– 100 K) and their electronics (140–145 K). The test bed was designed based on the thermal simulations and the optical set-up of the measurement system. The reliability of the measurement system was validated during a blank test. The thermal vacuum test of the NI-DS was performed in a facility at Centre Spatial de Liège (CSL). II. PERFORMANCE EVALUATION IN THE LABORATORY
A. Optical set-up
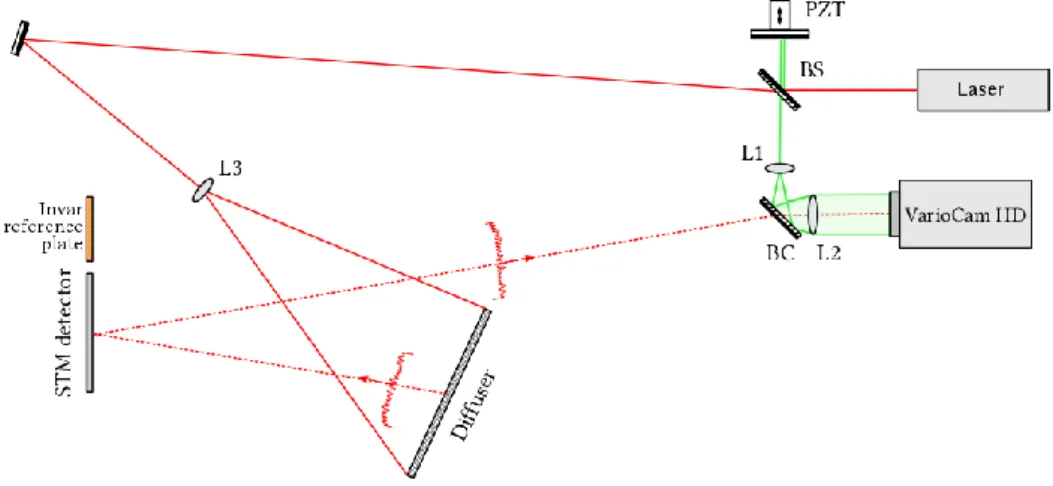
The Digital Holography (DH) system was first assembled on an optical table in the laboratory to check the design. The optical set-up for the NI-DS test is shown at Fig. 1. It is composed of a beam-splitter (BS) that divides the CO2 laser beam into a reference beam and an object beam. The reference beam is reflected on a piezo-reflector (PZT), which realizes the phase-stepping, and passes through a doublet of lenses (L1 and L2) that enlarge the reference beam to cover completely the camera detector. The camera is a VarioCam HD from Infratec equipped with a 1024 × 768 pixels microbolometer detector array, without any objective mounted.
The object beam is used to illuminate a large diffuser with lens L3 to produce the speckle illumination. The diffuser is a sandblasted Invar plate. A spare STM (Structural and Thermal Model) detector (STMD) was implemented as the test article to be representative of the thermal vacuum test (TVT). The light from the diffuser is reflected on the STMD and superposed to the reference beam on the detector with the beam-combiner (BC).
B. Verification of the performances
The STMD was clamped inside a metallic interface, which was screwed on an assembly composed of a translation stage on top of a rotation stage, fixed on the optical table (Fig. 2). To compensate the thermal expansion of the optical table during the measurements, an Invar reference plate was clamped next to it. Any displacement of this plate observed by DH is caused by the expansion/contraction of the optical bench.
To determine the precision and accuracy of the DH instrument, parallel measurement of both piston and tilt of the STMD were performed with a commercial visible light interferometer (Fig. 2). This interferometer can achieve 0.01 µm accuracy for translation and 0.1 arcsec for rotation. This rotation amplitude represents a differential displacement between the opposite edges of the STMD of less than 0.02 µm. The interferometer can therefore be considered as the reference system compared to the expected performances of the DH instrument.
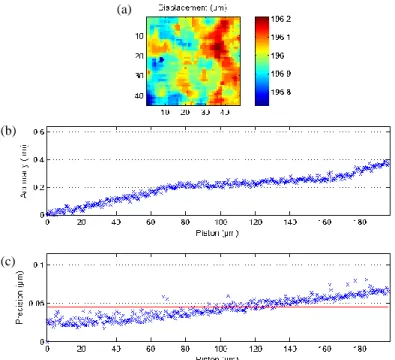
The translation measurements have been performed step by step, with step of 0.5 µm and a maximum range of 200 µm. Each step is recorded by DH and after performing temporal unwrapping a 2D displacement map of the STMD is obtained. From the displacement map, we compute the piston and tilt of the STMD by the method of the least squares. The RMS difference of the measurements between the visible interferometer and DH provides the accuracy of the DH measurement, and the RMS difference between the least squares fit and the displacement map provides the precision.
An example of a DH measurement is shown at Fig. 3. Both accuracy and precision increase with time, which is mainly due to the difficulties to avoid temperature variation during the measurements. Multiple translation tests have been performed. A minimum accuracy of 0.3 µm and a precision as low as 0.05 µm were obtained.
For the rotation measurements, steps of 0.002, 0.001 and 0.0005 degree were applied, which represent a differential displacement between the opposite edges of the STMD of respectively 1.37, 0.68, and 0.34 µm, over a maximum range of 200 µm of differential displacement. The interferometer in this configuration gives an angle. To compare with DH, this angle is converted to relative edges displacement:
) tan(a
L
d= (1)
where d is the relative displacement of the edges of the STMD, L the width of the STMD and α the angle measured with the interferometer.
The measured accuracy for rotation amplitudes of 20 µm (as expected for the NI-DS thermal vacuum test) is 0.2 µm and the precision is of the order of 0.3 µm.
By combining translation and rotation results, the performances of the DH system comply with the requirement for the NI-DS TVT: the DH system has an expected precision of 0.3 µm, with an accuracy of 0.3 µm.
Fig. 1. Optical set-up for the DH measurements of the displacements of the NI-DS.
Fig. 2. Measurement of the displacements of the STMD by digital holography and in parallel with a visible
interferometer. STMD Reference plate Translation stage Rotation stage Interferometer
III. THERMAL VACUUM TEST A. NI-DS description
The Demonstration Model (DM) of the NI-DS was tested. It is presented in Fig. 4 and Fig. 5.
The SiC (Silicon Carbide) P4 panel is used to interface the NI-DS on the NISP. For the TVT, a P4 in Invar was used to ease the integration and the mounting of the NI-DS on its support via P4.
The FPA of the NI-DS is composed of 4 × 4 infrared detectors manufactured by Teledyne (Fig. 6). Twelve detectors are STM and have a surface of bare silicon. Two detectors are MUX – equivalent to a flight model (FM) detector but without the photosensitive layer – and two detectors are FM. The overall dimensions of the FPA are 170 × 170 mm² and it is surrounded by a baffle. The detectors are mounted on a molybdenum Cold Support Structure (CSS), which is screwed to P4 through three titanium blades. The CSS is equipped with 4 PT111 to monitor its temperature.
The electronic box of each detector, called SIDECAR (System for Image Digitization, Enhancement, Control And Retrieval), is mounted on the aluminium SIDECAR Support Structure (SSS), which is also screwed to the P4 via three titanium blades. The SSS is equipped with 2 PT111 for temperature measurement. For the TVT, the harnesses of the SIDECARs are not present and therefore the electronics is not powered. The heat flux generated by the SIDECARs is simulated by thermally regulating the SSS at a temperature representative of the flight conditions, about 140 K.
Fig. 3. Example of a translation test: (a) displacements map of the STMD measured by DH; (b) RMS difference
between the DH measurements and the visible interferometer ones (this corresponds to the accuracy of the instrument); (c) RMS difference between the least squares fit and the displacement map shown in (a) (this corresponds to the precision of the instrument). The RMS values of accuracy and precision are shown with a red
line in both figures (b) and (c).
4x4 detectors
P4
Baffle
Fig. 4. Front view of the NI-DS.
SSS CSS P4 SIDECARs CSS blade SSS blade
Fig. 5. Back view of the NI-DS.
STM STM STM STM STM STM STM STM STM STM MUX FM STM STM FM MUX
Fig. 6. Positioning of the
FPA detectors.
(a)
(b)
B. Thermal analysis
The DH system design shows that to measure the FPA, the useful surface of the diffuser is 280 × 280 mm² with the diffuser at 500 mm from the detectors. This means that the front panel of the thermal tent has to have a large aperture to avoid blocking the laser beam incident on the FPA, which induces thermal losses. In addition the diffuser has therefore a large view factor on the cold environment of the thermal tent, which induces temperature variations and gradients in the diffuser. The consequence could be that instead of measuring only the deformation of the detectors, the DH system will also measure the deformation of the diffuser. Based on the DH optical set-up and a preliminary test bed design, a thermal analysis has therefore been carried out to check the impact of the diffuser on the cooling-down of the FPA and vice-versa in order to properly design the thermal tent around the NI-DS. The geometrical mathematical model (GMM) has been implemented from the CAD model. The CADBench software was used to further simplify the geometry to create the ESATAN-TMS model (Fig. 7). The GMM is composed of the NI-DS, the thermal panels and the diffuser. The vacuum chamber was also modeled to take into account the reflections on its wall.
The target temperatures for the analysis are 90–100 K on the detectors, with a thermal gradient on the detector mosaic lower than 2 K, and 140–145 K on the SIDECARs. The initial boundary conditions are a temperature of 294 K in the vacuum chamber and a temperature of 85 K for the thermal panels. The CSS is conductively linked to the top and bottom thermal panels at 85 K. The SSS is conductively linked to the back thermal panel at 140 K.
The thermal analysis showed that an extension baffle was necessary to reach the operational temperature and to reduce the thermal gradient on the FPA. It also showed that the temperature variations and gradients in the diffuser were too high to guarantee that the diffuser will not deform. To overcome this problem, heaters glued on the backside of the diffuser were implemented and the diffuser was chosen to be in Invar.
After the blank test, the thermal analysis was updated. The significant change was a temperature of the thermal panels of 79 K / 137 K instead of 85 K /140 K considered in the initial analysis. The FPA temperature calculated form the updated model is presented in Fig. 8. The thermal gradient on the detectors is 1.5 K and the FPA maximum temperature is 87 K once the stabilization is reached.
C. Test set-up
The TVT was performed in one of CSL’s facility with a useful volume for the specimen of 3 m in diameter and 2.4 m of height.
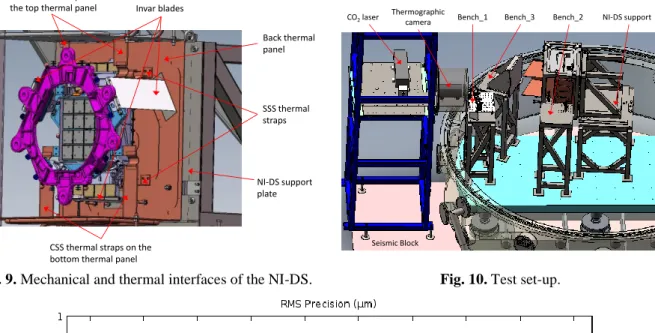
One part of the DH system is located outside of the vacuum chamber (Fig. 10) on a tower lying on the seismic block of the chamber: the CO2 laser and the thermographic camera. They are located in front of a re-entrant flange equipped with ZnSe windows. The remaining parts of the DH system are mounted on the optical bench of the vacuum chamber: bench_1 with the BS, BC, L1, L2 and the PZT (Fig. 1), bench_2 with the folding mirror and the illumination lens L3 and bench_3 with the Invar diffuser.
The integration of the NI-DS in the vacuum chamber was performed by the Laboratoire d’Astrophysique de Marseille (LAM). The NI-DS is screwed to its support plate via P4 with three Invar blades (Fig. 9), which provides a quasi-static mounting.
The thermal tent is composed of six thermal panels. The back panel is connected to a GN2 line and is used to cool-down the SSS to 140 K with four thermal straps. The other five panels are connected in serial to a LN2 line. The top and bottom panels are used to cool-down the CSS to 90 K with two thermal straps each.
D. Blank test
To verify the performances of the DH instrument in thermal vacuum conditions, an acceptance test was
performed by replacing the NI-DS with a 170x170 mm² Invar plate. The test set-up and the thermal panels temperature were identical to the ones of the TVT (Fig. 10). The thermal impact on the DH system was therefore the same as the one for the TVT. The difference compared to the TVT was that the Invar plate was cooled-down radiatively.
Thermo-mechanical simulations showed that no deformation of the Invar plate was expected during the test, only rigid body movements (RBMs). These RBMs are removed from the DH measured displacement by performing least squares fitting. This therefore means that any residual deformation measured on the plate after removing the RBMs contribution can be attributed to the DH system. The thermal conditions and duration of the blank test were equivalent to the ones planned for the final TVT. This therefore allows computing the measurement uncertainty of the DH system in the real conditions of the TVT.
DH measurements every 10 seconds were performed during the cooling-down of the Invar plate and the RMS precision has been measured for each acquisition (Fig. 11). One can notice that it is gradually increasing through the test. Investigations have shown that a large cause of this increase is the relative displacements of the optical components in the vacuum chamber. The performances achieved in the laboratory are therefore degraded. By combining the measurement accuracy measured in the lab (0.3 µm) and the precision measured during the blank test (0.7 µm) the computed quadratic measurement uncertainty of the DH system in the conditions of the TVT is 0.8 µm. This measurement uncertainty – however larger than in the laboratory conditions – still remains below the 1 µm specification, for a test duration equivalent to the one expected for the TVT of the NI-DS.
E. Test of the NI-DS
For the TVT, the MUX detector in the bottom right corner was not measured. It is represented in gray in Fig. 8. During the integration and the optical set-up alignment in the vacuum chamber no reflection of the diffuser by this MUX was observed along the optical axis of the thermographic camera. This was probably due to its surface reflectivity and/or its orientation that prevented its measurement.
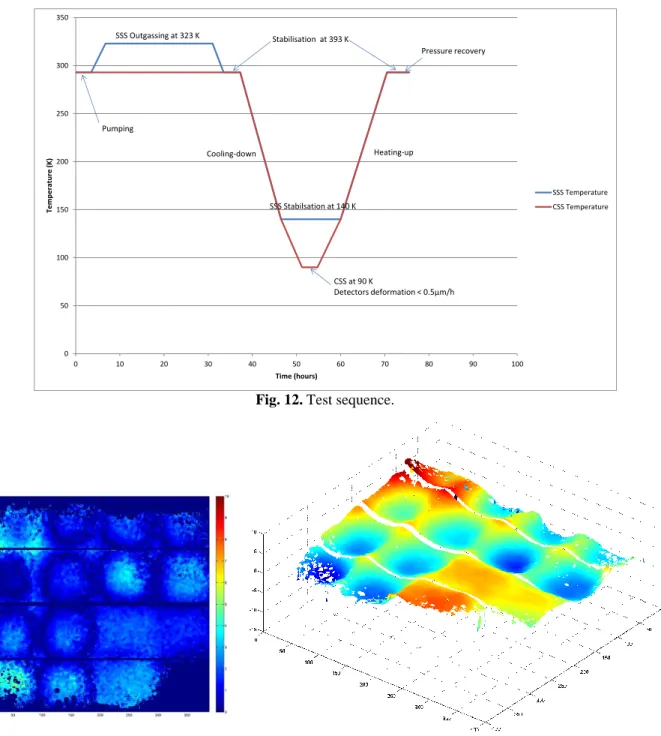
The test sequence that was performed during the TVT is presented in Fig. 12. An outgassing of the SIDECARs was needed to avoid any breakdown when cooled down to their operational temperature. The maximum cooling/heating rate of the NI-DS was 20 K/h. A measurement of the FPA deformation was performed during the cooling-down and the heating-up sequence. DH measurements every 30 seconds were performed. The criteria to stop the cooling-down and heating-up phases of the test are that the expected temperature of the SSS and CSS was reached and that the variation of the deformation of the detectors was less than 0.5 µm/h.
Invar blades CSS thermal straps on
the top thermal panel
SSS thermal straps
CSS thermal straps on the bottom thermal panel
Back thermal panel
NI-DS support plate
Fig. 9. Mechanical and thermal interfaces of the NI-DS.
CO2laser
Thermographic
camera Bench_1 Bench_3 Bench_2 NI-DS support
Seismic Block
Fig. 10. Test set-up.
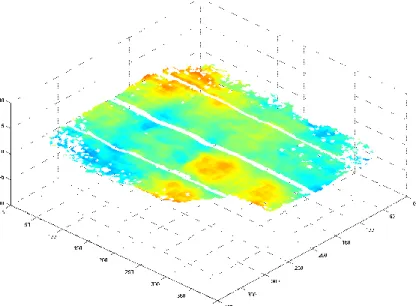
The FPA deformation measured during the cooling-down between 293 K and 90 K is presented in Fig. 13 and Fig. 14. This deformation is obtained after removing the RBMs of the FPA with a least squares fit. The flatness requirement of the FPA is that the detectors remains within ± 10 µm from their starting position. The test results shows that this requirement is fulfilled. It has also been observed that the FM and MUX detectors mainly undergo piston and tilts while the STM detectors are more subject to a buckling deformation. An expected lack of information is observed on the top and the bottom of the FPA as well as in the corners. This is due to the shadowing of the illumination by the NI-DS geometry (P4, baffle) and also to the gaussian shape of the laser beam illuminating the diffuser. A mask is applied to remove these noisy areas.
The residual detectors deformation has also been measured (Fig. 15 and Fig. 16). It is the difference between the shape of the detectors at 293 K after the heating-up sequence and their shape before the cooling-down sequence at 293 K. The RMS residual detector deformation is 0.5 µm, which is compatible with the 0.8 µm measurement uncertainty of the DH system evaluated during the blank test and proves the reliability of the DH instrument. 0 50 100 150 200 250 300 350 0 10 20 30 40 50 60 70 80 90 100 Te m p e rat u re ( K) Time (hours) SSS Temperature CSS Temperature SSS Outgassing at 323 K Cooling-down Heating-up SSS Stabilsation at 140 K CSS at 90 K Detectors deformation < 0.5µm/h Pumping Pressure recovery Stabilisation at 393 K
Fig. 12. Test sequence.
Fig. 13. Detectors deformation during the
cooling-down from 293 K to 90 K.
Fig. 14. 3D map of the detectors deformation during the cooling down
IV. CONCLUSIONS
In this paper, we have presented the successful measurement of the FPA deformation of the NI-DS instrument on-board the Euclid mission. CSL has fully developed the instrument, the test bed and the thermal environment to perform DH measurement of the FPA deformation during a thermal vacuum test. The technique was first validated in the laboratory before being revalidated in thermal vacuum conditions: a measurement uncertainty of 0.8 µm was demonstrated. The detectors deformations measured during the cooling down sequence between 293 K and 90 K and also during the heating-up sequence between 90 K and 293 K were presented. The RMS difference between the FPA deformations measured during these two sequences was 0.5 µm, which demonstrates the reliability of the DH system.
A correlation between the test results and the finite element analysis results will be performed in the next months by the LAM. This correlation will define whether the NI-DS FM will be tested or not.
V. REFERENCES
[1] J.-F. Vandenrijt, C. Thizy, M. P. Georges, P. Queeckers, F. Dubois, and D. Doyle, “Long-wave infrared digital holography for the qualification of large space reflectors,” Proc. Of the International Conference on Space Optics 2012, October 2012.
[2] J. M. Huntley, and H. O. Saldner, “Temporal phase-unwrapping algorithm for automated interferogram analysis,” Appl. Opt. 32, pp. 3047–3052, 1993.
Fig. 15. Residual detectors deformation
back at 293 K after warm-up.
Fig. 16. 3D map of the residual detectors deformation back at 293 K