8th World Congress on Genetics Applied to Livestock Production, August 13-18, 2006, Belo Horizonte, MG, Brasil
CORRELATIONS OF LONGEVITY EVALUATION WITH TYPE TRAITS IN WALLOON REGION
S. Vanderick1, C. Croquet1,2, P. Mayeres3, H. Soyeurt1,4 and N. Gengler1,2
1 Animal Science Unit, Gembloux Agricultural University, B-5030 Gembloux, Belgium 2 National Fund for Scientific Research, B-1000 Brussels, Belgium
3 Walloon Breeding Association, B-5590 Ciney, Belgium 4 F.R.I.A., B-1000 Brussels, Belgium
INTRODUCTION
Since May 2005 a genetic evaluation system for longevity has been introduced for dairy cattle of Walloon Region in Belgium. The genetic evaluation used is based on lactation survival using a lactation random regression model equivalent to a multi-lactation model that allows including records from previous lactation of cows that are still alive. More information concerning the evaluation system can be found in Gengler et al. (2005).
The main purpose of this study was to investigate the genetic relationships between direct longevity and type traits (linear and synthetic) in a Holstein sire population.
MATERIAL AND METHODS
Longevity evaluations. Genetic evaluations of longevity were obtained from the lactation
records that were used for the genetic evaluation of production extended to all known lactations of cows with at least a first lactation. Data consisted of 1,130,533 lactation records on 392,890 Holstein (at least 75% Holstein or Red-Holstein genes) cows. Genetic evaluations were submitted to INTERBULL for 1,394 sires.
Type evaluations. Type traits could be scored during all lactations, the animals were required
to have at least one score before the fourth calving. Data for type included 90,782 type records with a maximum of 33 observed type traits from 81,491 Holstein cows. The genetic evaluation model used for type traits is a multi-trait repeatability model which takes into account links between type traits. It is based on the system used for the genetic evaluation of non-Holstein breeds in the US (Gengler et al., 1999, Gengler et al., 2001a, Gengler et al., 2001b). It uses canonical transformations and is set up to allow missing traits. The adjustment for heterogeneous variance is also integrated. Genetic evaluations were submitted to INTERBULL for 755 sires.
Data used for this study. Data were based on results for type traits (77,965 records) and for
direct longevity (74,289 records) from the INTERBULL routine run of November 2005. Type information consisted of genetic breeding values of 16 linear traits and 3 synthetic traits evaluated by INTERBULL
A list of all traits is given in Table 1, the 8 synthetic traits were development, overall rump, feet and legs, overall udder score, overall fore udder, overall rear udder, dairy character and final conformation score. The 25 linear traits were those recommended by the World Holstein Federation (16 traits) but also some additional traits as bone quality, udder balance, rump width… The 14 type traits (9 linear and 5 synthetic) not processed by INTERBULL are predicted starting from the information transmitted by INTERBULL by using a selection index procedure (Weigel et al, 1998) using the (co)variances used in the regional genetic evaluation. Whenever Walloon results exist for these same traits, the breeding values were combined using a weighted average (Weigel et al, 1998). The results are similar to a pseudo-MACE
8th World Congress on Genetics Applied to Livestock Production, August 13-18, 2006, Belo Horizonte, MG, Brasil
(Multiple Across Country Evaluation) for the traits not processed by INTERBULL, as international information is combined with information from the Walloon genetic evaluation system.
Statistical analyses.
Correlations between longevity and type traits were estimated weighted by the reliability of longevity breeding value. These correlations were not exactly genetic correlations but should approximate genetic correlations in a similar fashion as proposed by Calo et al. (1973). The underlying assumption was that the correlations of breeding values that were known without error would yield correct genetic correlations.
RESULTS AND DISCUSSION
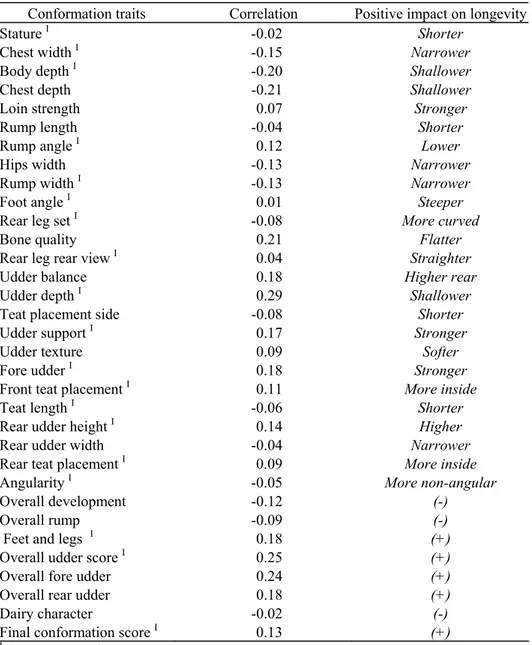
Table 1 contains the approximated genetic correlations between longevity and type traits (linear and composite type traits). Positive impact on longevity is also presented in this Table 1.
The linear traits with the strongest effect on longevity were udder depth, bone quality, chest depth and body depth. Among the synthetic type traits, the highest impacts on longevity were found for traits related to udder system and for the feet and legs score. Jairath et al. (1998) found the same stronger relationships of udder and feet and legs with longevity based on Canadian data. Correlations between longevity and classical linear traits describing feet and legs were quiet low with values below 0.10. This is an indication that the non-linear nature of the optima of these traits limits their relationship with longevity. The synthetic feet and legs score integrates this non-linear nature (deviations from the optimum on a phenotypical level) and is therefore more correlated. Surprising was that bone quality had a clearly higher correlation with longevity even if the direct information was limited. However this result is in line with Schneider et al. (2003) who reported an important impact of this trait on length of productive life. Unfortunately bone quality is a trait that is not taken in many countries. A trait that was very disappointing was foot angle, however using data from other countries (Sweden, Switzerland, Italy and Denmark) Powell and VanRaden (2003) reported similar results. In this study, a negative correlation indicated that a higher score for the trait was associated with a shorter longevity, and thus with a higher risk of being culled. Correlations between longevity and chest width, chest depth and body depth were strong, and negative: a high breeding value for chest width or body depth was associated with a shorter longevity. Currently, we can only hypothesize that this is linked to a higher risk of displaced abomasum or to more fertility or calving problems for stronger cows.
A smaller and less heavy animal seemed to have a better direct longevity than a taller and especially heavier animal. However final conformation score showed a positive correlation. According to these observations, a balanced morphological animal seems to have a greater longevity.
These results confirmed that some type traits could be good factors to predict indirect longevity. We will use them in the near future to improve the current longevity evaluations done in the Walloon Region of Belgium. They will also be used to improve overall economic indexes.
8th World Congress on Genetics Applied to Livestock Production, August 13-18, 2006, Belo Horizonte, MG, Brasil
Table 1. Correlations of linear and composite type traits with direct longevity
Conformation traits Correlation Positive impact on longevity
Stature I -0.02 Shorter
Chest width I -0.15 Narrower
Body depth I -0.20 Shallower
Chest depth -0.21 Shallower
Loin strength 0.07 Stronger
Rump length -0.04 Shorter
Rump angle I 0.12 Lower
Hips width -0.13 Narrower
Rump width I -0.13 Narrower
Foot angle I 0.01 Steeper
Rear leg set I -0.08 More curved
Bone quality 0.21 Flatter
Rear leg rear view I 0.04 Straighter
Udder balance 0.18 Higher rear
Udder depth I 0.29 Shallower
Teat placement side -0.08 Shorter
Udder support I 0.17 Stronger
Udder texture 0.09 Softer
Fore udder I 0.18 Stronger
Front teat placement I 0.11 More inside
Teat length I -0.06 Shorter
Rear udder height I 0.14 Higher
Rear udder width -0.04 Narrower
Rear teat placement I 0.09 More inside
Angularity I -0.05 More non-angular
Overall development -0.12 (-)
Overall rump -0.09 (-)
Feet and legs I 0.18 (+)
Overall udder score I 0.25 (+)
Overall fore udder 0.24 (+)
Overall rear udder 0.18 (+)
Dairy character -0.02 (-)
Final conformation score I 0.13 (+)
I INTERBULL trait
CONCLUSION
The estimated approximate genetic correlations showed that there are important relationships between type traits and direct longevity. Strong positive relationships with longevity have been established for bone quality and udder depth. For the synthetic type traits, the same conclusions can be drawn for overall udder score and overall fore udder. Weaker negative correlations were estimated for body depth and chest depth.
The results show the interest to study, more in detail, links between type traits and longevity in order to develop combined longevity evaluations and to improve the current genetic evaluation system for longevity of the cows in our herds. Other traits, as fertility and somatic cell scores, will be used to improve these evaluations.
8th World Congress on Genetics Applied to Livestock Production, August 13-18, 2006, Belo Horizonte, MG, Brasil
REFERENCES
Calo, L.L., McDowell, R.E., VanVleck, L.D., and Miller, P.D. (1973). J. Anim. Sci. 37: 676-682.
Gengler, N., Wiggans, G.R., and Wright, J.R. (1999). J. Dairy Sci. 82: 1350-1372.
Gengler, N., Dusseldorf, T., Wiggans, G.R., Wright, J.R., and Druet, T. (2001a.) J. Dairy Sci.
84: 1772.
Gengler, N., Wiggans, G.R., and Wright, J.R. and Druet, T. (2001b.) J. Dairy Sci. 84 (Suppl.1):
247 (abstr. 1022).
Gengler, N., Vanderick, S., Mayeres, P., Gillon, A. and Croquet, C. (2005) Interbull Bulletin
33: 176-180.
Jairath, L., Dekkers, J.C.M, Schaeffer, L.R., Liu, Z., Burnside, E.B. and Kolstad, B. (1998)
J. Dairy Sci. 81: 550-562.
Powell, R.L. and VanRaden, P.M. (2003) Interbull Bulletin 30: 15-19.
Schneider M. del P., Dürr, J.W., Cue R.I. and Monardes, H.G. (2003) J. Dairy Sci. 86: 4083-4089.
Weigel, K.A., Lawlor T.J., VanRaden P.M. and Wiggans G.R. (1998) J. Dairy Sci. 81: 2040-2044.