Relationship between follicular volume and oocyte
competence, blastocyst development and live-birth rate:
optimal follicle size for oocyte retrieval
B. WIRLEITNER
1, J. OKHOWAT
1, L. VI ˇSTEJNOV ´A
2, M. KR ´AL´I ˇCKOV ´A
2, M. KARL´IKOV ´A
2,3,
P. VANDERZWALMEN
1,4, F. ECTORS
5, L. HRADECK ´Y
6, M. SCHUFF
1and M. MURTINGER
1 1IVF Centers Prof. Zech – Bregenz, Bregenz, Austria;2Biomedical Center, Faculty of Medicine in Pilsen, Charles University, Pilsen, CzechRepublic;3Laboratory of Immunoanalysis, Department of Nuclear Medicine, Medical School and Teaching Hospital in Pilsen, Charles
University, Pilsen, Czech Republic;4Centre Hospitalier Inter R´egional Edith Cavell (CHIREC), Braine-l’Alleud, Bruxelles, Belgium; 5Transgenic Platform, FARAH and GIGA Research Centers, University of Li`ege, Li`ege, Belgium;6IVF Centers Prof. Zech – Pilsen, Pilsen,
Czech Republic
K E Y W O R D S: 3D ultrasound; blastocyst culture; follicular fluid; follicular volume; GnRHa long protocol; IVF outcome; live
birth rate; oocyte competence
ABSTRACT
Objective To analyze oocyte competence in
gonadotropin-releasing hormone agonist (GnRHa) stimulation cycles with regard to maturity, fertilization and blastocyst rate, as well as clinical outcome (pregnancy and live-birth rate), in relation to follicular volume, measured by three-dimensional transvaginal sonography (3D-TVS), and follicular fluid composition.
Methods This was a prospective single-center study
con-ducted between June 2012 and June 2014, including 118 ovum pick-ups with subsequent embryo transfer. Ovarian stimulation was performed using the GnRHa long pro-tocol. Of 1493 follicles aspirated individually, follicular volume was evaluated successfully in 1236 using auto-mated 3D-TVS during oocyte retrieval. Oocyte maturity and blastocyst development were tracked according to follicular volume. Intrafollicular concentrations of estra-diol, testosterone, progesterone, luteinizing hormone, follicle-stimulating hormone and granulocyte–colony stimulating factor were quantified by immunoassay. Clin-ical outcome, in terms of implantation rate, (clinClin-ical) pregnancy rate, miscarriage and live-birth rate (LBR), was evaluated.
Results Follicles were categorized, according to their
volume, into three arbitrary groups, which included 196 small (8–12 mm/0.3–0.9 mL), 772 medium (13–23 mm/ 1–6 mL) and 268 large (≥ 24 mm/> 6 mL) follicles. Although oocyte recovery rate was significantly lower in small follicles compared with medium and large ones (63.8% vs 76.6% and 81.3%, respectively; P < 0.001),
Correspondence to: Dr B. Wirleitner, IVF Centers Prof. Zech – Bregenz, Roemerstrasse 2, 6900 Bregenz, Austria (email: [email protected]) Accepted: 9 November 2017
similar fertilization rates (85.1% vs 75.3% and 81.4%, respectively) and blastocyst rates (40.5% vs 40.6% and 37.2%, respectively) per mature metaphase II oocyte were observed. A trend towards higher LBR after transfer of blastocysts derived from small (< 1 mL) follicles compared with medium (1–6 mL) or large (> 6 mL) follicles (54.5% vs 42.0%, and 41.7%, respectively) was observed. No predictive value of follicular fluid biomarkers was identified.
Conclusions Our data indicate that the optimal
fol-licular volume for a high yield of good quality blas-tocysts with good potential to lead to a live birth is 13–23 mm/1–6 mL. However, oocytes derived from small follicles (8–12 mm/0.3–0.9 mL) still have the capac-ity for normal development and subsequent delivery of healthy children, suggesting that aspiration of these folli-cles should be encouraged as this would increase the total number of blastocysts retrieved per stimulation. Copy-right© 2017 ISUOG. Published by John Wiley & Sons Ltd.
INTRODUCTION
During controlled ovarian stimulation (OS), follicles of different size develop, which are monitored by transvagi-nal sonography (TVS). The decision of the follicle size at which final oocyte maturation should be triggered is a critical step in OS. It is well known that oocyte matu-rity is linked with follicle size1. One of the most widely
applied protocols is administering the trigger when sev-eral follicles have reached a diameter of ≥ 18 mm1–6.
However, this strategy was based on the previous finding that small follicles are associated with low oocyte recovery rates2,7,8. Furthermore, reduced maturity and fertilization
capacity for oocytes retrieved from small follicles were reported, followed by the recommendation not to aspi-rate this pool of follicles2,7–10. However, other studies did
not find differences in oocyte recovery rate11or
fertiliza-tion rate (FR), between small and large follicles5,12. Most importantly, some publications demonstrated decreased FR and developmental competence in oocytes derived from very large (> 23 mm) follicles, indicating adverse effects of prolonged stimulation9,13. Similarly, controver-sial results on the relationship between follicular size and embryo cleavage rates were reported5,6,10,11. These
dis-cordant findings might be attributed to differences in OS protocols, patient characteristics, workflows, techniques to measure follicular volume and size, methods of oocyte insemination (in-vitro fertilization (IVF) or intracytoplas-mic sperm injection (ICSI)) and analysis of endpoints (fertilization and cleavage rates, and embryo quality). To date, few studies have analyzed the relationship between blastocyst development or clinical outcome and follicular size following one-by-one follicle measurement10,11,14.
To shed more light on the controversial findings regard-ing the optimal follicular size for oocyte retrieval evalu-lated by conventional two-dimensional TVS, we aimed to perform a prospective study using three-dimensional (3D) TVS, which is considered a more accurate method for evaluation of spherical and non-spherical follicle vol-umes. We investigated the correlation between follicle size and oocyte competence as well as embryo development to blastocyst stage. In addition, clinical outcome was evaluated in terms of implantation, pregnancy, clinical pregnancy and live-birth (LBR) rates. In order to sub-stantiate our findings, follicular fluid (FF) samples from different follicle cohorts were collected to identify putative biomarkers for oocyte quality and competence in relation to follicle growth.
METHODS
Patients and study design
This cross-sectional, prospective, single-center study was conducted from June 2012 to June 2014 in our clinic in Pilsen, Czech Republic. The study was approved by the Ethics Committee of the University Hospital and Medical Faculty, Charles University, Pilsen. Patients were recruited during their first consultation at the clinic. Informed consent for evaluation of the anonymized outcome data was given by all patients. Inclusion criteria were≤ 43 years and undergoing OS performed using the gonadotropin-releasing hormone agonist (GnRHa) long protocol. Exclusion criteria were diagnosis of polycystic ovary syndrome, hormone-related female infertility, persistent inflammation of the reproductive tract including severe endometriosis, endometritis, structural uterine anomaly, history of recurrent (three or more) implantation failure in previous IVF cycles, or recurrent (three or
more) miscarriage. Only one cycle of each patient was included. Patient data, including maternal age, height, body mass index (BMI), weight, reasons for infertility, preconditions and previous IVF attempts and pregnancies, were collected routinely. Data from 118 IVF cycles and 1493 aspirated follicles with individual 3D ultrasound follicle measurements and single embryo cultures were included. Data on hormonal stimulation and medication of the patient as well as the embryo culture were recorded. Blastocyst transfer and the IVF outcome were documented and recorded using the in-house software DynaMed (IMA-Systems Information-Technology, Bregenz, Austria). Outcome parameters analyzed were the number of cumulus oocyte complexes (COCs) retrieved, number of metaphase-II (MII) oocytes, fertilization and blastocyst rates, as well as clinical parameters including (clinical) pregnancy, implantation and LBR. Additionally, the concentrations of hormones and cytokines in the follicular fluid were determined.
Controlled ovarian stimulation
OS was performed using the GnRHa long protocol, as previously described15. After confirmed downregulation
(using Decapeptyl; Ferring Arzneimittel, Vienna, Aus-tria), stimulation was performed with human menopausal gonadotropin (hMG) (Merional; IBSA, Lugano, Switzer-land). Transvaginal scans were performed every 2–3 days, starting on days 6–7 after start of stimulation. When the majority of recruited follicles reached a spherical diameter of 16–23 mm (volume 2–6 mL), final oocyte maturation was triggered by injection of 10 000 IU of human chori-onic gonadotropin (hCG) (Pregnyl; Organon, Vienna, Austria), 36 h before oocyte retrieval.
Oocyte retrieval and one-by-one follicle volume estimation
During aspiration, patients were under intravenous sedoanalgesia (1% Propofol MCT Fresenius (Fresenius Kabi, Germany) and fentanyl (Fentanyl; hameln phar-maceuticals ltd, Gloucester, UK)) performed by an anesthetist. All oocyte retrievals and scans were per-formed by two trained physicians using standardized protocols. No modifications were made with regard to the operative technique used during the study. A detailed schematic presentation of the workflow is shown in Figure S1. During ovum pick-up (OPU), an initial overview of the whole ovary was performed by 3D ultrasound with automated volume calculation using SonoAVC software (GE Medical Systems Kretztechnik GmbH & Co, Zipf, Austria), as described previously16.
All applications of SonoAVC were performed using a Voluson E8 according to the manufacturer (GE Medical Systems Kretztechnik GmbH & Co) and to the indications of Ata and Tulandi16and Murtinger et al.17. Hence, the
aspiration needle (G17 IVF; TIK, Kobarid, Slovenia) was rinsed and filled with flushing medium (Modified Ham’s
F-10; Irvine Scientific, Santa Ana, CA, USA) and follicles were aspirated one-by-one, with aspiration pressure set at 105 mmHg, under ultrasound guidance and automated single volume calculation to assure puncture of the spe-cific follicle, with confirmation by manual measurement of the volume of the native aspirated FF in scaled aspira-tion tubes. Follicles for which the volume calculated by SonoAVC differed by more than 20% from the volume measured manually were excluded from the study.
When the COC was found immediately in aspirated native FF, the needle was moved to the next follicle. If the COC was not retreived in native FF, follicles were flushed between one and five times until it was obtained. If the COC was still not retrieved in the flushing medium, the aspiration needle was removed from the ovary and rinsed with flushing medium to eventually rescue a COC stuck in the needle lumen.
We ensured that, for each patient, all follicles (and follicles of all size groups) were punctured. The aspiration of antral follicles, reflected by a follicular size of 2–6 mm18, was avoided because of the technical limit of the aspiration needles used. The total duration of the procedure for each patient was approximately 20–35 min. No complication occurred during OPU.
The oocyte recovery rate was determined by the number of COCs retrieved in relation to the number of follicles aspirated. Aspirated follicles were grouped, according to follicular volume, into the following arbitrary groups: small follicles with a volume of 0.3–0.9 mL, corresponding to a spherical diameter of 8–12 mm; medium size follicles with a volume of 1–6 mL, corresponding to a spherical diameter of 13–23 mm; and large follicles with a volume of > 6 mL, corresponding to a spherical diameter of≥ 24 mm. It was ensured that in each participating patient, follicles of all three groups were aspirated.
Embryo culture and blastocyst transfer
Three to four hours after oocyte retrieval, COCs were denuded and oocyte maturity was assessed19.
The number of MII oocytes was calculated per follicle aspirated or per COC obtained. Oocytes were fertilized using intracytoplasmic morphologically selected injection (IMSI) by default20. Embryo culture was performed in
single embryo culture (one embryo per culture well; Nunc A/S, Roskilde, Denmark). Fertilization was assessed 16–18 h after IMSI by observation of the presence of two pronuclei (2PN). FR was calculated per either aspirated follicle or COC retrieved, or MII oocyte obtained. Cleavage rate was evaluated on day 3. Blastocyst development was assessed on day 5, before the one or two blastocysts graded morphologically as best were selected for embryo transfer (ET). Blastocysts were graded according to the Gardner blastocyst grading scale21. Blastocysts with expansion 2–6 and Grade A for both inner cell mass and trophectoderm, or a combination of Grades A and B, were scored as top blastocysts. Blastocyst rate was determined per either follicle aspirated
or COCs retrieved, or MII oocyte obtained. Blastocyst transfer was performed, as previously described, using a Wallace embryo replacement catheter (Smiths Medical International, Kent, UK)22. Surplus blastocysts were vitrified aseptically (Vitrisafe®, IVF-Distribution, GmbH, Bregenz, Austria) according to Vanderzwalmen et al.23.
Clinical outcome
Only ETs with one or two blastocysts originating from the same follicle groups were evaluated for the clinical outcome. Fourteen days after ET, urinary β-hCG was tested and pregnancy rate was calculated as the number of patients with positive test in relation to the number of ETs performed. Clinical pregnancy was detected by fetal heart beat on ultrasound at 8–12 weeks post-ET. Clinical pregnancy rate was calculated as the number of patients with diagnosed clinical pregnancy in relation to the number of ETs performed24. Implantation rate
was calculated by number of fetal heart beats observed per number of blastocysts transferred. Miscarriage was defined as pregnancy loss after detection of fetal heart beat and before the 21st gestational week. LBR was defined
as a dichotomous variable: one (or more) child born was considered to be a positive result, and the ratios were calculated per ET24.
Quantification of intrafollicular biomarkers
Immediately after oocyte retrieval, follicular aspirate samples were centrifuged at 1500 g. Supernatants were harvested and stored at –20◦C until measurement. Therefore, only original follicular fluid was used before flushing to avoid dilution with flushing medium. Only clear fluids were assayed to avoid distortion by blood contamination; thus, cloudy and bloodstained samples were excluded from analysis. Measurements were per-formed in duplicate. Intrafollicular concentrations of estradiol (E2), testosterone (T), progesterone (P), luteiniz-ing hormone (LH), follicle-stimulatluteiniz-ing hormone (FSH) and granulocyte–colony stimulating factor (G–CSF) were quantified as potential biomarkers for oocyte quality and developmental competence25,26. E2 and P were
quan-tified by chemiluminescent microparticle immunoassays (CMIA) on the ARCHITECT i2000 system (Abbott, Dublin, Ireland) following the manufacturer’s protocol using a four-parameter calibration curve. T was quanti-fied by ELISA (Testosterone ELISA kit; Alpha Diagnostic International, San Antonio, TX, USA) on a Synergy HT (Biotek, Winooski, VT, USA) reader, according to the manufacturer’s protocol, using a five-parameter calibra-tion curve. FSH, LH and G–CSF were quantified by MAP (Milliplex MAP Kit; Millipore, Billerica, MA, USA) on a Luminex® 200™ (Luminex Corporation, Austin, TX, USA), according to the manufacturer’s protocol, using a five-parameter calibration curve.
Statistical analysis
Sample size was calculated based on both of the main outcome parameters, namely oocyte recovery rate and blastocyst rate, applying a 15% minimum clinically relevant difference, a Type-I error of α = 0.05 and 1–β = 0.8, resulting in a minimum of 169 cases per group. Statistical difference in oocyte retrieval, oocyte maturation, FR and blastocyst rate, as well as in the clinical parameters implantation rate, (clinical) pregnancy rate and LBR, were calculated using Pearson’s chi-square and Fisher’s exact tests. A 95% CI of the relative risk and risk difference was applied. An error of α < 0.05 was considered statistically significant. Furthermore, a
post-hoc power analysis on clinical outcome (birth rate)
was performed, resulting in a 9% power of the test and a minimum detectable difference for statistical significance of 29.3% for small vs medium follicles, of 28.0% for large vs medium follicles and of 40.6% for small vs large follicles. Differences in means of numerical data were tested by one-way ANOVA using the F distribution. Differences in hormone and cytokine concentrations were calculated using the Student’s t-test. Statistical analysis was performed using the Statistical Package for Social Sciences (SPSS) software version 22.0 for Windows (IBM SPSS Statistics, Armonk, NY, USA).
RESULTS
Follicular growth under the GnRHa long protocol
Automated 3D ultrasound investigation of follicular growth at the time of OPU showed that, out of all detected follicles, 16.3% had a volume of > 6 mL (≥ 24 mm spherical diameter), 60.6% had a volume of 1–6 mL (13–23 mm spherical diameter) and 23.1% had a volume of 0.3–0.9 mL (8–12 mm spherical diameter) (Figure S2).
Subjects
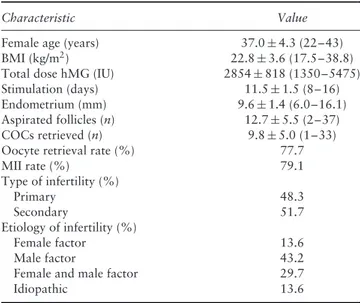
Follicles were individually aspirated in 118 patients. The demographic data of these patients are shown in Table 1. The mean dose of hMG applied was 2854 (range, 1350–5475) IU with mean duration of stimulation of 11.5 days. A mean of 14.7 follicles were aspirated per patient. The overall oocyte recovery rate was 75.6%. Of 1493 follicles aspirated, 1236 could be analyzed, whereas 257 were excluded because of a discrepancy between FF volume measured manually and volume estimated by SonoAVC (Figure 1). No loss to follow-up with regard to IVF outcome was reported after OPU.
Oocyte quality and blastocyst development
Follicles were grouped, according to their volume, into three arbitrary groups, which included 196 small (0.3–0.9 mL), 772 medium (1–6 mL) and 268 large
Table 1 Demographics of 118 patients undergoing ovarian
stimulation using gonadotropin-releasing hormone agonist long protocol
Characteristic Value
Female age (years) 37.0± 4.3 (22–43)
BMI (kg/m2) 22.8± 3.6 (17.5–38.8)
Total dose hMG (IU) 2854± 818 (1350–5475)
Stimulation (days) 11.5± 1.5 (8–16)
Endometrium (mm) 9.6± 1.4 (6.0–16.1)
Aspirated follicles (n) 12.7± 5.5 (2–37)
COCs retrieved (n) 9.8± 5.0 (1–33)
Oocyte retrieval rate (%) 77.7
MII rate (%) 79.1 Type of infertility (%) Primary 48.3 Secondary 51.7 Etiology of infertility (%) Female factor 13.6 Male factor 43.2
Female and male factor 29.7
Idiopathic 13.6
Values are given as mean± SD (range) or %. BMI, body mass index; COC, cumulus oocyte complex; hMG, human menopausal gonadotropin; MII, metaphase-II oocyte.
(> 6 mL) follicles, all of which were aspirated and evalu-ated. The COC recovery rate was statistically significantly lower (P < 0.001) in small follicles (63.8%) compared with medium (76.6%) and large (81.3%) follicles.
The proportion of MII oocytes per aspirated follicle was significantly reduced in small follicles, compared with medium and large follicles (37.8% vs 64.0% and 70.1%, respectively; P < 0.001; Table 2). The same trend was observed when the rate of MII oocytes was calculated per retrieved COC (MII/COC rate, 59.2% in small follicles vs 83.6% in medium follicles and 86.2% in large follicles; P < 0.001), showing that even when an oocyte is retrieved from small follicles, it has a lower capability of being mature.
The rate of 2PN was significantly lower in small folli-cles than in medium and large follifolli-cles, when calculated per number of aspirated follicles (32.1% vs 51.7% and 57.1%, respectively; P < 0.001) or per COC retrieved (50.4% vs 67.5% and 70.2%, respectively; P < 0.001) (Table 2). However, FR did not differ when calculating the rate of 2PN per MII between the three follicle groups (2PN/MII: 85.1% in small vs 75.3% in medium and 81.4% in large follicles). Similarly, a slight, but not statistically significant, difference was found between the groups in the rate of abnormal fertilization, as defined by the observation of either one or three or more pronuclei per MII oocyte. Specifically, abnormal fertilization was observed in 3.8% of small, 2.3% of medium and 2.1% of large follicles. Similarly, no statistically significant differ-ence was found in embryo cleavage rate per MII oocytes on day 3. Similar cleavage rates were observed in small (77.3%), medium (77.7%) and large (80.3%) follicles.
Finally, a lower blastocyst rate was observed in small compared with medium or large follicles per aspirated follicle (15.3% vs 27.9% and 26.1%, respectively) or
per COC (24.0% vs 36.4% and 32.1%, respectively), although the difference was statistically significant only between small and medium follicles (P < 0.05; Table 2). Additionally, similar blastocyst rates per retrieved MII
118 OPUs 1493 follicles analyzed 1236 follicles with valid evaluation Follicles > 6 mL (‘large’; 24–30 mm spherical diameter) Follicles 1–6 mL (‘medium’; 13–23 mm spherical diameter) Measurement of hormones and cytokines in follicular fluid (n = 76) Collection of follicular fluid 934 cumulus-oocyte complexes 792 MII oocytes 615 zygotes 315 blastocysts 73 blastocyst transfers from small, medium or large follicles only
Recovery rate Oocyte maturity Fertilization rate Blastocyst rate Pregnancy and birth rate Follicles 0.3–0.9 mL (‘small’; 8–12 mm spherical diameter)
Figure 1 Flowchart of follicle aspiration procedure and outcome
measures in 118 patients undergoing ovarian stimulation using gonadotropin-releasing hormone agonist long protocol. MII, metaphase II; OPU, ovum pick-up.
Table 2 Oocyte maturity and blastocyst development in 1236 follicles aspirated individually, grouped according to follicle size
Variable Small follicles (8–12 mm/0.3–0.9 mL) Medium follicles (13–23 mm/1–6 mL) Large follicles (≥ 24 mm/> 6 mL) P* Follicles analyzed (n) 196 772 268 COCs retrieved (n) 125 591 218 COCs/follicle (%) 63.8 76.6 81.3 <0.001†‡, NS§ MII (n) 74 530 188 MII/follicle (%) 37.8 64.0 70.1 <0.001†‡, NS§ MII/COC (%) 59.2 83.6 86.2 <0.001†‡, NS§ 2PN (n) 63 399 153 2PN/follicle (%) 32.1 51.7 57.1 <0.001†‡, NS§ 2PN/COC (%) 50.4 67.5 70.2 <0.001†‡, NS§ 2PN/MII (%) 85.1 75.3 81.4 NS†‡§ Blastocysts (n) 30 215 70 Blastocysts/follicle (%) 15.3 27.9 26.1 <0.001†, < 0.01‡, NS§ Blastocysts/COC (%) 24.0 36.4 32.1 <0.05†, NS‡§ Blastocysts/MII (%) 40.5 40.6 37.2 NS†‡§
*Statistical significance was evaluated using chi-square test, between: †small and medium follicles; ‡small and large follicles; §medium and large follicles. 2PN, two pronuclei; COC, cumulus oocyte complex; MII, metaphase II oocyte; NS, not statistically significant.
oocytes were observed in all three groups. This was also true for blastocyst quality. The rate of top-quality blastocysts was 12.1% in small, 19.4% in medium and 14.3% in large follicles.
Hormone and cytokine levels in FF
Hormone levels (E2, T, P, LH and FSH) as well as concentrations of G–CSF were measured in selected (n= 76) FF samples from the one-by-one 3D ultrasound volume analysis. We found that the concentration of E2 in FF increased significantly with follicular size, whereas that of T did not (Table 3). Compared with small follicles, the E2/T ratio was significantly higher in medium and large follicles (49.5 vs 85.5 and 138.3, respectively). A moderate increase in P concentration was observed in large follicles (P < 0.01) compared with small and medium ones. No difference in the mean concentrations of LH, FSH or G–CSF was detected between the different follicle groups. Interestingly, none of the measured parameters differed significantly when discriminating between mature MII oocytes and immature oocytes (Table S1), or between embryos that reached blastocyst stage and arrested embryos (Table S2).
Clinical outcome in relation to follicle volume
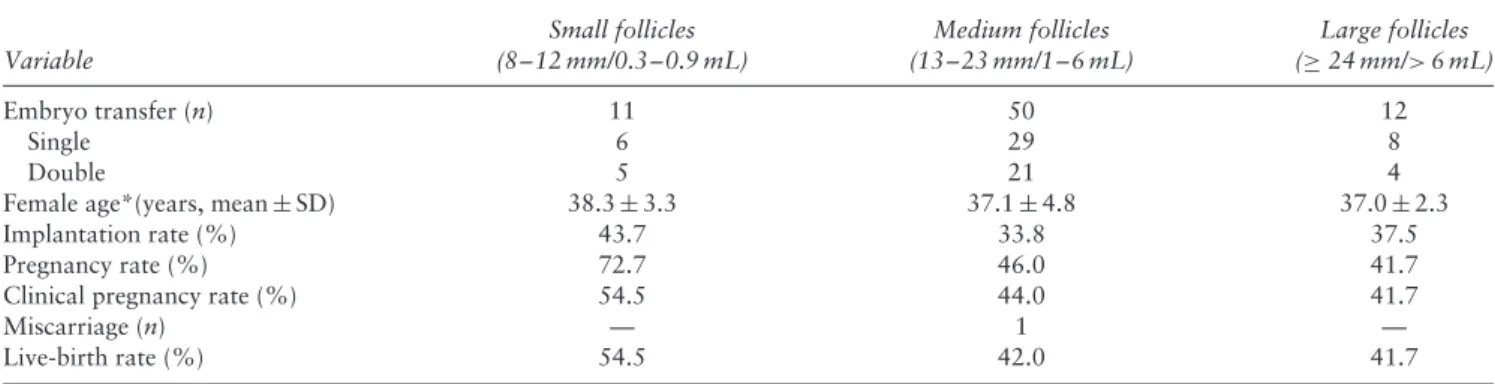
Only ETs for which an unambiguous allocation of the outcome to follicle groups was possible (either transfer of one blastocyst, transfer of two blastocysts derived from the same follicle group, or transfer of two blastocysts derived from the different follicle groups resulting in a dizygotic twin pregnancy) were analyzed for clinical outcome. The results are shown in Table 4. There was no statistically significant difference in female age or in number of transferred blastocysts (single or double ET) among the three groups. Similar implantation, pregnancy and clinical pregnancy rates and LBR were observed after transfer of blastocysts from all three groups of follicles.
Table 3 Concentration of hormones and cytokines measured in follicular fluid isolated from small, medium or large follicles Variable Small follicles (8–12 mm/0.3–0.9 mL) Medium follicles (13–23 mm/1–6 mL) Large follicles (≥ 24 mm/> 6 mL) P* Follicles (n) 5 39 32 Follicle volume (mL) 0.9± 0.1 4.0± 1.4 9.0± 2.2 <0.001†‡§ E2 (ng/mL) 264± 58 347± 157 530± 324 <0.01‡, < 0.001§ T (ng/mL) 4.1± 1.3 4.9± 3.5 3.7± 1.7 NS†‡§ E2/T ratio 49.5± 25.5 85.5± 49.8 138.3± 56.5 <0.001‡§ P (μg/mL) 9.2± 3.0 12.0± 4.9 15.4± 4.5 <0.05‡, < 0.01§ LH (mU/mL) 0.2± 0.1 0.2± 0.1 0.2± 0.1 NS†‡§ FSH (mU/mL) 3.2± 1.9 2.9± 1.6 3.4± 2.3 NS†‡§ G–CSF (pg/mL) 88.8± 77.0 52.8± 67.4 51.5± 23.0 NS†‡§
Values are given as n or mean± SD. *Statistical significance was evaluated using Student’s t-test, between: †small and medium follicles; ‡small and large follicles; §medium and large follicles. E2, estradiol; FSH, follicle-stimulating hormone; G–CSF, granulocyte–colony stimulating factor; LH, luteinizing hormone; NS, not significant; P, progesterone; T, testosterone.
Table 4 Clinical outcome after transfer of blastocysts derived solely from small, medium or large follicles
Variable Small follicles (8–12 mm/0.3–0.9 mL) Medium follicles (13–23 mm/1–6 mL) Large follicles (≥ 24 mm/> 6 mL) Embryo transfer (n) 11 50 12 Single 6 29 8 Double 5 21 4
Female age*(years, mean± SD) 38.3± 3.3 37.1± 4.8 37.0± 2.3
Implantation rate (%) 43.7 33.8 37.5
Pregnancy rate (%) 72.7 46.0 41.7
Clinical pregnancy rate (%) 54.5 44.0 41.7
Miscarriage (n) — 1 —
Live-birth rate (%) 54.5 42.0 41.7
*No statistically significant differences were observed among follicle groups for any parameter.
DISCUSSION
This study demonstrates that oocytes derived from small follicles have the capacity for normal development and subsequent delivery of healthy children, indicating the usefulness of puncturing this follicle cohort.
Previous studies have reported lower oocyte recov-ery and reduced MII oocyte rates in small follicles (< 2 mL)2,5,7,27,28. However, according to our data, MII oocytes from small follicles showed similar capacity in terms of FR compared with oocytes from follicles of ≥ 2 mL. This finding is in line with those of some previous publications5,7,9,10, although not others6,27.
Similarly, published data regarding embryo cleavage rates and embryo quality in relation to follicle size are inconsistent9–12.
We also report, for the first time, similar blastocyst rates in MII oocytes derived from small follicles (0.3–0.9 mL) compared with larger follicles (1–6 mL and > 6 mL). A recent study indicated that a larger number of transferable blastocysts are harvested from follicles of 2–3 mL14; however, this was not confirmed by our data.
According to our data, LBR after ET of small-follicle blastocysts was similar to that after ET of larger-follicle blastocysts, suggesting the full capacity of a healthy live birth in this cohort. Nevertheless, it is worth mentioning that a trend toward higher LBR after transfer of blastocysts derived from small and medium, compared with large, follicles was detected.
Seeing the slight decrease in blastocyst rate and LBR from follicles of > 6 mL, we assume that a delay in ovulation trigger might impair the chance of live birth. This is supported by previous publications; in consequence, a prolonged stimulation might impair the IVF outcome9,13,29. However, in our study, follicle size was not evaluated on the day of trigger-administration but on the day of pick-up.
In contrast to some previous reports, in our study no correlation was found between FSH or LH levels in FF and follicle size, oocyte maturity and embryo development25,30. A statistically significant difference was
detected in E2 levels and E2/T ratio in FF between small, medium and large follicles, but no relationship between E2 levels, E2/T ratio and oocyte maturity or competence was observed. E2 was reported to enhance oocyte cytoplasmic maturation, while T levels were associated with low-quality oocytes and impaired developmental capacity. A low E2/T ratio was reported to be associated with follicular atresia and reduced viability25,31. In
our study, P in FF was significantly elevated in large follicles, but no significant correlation between P and oocyte maturity and competence was detected. Previously, higher intrafollicular P concentrations were reported to be associated with higher implantation rate25,32, while
other studies could not confirm these results26,33,34. Furthermore, in our study, G–CSF, a cytokine postulated as a predictor of embryo quality and higher implantation
rate, was not correlated with follicle size or oocyte competence26,35,36. However, analysis of biological fluids
such as FF is rather complex as a result of the large dynamic range of concentrations, the limitations of technical analysis and possible intrinsic or extrinsic confounding factors, such as OS37,38. Controversial
findings might also result from the etiology of infertility. Thus, the robustness of using FF biomarkers for oocyte competence for clinical application remains to be proven. The main strength of this study is that it is the first to analyze oocyte competence, blastocyst development and clinical outcome in relation to individual 3D ultrasound follicular volume measurements and simultaneous analysis of intrafollicular hormone and cytokine concentrations. Limitations of our study include the small number of patients. Regarding the inevitable heterogeneity of IVF patients, and thus the confounding factors, our findings may not be fully representative of the general IVF population. In particular, but not exclusively, the heterogeneity with respect to female age might be a limitation of this work as female age is an important influencing factor39,40. Bias might also derive from the defined exclusion criteria that had to be set to provide valid data, such as exclusion of follicles with deviation in measured volumes, exclusion of mixed embryo transfers and inclusion of male factor infertility. Additionally, considering that only the GnRHa long protocol was used for OS in this study, the results presented here might not be applicable to other stimulation protocols. Another limitation with regard to the analysis of biomarkers might be the small number of follicles analyzed following exclusion of numerous samples.
In general, the premature administration of hCG can result in retention of the oocyte within the follicle or ovula-tion of oocytes with impaired developmental potential41. In 1973, Edwards showed a strong relationship between oocyte recovery and follicle size42. A large number of pub-lications have since investigated this issue (summarized in Table S3). In a natural menstrual cycle, pre-ovulatory fol-licles reach 17–25 mm in diameter43. Data indicate that in OS, the relationship between size and oocyte maturity might be different, although a relationship is undoubtedly present2,6,9.
The estimation of follicular volume in OS is a difficult task as the shape is often not spherical but rather ellipsoid or even complex. Calculation of the follicular volume (Vf= 4/3 × r3× π) with conventional
two-dimensional TVS bears the risk of false estimation, possibly contributing to the controversial publications on this topic in the past44. In contrast, the 3D ultrasound
technique, as applied in our study, allows a more accurate volume calculation45,46.
Current clinical practice recommends to schedule final oocyte maturation according to the size of the largest follicles and to aspirate only follicles of 1–6 mL (13–23 mm) in size. Based on the results of our study, we suggest that this policy should be revised and that aspiration of small follicles (8–12 mm/0.3–0.9 mL) should become a routine procedure, seeing that this would
increase the total number of blastocysts retrieved and therefore could result in higher (cumulative) pregnancy rate and LBR.
ACKNOWLEDGMENTS
This work was supported by Business voucher of Pilsen Region 2015, by National Sustainability Program I (NPU I) No. LO1503 provided by the Ministry of Education Youth and Sports of the Czech Republic and by project PRVOUK P36 of Faculty of Medicine in Pilsen, Charles University in Prague. We acknowledge BioMed Proofreading LLC for proofreading the document.
REFERENCES
1. Simonetti S, Veeck LL, Jones HW Jr. Correlation of follicular fluid volume with oocyte morphology from follicles stimulated by human menopausal gonadotropin.
Fertil Steril 1985; 44: 177–180.
2. Scott RT, Hofmann GE, Muasher SJ, Acosta AA, Kreiner DK, Rosenwaks Z. Correlation of follicular diameter with oocyte recovery and maturity at the time of transvaginal follicular aspiration. J In Vitro Fert Embryo Transf 1989; 6: 73–75. 3. Dubey AK, Wang HA, Duffy P, Penzias AS. The correlation between follicular
measurements, oocyte morphology, and fertilization rates in an in vitro fertilization program. Fertil Steril 1995; 64: 787–790.
4. Miller KF, Goldberg JM, Falcone T. Follicle size and implantation of embryos from in vitro fertilization. Obstet Gynecol 1996; 88: 583–586.
5. Nogueira D, Friedler S, Schachter M, Raziel A, Ron-El R, Smitz J. Oocyte maturity and preimplantation development in relation to follicle diameter in gonadotropin-releasing hormone agonist or antagonist treatments. Fertil Steril 2006; 85: 578–583.
6. Rosen MP, Shen S, Dobson AT, Rinaudo PF, McCulloch CE, Cedars MI. A quantitative assessment of follicle size on oocyte developmental competence. Fertil
Steril 2008; 90: 684–690.
7. Triwitayakorn A, Suwajanakorn S, Pruksananonda K, Sereepapong W, Ahnonkit-panit V. Correlation between human follicular diameter and oocyte outcomes in an ICSI program. J Assist Reprod Genet 2003; 20: 143–147.
8. Wittmaack FM, Kreger DO, Blasco L, Tureck RW, Mastroianni L Jr, Lessey BA. Effect of follicular size on oocyte retrieval, fertilization, cleavage, and embryo quality in in vitro fertilization cycle: a 6-year data collection. Fertil Steril 1994; 62: 1205–1210.
9. Ectors FJ, Vanderzwalmen P, Van Hoeck J, Nijs M, Verhaegen G, Delvigne A, Schoysman R, Leroy F. Relationship of human follicular diameter with oocyte fertilization and development after in-vitro fertilization or intracytoplasmic sperm injection. Hum Reprod 1997; 12: 2002–2005.
10. Bergh C, Broden H, Lundin K, Hamberger L. Comparison of fertilization, cleavage and pregnancy rates of oocytes from large and small follicles. Hum Reprod 1998; 13: 1912–1915.
11. Salha O, Nugent D, Dada T, Kaufmann S, Levett S, Jenner L, Lui S, Sharma V. The relationship between follicular fluid aspirate volume and oocyte maturity in in-vitro fertilization cycles. Hum Reprod 1998; 13: 1901–1916.
12. Haines CJ, Emes AL. The relationship between follicle diameter, fertilization rate, and microscopic embryo quality. Fertil Steril 1991; 55: 205–207.
13. Clark L, Stanger J, Brinsmead M. Prolonged follicle stimulation decreases pregnancy rates after in vitro fertilization. Fertil Steril 1991; 55: 1192–1194.
14. Nivet AL, L´eveill´e MC, Leader A, Sirard MA. Transcriptional characteristics of different sized follicles in relation to embryo transferability: potential role of hepatocyte growth factor signalling. Mol Hum Reprod 2016; 22: 475–484. 15. Zech NH, Lejeune B, Puissant F, Vanderzwalmen S, Zech H, Vanderzwalmen P.
Prospective evaluation of the optimal time for selecting a single embryo for transfer: day 3 versus day 5. Fertil Steril 2007; 88: 244–246.
16. Ata B, Tulandi T. Ultrasound automated volume calculation in reproduction and in pregnancy. Fertil Steril 2011; 95: 2163–2170.
17. Murtinger M, Aburumieh A, Rubner P, Eichel V, Zech MH, Zech NH. Improved monitoring of ovarian stimulation using 3D transvaginal ultrasound plus automated volume count. Reprod Biomed Online 2009; 19: 695–699.
18. Jayaprakasan K, Deb S, Batcha M, Hopkisson J, Johnson I, Campbell B, Raine-Fenning N. The cohort of antral follicles measuring 2-6 mm reflects the quantitative status of ovarian reserve as assessed by serum levels of anti-M ¨ullerian hormone and response to controlled ovarian stimulation. Fertil Steril 2010; 94: 1775–1781.
19. Veeck LL. Oocyte assessment and biological performance. Ann NY Acad Sci 1988; 541: 259–274.
20. Vanderzwalmen P, Hiemer A, Rubner P, Bach M, Neyer A, Stecher A, Uher P, Zintz M, Lejeune B, Vanderzwalmen S, Cassuto G, Zech NH. Blastocyst development after sperm selection at high magnification is associated with size and number of nuclear vacuoles. Reprod Biomed Online 2008; 17: 617–627.
21. Gardner DK, Lane M, Stevens J, Schlenker T, Schoolcraft WB. Blastocyst score affects implantation and pregnancy outcome: towards a single blastocyst transfer.
Fertil Steril 2000; 73: 1155–1158.
22. Spitzer D, Haidbauer R, Corn C, Stadler J, Wirleitner B, Zech NH. Effects of embryo transfer quality on pregnancy and live birth delivery rates. J Assist Reprod Genet 2012; 29: 131–1135.
23. Vanderzwalmen P, Ectors F, Grobet L, Prapas Y, Panagiotidis Y, Vanderzwalmen S, Stecher A, Frias P, Liebermann J, Zech NH. Aseptic vitrification of blastocysts from infertile patients, egg donors and after IVM. Reprod Biomed Online 2009; 19: 700–707.
24. Zegers-Hochschild F, Adamson GD, de Mouzon J, Ishihara O, Mansour R, Nygren K, Sullivan E, van der Poel S; International Committee for Monitoring Assisted Reproductive Technology; World Health Organization. The International Committee for Monitoring Assisted Reproductive Technology (ICMART) and the World Health Organization (WHO) Revised Glossary on ART Terminology, 2009. Hum Reprod 2009; 24: 2683–2687.
25. Revelli A, Delle Piane L, Casano S, Molinari E, Massobrio M, Rinaudo P. Follicular fluid content and oocyte quality: from single biochemical markers to metabolomics.
Reprod Biol Endocrinol 2009; 7: 40.
26. L´ed´ee N, Gridelet V, Ravet S, Jouan C, Gaspard O, Wenders F, Thonon F, Hincourt N, Dubois M, Foidart JM, Munaut C, Perrier d’Hauterive S. Impact of follicular G-CSF quantification on subsequent embryo transfer decisions: a proof of concept study. Hum Reprod 2013; 28: 406–413.
27. Mehri S, Levi Setti PE, Greco K, Sakkas D, Martinez G, Patrizio P. Correlation between follicular diameters and flushing versus no flushing on oocyte maturity, fertilization rate and embryo quality. J Assist Reprod Genet 2014; 31: 73–77. 28. Akbariasbagh F, Lorzadeh N, Azmoodeh A, Ghaseminejad A, Mohamadpoor J,
Kazemirad S. Association among diameter and volume of follicles, oocyte maturity, and competence in intracytoplamic sperm injection cycles. Minerva Ginecol 2015; 67: 397–403.
29. Laufer N, DeCherney AH, Tarlatzis BC, Zuckerman AL, Polan ML, Dlugi AM, Graebe R, Barnea ER, Naftolin F. Delaying human chorionic gonadotropin administration in human menopausal gonadotropin-induced cycles decreases successful in vitro fertilization of human oocytes. Fertil Steril 1984; 42: 198–203. 30. Mendoza C, Ruiz-Requena E, Ortega E, Cremades N, Martinez F, Bernabeu R,
Greco E, Tesarik J. Follicular fluid markers of oocyte developmental potential. Hum
Reprod 2002; 17: 1017–1022.
31. Andersen CY. Characteristics of human follicular fluid associated with successful conception after in vitro fertilization. J Clin Endocrinol Metab 1993; 77: 1227–1234. 32. Carpintero NL, Su ´arez OA, Mangas CC, Varea CG, Rioja RG. Follicular steroid hormones as markers of oocyte quality and oocyte development potential. J Hum
Reprod Sci 2014; 7: 187–193.
33. Costa LO, Mendes MC, Ferriani RA, Moura MD, Reis RM, Silva de S ´a MF. Estradiol and testosterone concentrations in follicular fluid as criteria to discriminate between mature and immature oocytes. Braz J Med Biol Res 2004; 37: 1747–1755. 34. Hammoud I, Vialard F, Bergere M, Albert M, Gomes DM, Adler M, Malagrida
L, Bailly M, Wainer R, Selva J. Follicular fluid protein content (FSH, LH, PG4, E2 and AMH) and polar body aneuploidy. J Assist Reprod Genet 2012; 29: 1123–1134.
35. L´ed´ee N, Lombroso R, Lombardelli L, Selva J, Dubanchet S, Chaouat G, Frankenne F, Foidart JM, Maggi E, Romagnani S, Ville Y, Piccinni MP. Cytokines and chemokines in follicular fluids and potential of the corresponding embryo: the role of granulocyte colony-stimulating factor. Hum Reprod 2008; 23: 2001–2009.
36. Gaafar TM, Hanna MO, Hammady MR, Amr HM, Osman OM, Nasef A, Osman AM. Evaluation of cytokines in follicular fluid and their effect on fertilization and pregnancy outcome. Immunol Invest 2014; 43: 572–584.
37. Zamah AM, Hassis ME, Albertolle ME, Williams KE Proteomic analysis of human follicular fluid from fertile women. Clin Proteomics 2015; 12: 5.
38. Requena A, Cruz M, Agudo D, Pacheco A, Garc´ıa-Velasco JA. Type of gonadotropin during controlled ovarian stimulation affects the endocrine profile in follicular fluid and apoptosis rate in cumulus cells. Eur J Obstet Gynecol Reprod Biol 2016; 197: 142–146.
39. Meldrum DR, Casper RF, Diez-Juan A, Simon C, Domar AD, Frydman R. Aging and the environment affect gamete and embryo potential: can we intervene? Fertil
Steril 2016; 105: 548–559.
40. Shapiro BS, Richter KS, Harris DC, Daneshmand ST. Influence of patient age on the growth and transfer of blastocyst-stage embryos. Fertil Steril 2002; 77: 700–705. 41. Stanger JD, and Yovich JL. Failure of human oocyte release at ovulation. Fertil Steril
1994; 41: 827–832.
42. Edwards RG. Studies on human conception. Am J Obstet Gynecol 1973; 117: 587–601.
43. Hackeloer BJ, Fleming R, Robinson HP, Adam AH, Coutts JRT. Correlation of ultrasonic and endocrinological assessment of follicular development. Am J Obstet
Gynecol 1979; 135: 122–128.
44. Penzias AS, Emmi AM, Dubey AK, Layman LC, DeCherney AH, Reindollar RH. Ultrasound prediction of follicle volume: is the mean diameter reflective? Fertil Steril 1994; 62: 1274–1276.
45. Amer A, Hammadeh ME, Kolkailah M, Ghandour AA. Three-dimensional versus two-dimensional ultrasound measurement of follicular volume: are they comparable?
Arch Gynecol Obstet 2003; 268: 155–157.
46. Revelli A, Martiny G, Delle Piane L, Benedetto C, Rinaudo P, Tur-Kaspa I. A critical review of bi-dimensional and three-dimensional ultrasound techniques to monitor follicle growth: do they help improving IVF outcome? Reprod Biol Endocrinol 2014; 12: 107.
SUPPORTING INFORMATION ON THE INTERNET
The following supporting information may be found in the online version of this article:
Figure S1 Oocyte retrieval and follicular volume estimation using three-dimensional transvaginal sonography
(3D-TVS) during ovum pick-up (OPU).
Figure S2 Distribution of follicle volumes under gonadotropin releasing hormone agonist long protocol in
1791 stimulation cycles analyzed by automatic three-dimensional ultrasound.
Table S1 Concentration of hormones and cytokines in follicles with mature (metaphase II (MII)) and
immature oocytes
Table S2 Concentration of hormones and cytokines in follicles containing mature oocytes with or without
blastocyst formation on day 5