Anatomical
correlates of early
mutism in
progressive
nonfluent aphasia
Abstract—Patients with progressive nonfluent aphasia (PNFA) can become mute early in the course of the disease. Voxel-based morphometry showed that PNFA is associated with left anterior insula and inferior frontal atrophy. In PNFA with early mutism, volume loss was more prominent in the pars opercu-laris and extended into the left basal ganglia. Damage to the network of brain regions involved in both coordination and execution of speech causes mutism in PNFA.
NEUROLOGY 2006;67:1849–1851
M.L. Gorno-Tempini, MD, PhD; J.M. Ogar, MS; S.M. Brambati, PhD; P. Wang, MD; J.H. Jeong, MD; K.P. Rankin, PhD; N.F. Dronkers, PhD; and B.L. Miller, MD
Primary progressive aphasia (PPA) is characterized by speech and language deficits that remain isolated for at least 2 years.1 Once thought a unitary syn-drome, PPA is now typically divided into variants.2,3. Progressive nonfluent aphasia (PNFA) is character-ized by effortful speech, agrammatism in production and comprehension, with preserved single word com-prehension. It has been shown that apraxia of speech (AOS) is the most common motor speech deficit in PNFA.2
“Mutism,” resulting from AOS or dysarthria, is the absence of speech or articulatory movement and can occur with neurologic disturbances, including Parkinson disease, ALS, progressive supranuclear palsy (PSP), and frontotemporal dementia.4Whereas mutism typically occurs at the end stage of dementia of any cause, in PNFA, patients can become function-ally mute early in the disease course, while other cognitive functions are spared.
Previous studies consistently indicate the left pos-terior inferior frontal (operculum) and anpos-terior insu-lar regions as the crucial sites of anatomic damage in PNFA.2,5 However, the anatomic basis of early mut-ism in these disorders is not known.
We used voxel-based morphometry (VBM) to com-pare patterns of gray matter atrophy between pa-tients with PNFA who developed mutism early in the disease, non-mute patients with PNFA, and nor-mal control subjects. We sought to identify which brain regions are associated with early complete loss of speech in PNFA.
Methods. Subjects and cognitive data. Six mute patients (five women, one man) were selected from a pool of patients with PNFA at the University of California (UCSF) Memory and Aging Center, along with five other non-mute patients with PNFA (all women), who presented with speech deficits of varying severity. The two groups were matched for disease duration. PNFA was diagnosed based on clinical history, neurologic examination, neuropsycholog-ical screening, neuroimaging findings, and speech and language evaluation (table). Specifically, patients presented with a motor speech impairment and at least one of the following: agramma-tism in language production; spared single-word comprehension and impaired comprehension of complex syntactic structures (table). A diagnosis of “functional mutism” was made if the patient was unable to speak a single intelligible word owing to motor speech impairment. All mute patients also demonstrated severe buccofacial apraxia, and one had mild swallowing troubles. Three of the five non-mute patients also showed buccofacial apraxia.
Forty age- and sex-matched healthy subjects, with no history of neurologic or psychiatric disease, were used as controls for the VBM analysis (mean age: 65.1; 6 men, 34 women). Ten age- and sex-matched healthy subjects were used as a control group for the cognitive data when normative data were not available (table). Group differences were determined using the Mann–Whitney U test. PNFA-mute patients were older than the PNFA non-mute group (p⬍ 0.02); however, disease duration did not significantly differ, nor did education or female-to-male ratio.
MRI scanning and VBM. MRI scans were obtained on a 1.5-T Magnetom VISION system (Siemens Inc., Iselin, N.J.). A volumet-ric magnetization prepared rapid gradient echo MRI (MPRAGE) sequence was used to obtain T1-weighted images of the entire brain, with 1.0 ⫻ 1.0 mm2in-plane resolution and 1.5 mm slab
thickness. All scans were acquired within a 6-month period from the time of clinical evaluation.
We compared gray matter regional volumes in the two groups of patients with PNFA (mute and non-mute) using VBM standard technique implemented in the SPM2 software package.6 Ad-hoc
age-matched a priori and template images were created. Age, gen-der, and total intracranial volume were entered into the design matrix as nuisance variables.
We performed specific statistical analyses to investigate the regions of common atrophy in PNFA-mute and PNFA-non-mute vs controls and the group differences between the two patient
popu-Additional material related to this article can be found on the Neurology Web site. Go to www.neurology.org and scroll down the Table of Con-tents for the November 28 issue to find the title link for this article.
Editorial, see page 1738 See also page 1752
This article was previously published in electronic format as an Expedited E-Pub on August 23, 2006, at www.neurology.com.
From the Department of Neurology, University of California at San Francisco.
Supported by the National Institute of Neurological Disorders and Stroke (R01 NS050915), the State of California (DHS 04-35516), the National Institute on Aging (P50 AG03006, P01 AG019724), the John Douglas French Alzheimer’s Foundation, the McBean Foundation, the Sandler Foundation, the AD Research Center of California (03-75271 DHS/ADP/ ARCC), the Larry Hillblom Foundation (grant 2002/2F), and the Koret Foundation (grant 99-0102).
Disclosure: The authors report no conflicts of interest.
Received January 17, 2006. Accepted in final form June 19, 2006. Address correspondence and reprint requests to Dr. M.L. Gorno-Tempini, UCSF Department of Neurology, Memory and Aging Center, 350 Parnassus Ave., Suite 800, Box 1207, San Francisco, CA 94143-1207; e-mail: marilu@ memory.ucsf.edu
lations using the inclusive masking procedure. We accepted a statistical threshold of p ⬍ 0.05 corrected for multiple compari-sons for the main contrasts and of p⬍ 0.001 uncorrected for the contrasts used as masks. Based on previous work, the left inferior frontal gyrus, anterior insula, and basal ganglia were considered a priori regions of interest.
Results. Common atrophy in non-mute and mute. The left inferior frontal gyrus pars opercularis, insula, supe-rior temporal gyrus, and precentral regions were atro-phied in mute and non-mute patients. As shown in the figure (A through C) and table E-1 on the Neurology Web site (www.neurology.org), the medial portion of the oper-culum and the anterior insula regions were included in the same cluster and, with a 12-mm smoothing kernel, it was difficult to establish which of the two regions was more involved. The peak coordinate (⫺46, 13, 4) is cen-tered in the medial portion of the frontal operculum; at a lower threshold, the cluster extends medially and as-sumes the shape of the insula. This region was signifi-cantly atrophied in both groups but showed greater volume loss in the mute group.
Greater atrophy in mute vs non-mute and control subjects.
In the mute group, atrophy was more significant and encompassed a larger and more lateral portion of the left inferior frontal gyrus, extending further laterally in the pars opercularis (p⬍ 0.05 corrected for multiple compari-son) (figure; table E-2). At a lower threshold of p⬍ 0.001 uncorrected, atrophy also extended to the left basal gan-glia and to the pars orbitalis.
Discussion. We sought to delineate which brain regions show greater atrophy in mute patients with PNFA compared to patients with PNFA and milder articulation deficits. In all patients with PNFA, sig-nificant atrophy was found in brain regions support-ing speech production, specifically the left inferior frontal gyrus, insula, and superior temporal gyrus. In the six mute patients with PNFA, however, dam-age to this network was more extensive, with greater atrophy noted in the left pars opercularis of the
infe-rior frontal gyrus (posteinfe-rior portion of Broca area). Atrophy in the mute cohort also extended subcorti-cally into the left basal ganglia and thalamus and anteriorly and ventrally to the orbitofrontal region.
The inferior frontal and insular regions areas at-rophied in all patients with PNFA are recognized as important for generating speech.7,8 In the mute pa-tients, atrophy was more significant and more exten-sive in the lateral portion of the pars opercularis of Broca area and extended medially to encompass the basal ganglia. Our results support roles for the ante-rior insula and infeante-rior frontal gyrus in speech pro-duction, most probably in coordinating and planning movements for speech articulation. However, signifi-cant damage to the lateral portion of the frontal operculum appears to be critical for causing complete loss of speech in PNFA, most likely by supporting the final execution stages of speech production. Fur-thermore, in the mute group, atrophy also encom-passed the basal ganglia, although at a lower level of significance. The basal ganglia are thought to play a critical role in generating motor programs for speech.9 Therefore, in PNFA, mutism occurs when damage to the speech production network reaches a critical point, involving both cortical and subcortical motor speech mechanisms.
The pattern of anatomic damage suggests that the PFA non-mute and mute groups represent two stages or two presentations of the same disease. Clinical and neuropathologic data imply that cortico-basal degeneration (CBD) and PSP are the most common clinical evolution and pathologic diagnosis in PNFA.5,10This is especially true for cases in which progressive speech disorder is the most salient symptom.
Acknowledgment
The authors thank patients and their families for their participa-tion and Serena Amici for helpful comments.
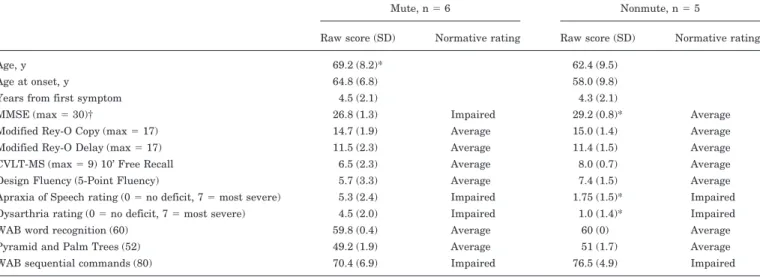
Table Demographic and cognitive data for mute and non-mute patients
Mute, n⫽ 6 Nonmute, n⫽ 5
Raw score (SD) Normative rating Raw score (SD) Normative rating
Age, y 69.2 (8.2)* 62.4 (9.5)
Age at onset, y 64.8 (6.8) 58.0 (9.8)
Years from first symptom 4.5 (2.1) 4.3 (2.1)
MMSE (max⫽ 30)† 26.8 (1.3) Impaired 29.2 (0.8)* Average
Modified Rey-O Copy (max⫽ 17) 14.7 (1.9) Average 15.0 (1.4) Average Modified Rey-O Delay (max⫽ 17) 11.5 (2.3) Average 11.4 (1.5) Average CVLT-MS (max⫽ 9) 10’ Free Recall 6.5 (2.3) Average 8.0 (0.7) Average Design Fluency (5-Point Fluency) 5.7 (3.3) Average 7.4 (1.5) Average Apraxia of Speech rating (0⫽ no deficit, 7 ⫽ most severe) 5.3 (2.4) Impaired 1.75 (1.5)* Impaired Dysarthria rating (0⫽ no deficit, 7 ⫽ most severe) 4.5 (2.0) Impaired 1.0 (1.4)* Impaired
WAB word recognition (60) 59.8 (0.4) Average 60 (0) Average
Pyramid and Palm Trees (52) 49.2 (1.9) Average 51 (1.7) Average WAB sequential commands (80) 70.4 (6.9) Impaired 76.5 (4.9) Impaired
* Groups differ at p⬍ 0.05. † Written responses.
MMSE⫽ Mini-Mental State Examination; CVLT-MS ⫽ The California Verbal Learning Test-Mental Status Version; WAB ⫽ Western aphasia battery.
References
1. Mesulam MM. Slowly progressive aphasia without generalized demen-tia. Ann Neurol 1982;11:592–598.
2. Gorno-Tempini ML, Dronkers NF, Rankin KP, et al. Cognition and anatomy in three variants of primary progressive aphasia. Ann Neurol 2004;55:335–346.
3. Kertesz A, Davidson W, McCabe P, et al. Primary progressive aphasia: diagnosis, varieties, evolution. J Int Neuropsychol Soc 2003;9:710–719. 4. Duffy J. Motor speech disorders. St. Louis: Mosby, 1995.
5. Josephs K, Duffy J, Strand E, et al. Clinicopathological and imaging correlates of progressive aphasia and apraxia of speech. Brain 2006; 129:1385–1398.
6. Good CD, Scahill RI, Fox NC, et al. Automatic differentiation of ana-tomical patterns in the human brain: validation with studies of degen-erative dementias. Neuroimage 2002;17:29–46.
7. Dronkers NF. A new brain region for coordinating speech articulation. Nature 1996;384:159–161.
8. Hillis AE, Work M, Barker PB, et al. Re-examining the brain regions crucial for orchestrating speech articulation. Brain 2004;127(pt 7): 1479–1487.
9. Radanovic M, Scaff M. Speech and language disturbances due to sub-cortical lesions. Brain Lang 2003;84:337–352.
10. Kertesz A. Frontotemporal dementia: one disease, or many? Probably one, possibly two. Alzheimer Dis. 2005;19(suppl 1):S19–S24.
Figure. Areas of atrophy in mute patients vs control subjects (A) and non-mute patients vs control subjects (B) (simple main effects). Area of common atrophy in mute and non-mute patients vs control subjects (C) and areas of greater atrophy in mute vs non-mute patients and control subjects (D). Atrophy maps are displayed on the three-dimensional rendering of the Montreal Neurologic Institute standard brain and on sections of the customized template image used for normaliza-tion. Results are displayed at p⬍ 0.001 uncorrected for multiple comparisons.
DOI 10.1212/01.wnl.0000237038.55627.5b
2006;67;1849-1851 Published Online before print August 23, 2006
Neurology
M. L. Gorno-Tempini, J. M. Ogar, S. M. Brambati, et al.
Anatomical correlates of early mutism in progressive nonfluent aphasia
This information is current as of August 23, 2006
Services
Updated Information &
http://www.neurology.org/content/67/10/1849.full.html
including high resolution figures, can be found at:
Supplementary Material
8.55627.5b.DC1.html
http://www.neurology.org/content/suppl/2006/11/26/01.wnl.000023703
Supplementary material can be found at:
References
http://www.neurology.org/content/67/10/1849.full.html##ref-list-1
This article cites 9 articles, 2 of which you can access for free at:
Citations
http://www.neurology.org/content/67/10/1849.full.html##otherarticles
This article has been cited by 7 HighWire-hosted articles:
Subspecialty Collections http://www.neurology.org//cgi/collection/frontotemporal_dementia Frontotemporal dementia http://www.neurology.org//cgi/collection/dementia_aphasia Dementia aphasia http://www.neurology.org//cgi/collection/aphasia Aphasia ntia http://www.neurology.org//cgi/collection/all_cognitive_disorders_deme
All Cognitive Disorders/Dementia
following collection(s):
This article, along with others on similar topics, appears in the
Permissions & Licensing
http://www.neurology.org/misc/about.xhtml#permissions
its entirety can be found online at:
Information about reproducing this article in parts (figures,tables) or in
Reprints
http://www.neurology.org/misc/addir.xhtml#reprintsus
Information about ordering reprints can be found online:
Online ISSN: 1526-632X.
1951, it is now a weekly with 48 issues per year. Copyright . All rights reserved. Print ISSN: 0028-3878. ® is the official journal of the American Academy of Neurology. Published continuously since