INDOOR CLIMATE QUALITY ASSESSMENT IN HIGH SCHOOL
CLASSROOM: VENTILATION STRATEGIES AND OCCUPANCY
MANAGEMENT
Yacine ALLAB1, 2, Andrea KINDINIS1, Annie-Claude BAYEUL-LAINÉ2, Sophie
SIMONET2, Olivier COUTIER DELGOSHA2
1 Université Paris-Est, Institut de Recherche en Constructibilité, ESTP, F-94230, Cachan, France. 2 Ecole Nationale Supérieure d’Arts et Métiers, Laboratoire de Mécanique de Lille UMR 8107,
France
Abstract
More than a well-being, providing a good Indoor Climate Quality (ICQ) in education buildings is necessary for students’ health and in order to maximize academic results.
In the context of a research focusing on hybrid ventilation strategies, this paper presents the results of a first survey on thermal comfort and indoor air quality in high school classrooms; the results will be subsequently used to develop strategies on mixed mode ventilated classrooms.
The objects of the study are the classrooms of ESTP, a civil engineering school located in Cachan, a suburban city in southern of Paris, France. The survey lasted one month during the mid-season.
The classrooms are equipped with a mechanical ventilation system and with windows, so that various solutions can be tested based on natural, mechanical and hybrid ventilation.
After a first period of monitoring and an analysis of initial conditions, ICQ was analyzed in different conditions according to the schedule and the occupancy of the investigated classrooms.
Indoor climate quality is assessed using objective (measurement campaign) and subjective survey (questionnaire). The measuring campaign includes measurement of thermal comfort parameters (temperature, mean radiant temperature, air flow velocity, and humidity) and indoor air quality parameters (CO2 concentration, CO concentration and humidity). Thermal comfort is assessed using respectively analytic theory (ISO 7730) and extended PMV for non-air conditioned buildings (adaptive PMV). IAQ (indoor air quality) is evaluated according to the level of CO2 concentration.
The questionnaire submitted to the students included 9 indexes for subjective assessment of thermal comfort and indoor air quality perception. It includes questions about sensation/preference of indoor climate quality and the satisfaction about the control of indoor climate. Additional issues are requested for PMV (Predicted Mean Vote) calculation (metabolism, clothing).
According to the level of occupancy which characterizes various periods, it is found that the ICQ evolves during a school day. Moreover, the influence of the occupancy level was more significant on thermal comfort, especially in warm conditions.
Keywords
1. Introduction
Indoor climate quality (ICQ) is essential in school environments (classrooms). It concerns users comfort relating to thermal environment (Thermal Comfort) and indoor air quality. Indeed, besides providing a good environment to avoid health problems and diseases contamination (Turunena et al., 2014), ICQ affects student’s and teacher’s performance (Lee et al., 2012). Even so, last years, several studies have shown that ICQ was unsuitable in many schools worldwide (Telli et al., 2012; Mumuvic et al., 2008; REHVA 2011).
Compared to other indoor environments, classrooms are characterized by their high level of occupancy. This factor affects the level of ICQ. In fact, a high occupancy increases the internal thermal gains (approximately 5 kW) which induce a local thermal discomfort (Becker et al., 2006; Besler et al., 2000) and, consequently, a decrease in occupant’s performance. The influence of temperature on productivity was investigated by Seppanen et al. (2005) by means of a meta-analysis on 24 cases of study. The results showed that the average productivity reduces by 2% per °C once the temperature rises above 25°C. On the other hand, some studies have shown that the level of occupancy can affect strongly the indoor air quality. A recent experimental study performed in a test cell (El Mankibi, 2009) revealed that the level of occupancy affects (negatively) on the indoor air quality using the concentration of carbon dioxide as an assessment index. In fact, Olesen and al. (2007) found that on average, sedentary person emits 19 l/h CO2. The carbon dioxide concentration is considered as a relevant index according to users’ perception of indoor air quality. Indeed, Fanger and Berg- Munch researches (1983) led to a correlation between the percentage of people dissatisfied with indoor air quality and measured levels of CO2. Later, Clausen (2000) have shown that the indoor air quality perception is related to the time exposure.
The present study falls within the framework of a thesis in progress on hybrid ventilation as regards indoor climate quality and energy efficiency issues in buildings. In this context, the main issue is to investigate on thermal comfort assessment in mix mode ventilated buildings. Indeed, two main approaches are used to assess thermal comfort: the static thermal approach set up by Fanger (Fanger, 1970) which is more appropriate to air conditioned buildings (stationary conditions); the adaptive thermal approach (ASHRAE Standard 55) developed by Brager and de Dear for naturally ventilated buildings. However, there is no specific method for hybrid ventilation. In fact, a previous study (R. F. Rupp and E. Ghisi, 2014) showed that the adaptive thermal approach was not suitable for hybrid ventilated buildings in hot climates. It was concluded that Givoni’s method is the most appropriate method for these kinds of buildings. In addition to thermal comfort issues, the thesis aims to investigate on indoor air quality and ventilation effectiveness relevant to hybrid ventilation systems. Thus, the study will be performed on an experimental setup including a hybrid ventilation system and metrological setup for objective assessment.
However, in order to investigate users’ ICQ perception, field investigations are performed on classrooms, as a preliminary study. This work will allow us to analyse ICQ according to the user’s behaviour and level of occupancy; to develop a methodology to assess ICQ and finally to anticipate for subsequent comparative analysis between field and laboratory results.
This paper presents the field study conducted on ESTP classrooms. In fact, according to the level of occupancy and the schedule of the investigated classrooms, various assessment methodologies were tested including: physical measurements for objective assessment and questionnaire survey for as subjective assessment.
2. Methodology
2.1. The school and the classroom
The study was performed in ESTP, a civil engineering school located in Cachan (a suburban city in 5 km in the south of Paris). Inaugurated in 1905, the campus includes old and recent buildings for laboratory research, education and administration for a total of 20 buildings.
The two investigated classrooms (V23 and L21) are respectively inside Vauban and Laplace, two newly constructed buildings (2008) devoted to teaching (Fig.1, a). Both Vauban and Laplace are made of brick and concrete with a fully glazed main façade (Fig.1, b).
These classrooms are both equipped with water-filled radiators which operate only during heating season (beginning of November-end of March). Neither V23 nor L21 are equipped with a cooling device. To fulfill thermal comfort in summer and indoor air quality throughout the year, these classrooms are equipped with mechanical ventilation (supply and exhaust) and natural ventilation (manually operable windows). Table 1 shows the typology of the two classrooms.
Table 1. Classroom’s topology
Classroo m
V[m3] A[m2] WFR WO NS HCD VS
V23 254.5 94 0.22 S-E 60 R MM
L21 216.4 81.3 0.26 N-W 40 R MM
Note: V=volume [m3]; A= area [m2]; WFR=window to floor ratio; WO= windows orientation; NS=
number of seats; HCD=Heating and cooling device; R= radiators; VS= ventilation system; MM= mixed mode
Figure 1. (a) Cachan’s campus plan; (b) The main façade of Vauban building 2.2. The weather of Cachan
The city of Cachan is located in Ile de France region. Its climate is qualified for large altered oceanic annual temperature (6-15°C) and the lower rainfall compared to the ocean edge. This climate is fairly homogeneous on the region but affected by the presence of an urban heat island in Paris for the minimum temperatures which are softened (+2°C annual average compared to forest areas). In winter average mean temperatures are quite low (below 7°C), and in summer, average mean temperature don’t go over 25°C (Fig.2). The field investigation was performed between the end of the heating period and the mid-season (March and April 2014). The outdoor climate data and analysis used in this study were based on the reference test data (US Department of energy). In addition, discrete outdoor temperature measurements were carried out twice a day using dry bulb thermometer.
Figure 2. Average night and day Statistics for Dry Bulb temperatures 2.3. ICQ monitoring protocol
The field study was performed from Monday March 24th to Saturday April 19th during school days for a total of 24 days. In this period, ESTP classes are generally from 8:00 to 18:00. According to the schedule, the school day was divided into seven monitoring periods. The first (P0) and the last (P6) periods were set up out of the school day respectively before and after the occupation period.
The rest (P1-P5) were divided into periods of two hours (Table. 2). Thereby, this monitoring planning allowed us to analyze how occupancy affects ICQ and study students’ behavior according to the ICQ.
Table 2. Monitoring periods during the day
Period P0 P1 P2 P3 P4 P5 P6
Hour 07:00-08:00 08:00-10:00 10:00-12:00 12:00-14:00 14:00-16:00 16:00-18:00 18:00-19:00 The assessment protocol of ICQ is based on a comparative study between two approaches: an objective approach which consists of physical parameters measurements and a subjective approach which involves occupant’s perceptions analysis (Corgnati et al., 2004; Pereira et al., 2014; d’Ambrosio et al., 2013). This methodology is used both for thermal comfort and indoor air assessment.
2.3.1. Objective investigation
Thermal comfort assessment methodology was based on the calculation of three different indexes: The standard Predicted Mean Value (PMV) set up by Fanger (1970) and presented later by the ISO 7730 (2006) ; the extension of the PMV model to non-air conditioned buildings proposed by Fanger and Toftum (2002) (PMVe); the adaptive PMV (aPMV) proposed by Yao et al. (2009). The PMV was used during the mechanical ventilation scenarios while the PMVe and aPMV were used for the natural ventilation and mixed mode ventilation. As the performed study was carried out during mid-season, the PMVe set for warm conditions was used only for warm days (according to the weather conditions).
As presented by the ISO 7730 (2006), the PMV has been calculated using physical measurements (air temperature, mean radiant temperature, air velocity, and relative humidity) and using the subjective assessment to collect the data on the clothing insulation and the metabolic rates. The Table 3 shows the specifications of the measured parameters in accord with the standard ISO 7726 (2002).
Table 3. Specifications of the measuring equipment
Parameter symbol range accuracy
Air temperature Ta [-20 ; +80] °C +/- 0.4% Ta +/- 0.3
Mean Radiant Temperature Tmr [-50 ; +200] °C +/- 0.4% Ta +/- 0.3
Relative Humidity RH [3 ; 98] % +/-1.8%
Air velocity Va [0.15 ; 1] m/s +/- 0.03 m/s
CO2 CO2 [0 ; 5000] ppm +/- 50 ppm
The PMVe and the aPMV were calculated using respectively the equations Eq. (1) and Eq. (2) presented below (Fanger et al., 2002; Yao et al., 2009):
PMVe=e × PMV (1)
In their extended model, Fanger and Toftum (2002) proposed values for the “e” factor according to the level of expectation of the investigated region. For the present study, the “e” factor was set on 0.7 for few days (warm days) while the other days (cold) were not assessed with this index.
aPMV = PMV 1+a × PMV (2)
The “a” factor set by Yao and al. (2009) was estimated to 0.293 and -0.125 respectively for warm and cool conditions.
The Indoor Air Quality was assessed using measurements of CO2 concentration as index according to the EN15251 standard (2007). In fact, EN15251 defines four categories for the indoor environmental quality including the values of CO2 concentration above outdoor air level relevant to each category (Table 4). Thereby, continuous indoor and outdoor measurements of CO2 were carried out.
Table 4. CO2 concentration levels above to outdoor according to the EN 15251 classification
Category I II III IV
[CO2]int-[CO2]ext 350 500 800 <800
2.3.2. Subjective investigation
The subjective assessment aims to analyze occupant’s perception relevant to the thermal comfort and indoor air quality. In addition, it allowed us to collect information for the objective investigation (PMV calculation). Thus, students and teachers were invited to express their perception on ICQ by filling questionnaire for each period of the day. According to previous studies on subjective assessment in schools (Corgnati et al., 2004; Pereira et al., 2014; d’Ambrosio et al., 2013), a questionnaire was set up including four separate parts.
The first part focuses on personal information (age, body size, possible disease, and clothing for PMV calculation). The second part concerns thermal comfort perception based on four indexes: the Thermal Sensation Index (TSV) expressed on the 7-point ASHRAE scale (ASHRAE 55, 2010); the Thermal Discomfort Index (TDI) which expresses the thermal dissatisfaction on four scales (comfortable; slightly awkward; awkward; very awkward); the Thermal Preference Index which expresses the user’s preference relevant to thermal environment on 7-point scale (a lot warmer; warmer; a bit warmer; no change; a bit colder; colder; a lot colder); the Tolerance Index (TI) which expresses the tolerance relevant to thermal environment on 3-point scale (tolerable; slightly tolerable; hardly tolerable; intolerable).
The following part of the questionnaire gives us a feedback on the IAQ perception. It includes three indexes: The Air Quality Index which expresses about the IAQ on 4-point scale (not acceptable; slightly unacceptable; slightly acceptable; acceptable); the Odor Index (OI) which expresses the odor perception on 5-point scale (no odor; low smelly; smelly moderate; strong smelly; unbearable smelly); the Air Preference Index (API) which expresses the preference relevant to the air flow in the classroom based on 4-point scale (not acceptable; slightly unacceptable; slightly acceptable; acceptable).
The last part of the questionnaire gives us a feedback on the occupant’s satisfaction with the control of ICQ by various devices (windows; radiators, ventilation).
3. Results and discussion
3.1. Thermal comfort
For this present analysis, eight similar days (weather conditions) were selected. In fact, weather analysis showed some extreme weather conditions (cold days). Thereby, the results were averaged on these eight days for each period.
The survey revealed that 74 persons (on average) were interviewed for each period during these 8 days. The distribution man/woman was slightly in favor of men (60% for men and 40 % for women). The analysis of the first part of the questionnaire gave us detailed information about occupant’s morphology. In fact, the average age, height and weight were respectively 22 years old; 175 cm and 69 kg. According to the ISO 7730, the metabolic rates were fixed to 1.2 Met. Nevertheless, the clothing insulation was estimated using specific questions and values indicated by the standard ISO 7730 for each type of cloth. The results showed that the clothing insulation changes slightly during the evening (Table 5).
The survey revealed that 69% of occupants were satisfied with the thermal comfort while 6% judged the thermal environment unacceptable. In addition, 63 % of unsatisfied occupants would prefer colder environment.
According to Fanger’s theory (Fanger, 1970), the TSV was used to estimate the percentage of dissatisfied (PDF). In his approach, Fanger set the -3;-2; +2 and +3 as dissatisfied responses.
The Table 5 summarizes the results relevant to thermal comfort. As explained in the section 2.3.1, PMV; PMVe and aPMV were calculated using measured parameters. The subjective percentage of dissatisfied (PDF) was compared to PPD; PPDe and aPPD which represents objective percentages
of dissatisfied respectively relative to PMV; PMVe and aPMV.
Table 5. Synthesis table of all assessed values indexes to thermal comfort
Period Occ Clo Top PMV PPD PMVe PPDe aPMV aPPD PDF
V23 P1 41 1.3 26.41 1.15 32.9 0.80 18.73 1.00 26.47 34.2 P2 32 1.1 26.98 1.08 30.0 0.76 17.22 0.95 24.14 31.3 P3* 0 --- 24.85 --- --- --- --- --- --- ---P4 32 1.0 26.39 0.88 21.6 0.62 13.75 0.77 17.66 19.6 P5 34 1.0 24.78 0.54 11.1 0.37 7.96 0.47 9.64 7.9 L21 P1 42 1.2 25.91 1.07 29.3 0.75 16.90 0.93 23.64 30 P2 42 1.1 27.33 1.31 41.0 0.91 22.88 1.14 32.83 44.2 P3 39 1.1 27.30 1.34 42.3 0.93 23.57 1.16 33.88 43.4 P4 40 1.1 26.39 1.13 32.2 0.79 18.37 0.99 25.91 32 P5 34 1.1 26.78 1.21 36.1 0.85 20.31 1.06 28.91 37
* In P3, the V23 wasn’t occupied during selected days.
For both V23 and L21, it can be noticed that the environment was slightly warm. In fact, the three PMV are within the interval (0; +1.5). However, the climate was slightly colder in the V23. This gap can be explained by the morphology of the classrooms. In fact, the glazed area in L21 is more important than in V23. In addition, unlike V23, the L21 isn’t equipped with solar shading system. Thus, we can conclude that the glazing could affect ICQ. However, it would be preferable to assess the influence of local discomfort caused by windows. Indeed, a previous study revealed the effect of windows performance on thermal comfort using an extended PMV for areas affected by solar irradiation (P. Lyons et al., 1999).
Moreover, the PDF is closer to the standard PPD in L21 (warm conditions). Contrary, in the V23 (colder conditions), the PDF is lower than the PPD. In fact, we can notice that the correlation between PDF and PPD decreases when the thermal conditions becomes colder.
Unlike L21, the V23 occupancy was more fluctuant. Thereby, it can be noticed that the trend of the thermal environment is correlated to the occupancy level. In addition, PMVe and aPMV were closer to the subjective judgment in colder conditions. Thereby, we can conclude that the adaptive models (PMVe and aPMV) were more appropriate for unsteady conditions.
3.2. Indoor air quality
Figure 4. Percentage of dissatisfied indexes in V23 without unoccupied period
Figure 5. Percentage of dissatisfied indexes in L21 1 2 3 4 0.0 5.0 10.0 15.0 20.0 25.0 30.0 35.0 PPD PPDe aPPD PDF Period P P D /P P D e/ aP P D /P D F [% ] 1 2 3 4 5 0.0 5.0 10.0 15.0 20.0 25.0 30.0 35.0 40.0 45.0 PPD PPDe aPPD PDF Period P P D /P P D e/ aP P D /P D F [% ]
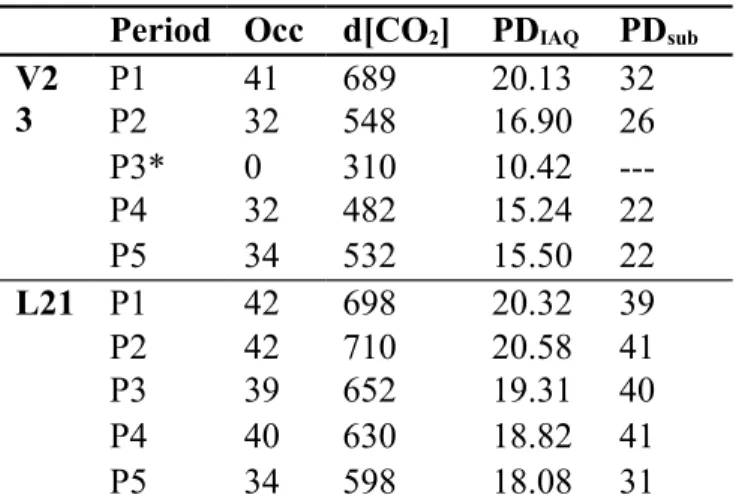
The Table 6 summarizes subjective and objective results relevant to IAQ. For each period, the dissatisfaction with the IAQ is expressed using the expression of PDIAQ (ECA, 1992) given in Eq. (3). The percentage of dissatisfied derived from CO2 concentration above outdoor are compared to the subjective judgment.
PDIAQ=395× e(−15.15 ×CO2 −0.25
) (3)
The average CO2 concentration above the outdoor was between 300 and 700 ppm. According to standards (EN15251, 2007), these values
correspond to the category III (slightly acceptable expected IAQ). However, by the observation of the time evolution of CO2 concentration, some peaks were observed (max: 1200 ppm).
From the observations, we can notice a gap between subjective and objective results. In fact, people’s expectation is larger than the ranges estimated from the measurements. Moreover, the occupancy influence was more significant in the subjective results.
As expected, the lowest IAQ were observed during low occupancy level. However, the impact of the occupancy was more significant to student’s judgment even if the two tendencies (subjective and objective) were close.
4. Conclusion
In this study, both subjective and objective methodologies were used to assess ICQ in ESTP classrooms. However, some gaps were detected between perceived and measured ICQ in various indoor climate conditions. Indeed, the investigation needs to be extended for the fourth seasons. Moreover, other methodologies for ICQ assessment could be explored: adaptive thermal approach on long term assessment; extended PMV for local discomfort caused by solar irradiation trough windows; IAQ assessment based on various pollutants.
This present work is a part of a thesis in progress which aims to study ICQ relevant to hybrid ventilation strategies. Besides testing ICQ on field, this work allowed us to test various methodologies for assessment.
References
ASHRAE 55, Thermal environment condition for human occupancy, ANSI/ASHRAE Standard 55: American Society of Heating, Retriggering and Air-Conditioning Engineers, Inc. 2010.
Table 6. Synthesis table of all assessed values indexes to thermal comfort
Figure 6. PDiaq plotted with PDsub for each period
Period Occ d[CO2] PDIAQ PDsub
V2 3 P1P2 4132 689548 20.1316.90 3226 P3* 0 310 10.42 ---P4 32 482 15.24 22 P5 34 532 15.50 22 L21 P1 42 698 20.32 39 P2 42 710 20.58 41 P3 39 652 19.31 40 P4 40 630 18.82 41 P5 34 598 18.08 31
R. Becker, I. Goldberger, M. Paciuk, 2006 Improving energy performance of school buildings while ensuring indoor air
quality ventilation. Building and Environment 42 (2007) 3261–3276.
G. Besler, M. Besler, Towards healthy microclimate of closed spaces and habitats. Environmental Protection Engineering 2000; 26(3): 23–38.
Clausen G., 200, Sensory evaluation of emission and indoor air quality, in Proceedings of Healthy Buldings 2000, Espoo, Finland, vol1, 53-62.
S. Corgnati, M. Filippi, S. Viazzo, 2004, Perception of the thermal environment in high school and university classrooms:
Subjective preferences and thermal comfort, Building and Environment 42 (2007) 951–959.
S. Corgnati, R. Ansaldi, M. Filippi, 2008, Thermal comfort in Italian classrooms under free running conditions during
midseasons: Assessment through objective and subjective approaches, Building and Environment 44 (2009) 785-792.
F.R. D’Ambrosio Alfano, E. Ianniello, B.I. Palella, 2013, PMV-PPD and acceptability in naturally ventilated schools, Building and Environment 67 (2013) 129-137.
EN 15251, Indoor environmental input parameters for design and assessment of energy performance of buildings: addressing
indoor air quality, thermal environment, lighting and acoustics, Comité Européen de Normalisation, Brussels, 2007.
EN ISO 7726, Ergonomics of thermal environment-instruments for measuring physical quantities, International Organization for Standardization, Genève, 1998.
EN ISO 7730: 2005 ergonomics of thermal environment, Analytical determination and interpretation of thermal comfort using
calculation of the PMV and PPD indices and local thermal discomfort criteria, Geneve: International Standardization Organization,
2005.
Energy Plus weather data Paris-Orly, US Department of Energy website, www.apps1.eere.energy.gov.
European Collaborative Action, Indoor air quality and its impact on man, report 11: guidelines for ventilation requirements in
buildings. Directorate General for Science and Development, Joint Research Centre- Environment Institute; 1992.
P. O. Fanger, J. Toftum, Extension of the PMV model to non-air-conditioned buildings in warm climates, 2002 Energy and Buildings 34 (2002) 553-536.
P. O. Fanger, 1970, Thermal comfort, Danish Technical Press, Copenhagen, Denmark.
P. O. Fanger, B. Berg-Munch, 1983, Ventilation and body odour, In: Proceedings of Enclosed Spaces, ASHRAE, Atlanta, 45-50.
Lee, K.W. Mui , L.T. Wong, W.Y. Chan , E.W.M. Lee, C.T. Cheung, 2011, Student learning performance and indoor
environmental quality (IEQ) in air-conditioned university teaching room, Building and Environment 49 (2012) 238-244.
P. Lyons, D. Arasteh, 1999, Windows performance for human comfort, ASHRAE Winter Meeting, Dallas, TX, February 5-9, 2000.
S. Mors, L.M.Jan. Hensen, G.Marcel. Loomans, C.Atze. Boerstra, 2011, Adaptive thermal comfort in primary school
classrooms: Creating and validating PMV-based comfort chart, Building and Environment 46 (2011) 2454-2461.
D. Mumovic , J. Palmer, M. Davies, M. Orme, I. Ridley, T. Oreszczyn , C. Judd, R. Critchlow, H.A. Medina, G. Pilmoor, C. Pearson, P. Way, 2008 Winter indoor air quality, thermal comfort and acoustic performance of newly built secondary schools in
England. Building and Environment 44 (2009) 1466–1477.
M. Papaglastra ,N. Gaitani, D. Kolokotsa, V. Assimakopoulosc, 2008 Experimental investigation of the air flow and indoor
carbon dioxide concentration in classrooms with intermittent natural ventilation, Energy and Buildings 40 (2008) 1833–1843.
L. D. Pereira, D. Raimond, S. P. Corgnati, M.G. da Silva, 2014, Assessment of indoor air quality and thermal comfort in
Portuguese secondary classrooms: Methodology and results, Building and Environment 81 (2014) 69-80.
REHVA GUIDBOOK No 13, Indoor Environment and Energy Efficiency in Schools Part1: Principles, 2011. REHVA GUIDBOOK No 14, Indoor Climate Quality Assessment, 2011.
R. F. Rupp, E. Ghisi, 2014, What is the most adequate method to assess thermal comfort in hybrid commercial buildings located in hot-humid summer climate?, Renewable and Sustainable Energy Reviews 29 (2014) 449–462.
M. Santamouris, A. Synnefa, M. Asssimakopoulos, I. Livada, K. Pavlou,
D. Teli Mark, F. Jentsch, Patrick A.B. James, 2012, Naturally ventilated classrooms: An assessment of existing comfort
models for predicting the thermal sensation and preference of primary school children. Energy and Buildings 53 (2012), 166–182.
M. Turunena , O.Toyinbo, T. Putus, A.Nevalainen ,R.Shaughnessy, U. Haverinen, 2013, Indoor environmental quality in
school buildings, and the health and wellbeing of students, International Journal of Hygiene and Environmental Health 217 (2014) 733–
739.
M. Turunena M., O. Toyinboa, T.Putus, A. Nevalainena, R. Shaughnessyc, 2014 Indoor environmental quality in school
buildings, and the health and wellbeing of students, International Journal of Hygiene and Environmental Health 2014, article in press
P. Wargocki , D.P. Wyon, 2012, Providing better thermal and air quality conditions in school classrooms would
becost-effective, Building and Environment 59 (2013) 581-589.
R. Yao, B. Li, J. Liu, 2009, A theoretical adaptive model of thermal comfort – Adaptive Predicted Mean Vote (aPMV)