Virology
Virus Detection by High-Throughput Sequencing of Small RNAs:
Large-Scale Performance Testing of Sequence Analysis Strategies
Sebastien Massart,†Michela Chiumenti, Kris De Jonghe, Rachel Glover, Annelies Haegeman, Igor Koloniuk, Petr Kom´ınek, Jan Kreuze, Denis Kutnjak, Leonidas Lotos, Franc¸ois Maclot, Varvara Maliogka, Hans J. Maree, Thibaut Olivier, Antonio Olmos, Mikhail M. Pooggin, Jean-S´ebastien Reynard, Ana B. Ruiz-Garc´ıa, Dana Safarova, Pierre H. H. Schneeberger, Noa Sela, Silvia Turco, Eeva J. Vainio, Eva Varallyay, Eric Verdin, Marcel Westenberg, Yves Brostaux, and Thierry Candresse First and eleventh authors: Integrated and Urban Plant Pathology Laboratory, TERRA-Gembloux Agro-Bio Tech, University of Li`ege, Passage des D´eport´es, 2, 5030 Gembloux, Belgium; second author: Institute for Plant Sustainable Protection–National Research Center, Via Amendola, 165/A, 70126 Bari, Italy; third and fifth authors: Plant Sciences Unit, Flanders Research Institute for Agriculture, Fisheries and Food (ILVO), Burg. Van Gansberghelaan 96, 9820 Merelbeke, Belgium; fourth author: Fera Science Ltd., National Agri-Food Innovation Campus, Sand Hutton, York, YO41 1LZ, United Kingdom; sixth author: Biology Centre CAS, Branisovska 31, 370 05 Ceske Budejovice, Czech Republic; seventh author: Crop Research Institute, Drnovska 507, 161 06 Prague, Czech Republic; eighth author: Crop Protection Division, International Potato Center (CIP), Aveninda La Molina 1895, La Molina, Lima, Peru; ninth author: Department of Biotechnology and Systems Biology, National Institute of Biology, Veˇcna pot 111, 1000 Ljubljana, Slovenia; tenth and twelfth authors: Laboratory of Plant Pathology, Faculty of Agriculture, Forestry and Natural Environment, School of Agriculture, Aristotle University of Thessaloniki, 54124 Thessaloniki, Greece; thirteenth author: Agricultural Research Council, Infruitec-Nietvoorbij: Institute for Deciduous Fruit, Vines and Wine, Nietvoorbij Farm R44, 7600 Stellenbosch, South Africa; fourteenth author: Life Sciences Department, Walloon Agricultural Research Center (CRA-W), Rue de Liroux 4, Gembloux, Belgium; fifteenth and eighteenth authors: Center of Plant Protection and Biotechnology, Instituto Valenciano de Investigaciones Agrarias (IVIA), Ctra Moncada-N´aquera km 4.5, 46113 Moncada, Valencia, Spain; sixteenth author: Institut national de la recherche agronomique (INRA), Unit´e Mixte de Recherche–Biologie et G´en´etique des Interactions Plante-Parasite (UMR BGPI), 34398 Montpellier, France; sixteenth and twenty-second authors: University of Basel, Department of Environmental Sciences, Botany, 4056 Basel, Switzerland; seventeenth author: Virology-Phytoplasmology Laboratory, Agroscope, 1260 Nyon, Switzerland; nineteenth author: Department of Cell Biology and Genetics, Faculty of Science, Palacky University in Olomouc, Slechtitelu 27, 783 71 Olomouc, Czech Republic; twentieth author: Department of Medical Parasitology and Infection Biology, Swiss Tropical and Public Health Institute, University of Basel, Socinstrasse 57, 4051 Basel, Switzerland; twenty-first author: Department of Plant Pathology and Weed Research, Agricultural Research Organization, The Volcani Center, 50250 Bet Dagan, Israel; twenty-third author: Natural Resources Institute Finland, Latokartanonkaari 9, 00790 Helsinki, Finland; twenty-fourth author: Diagnostic Group, Department of Genomics, Agricultural Biotechnology and Research Institute, National Agricultural Research and Innovation Center, Szent-Gyorgyi A street 4, H-2100, G¨od¨oll}o, Hungary; twenty-fifth author: Pathologie V´eg´etale, INRA, F-84140 Montfavet, France; twenty-sixth author: Dutch National Plant Protection Organization (NPPO-NL), P.O. Box. 9102, 6700 HC, Wageningen, The Netherlands; twenty-seventh author: Applied Statistics, Computer Science and Mathematics (SIMa), Gembloux Agro-Bio Tech, University of Li`ege, Passage des D´eport´es, 2, 5030 Gembloux, Belgium; and twenty-eighth author: UMR 1332 BFP, INRA, Universit´e de Bordeaux, CS20032, 33882 Villenave d’Ornon Cedex, France.
Accepted for publication 24 July 2018.
ABSTRACT Recent developments in high-throughput sequencing (HTS), also called next-generation sequencing (NGS), technologies and bioinfor-matics have drastically changed research on viral pathogens and spurred growing interest in the field of virus diagnostics. However, the reliability of HTS-based virus detection protocols must be evaluated before adopting them for diagnostics. Many different bioinformatics algorithms aimed at detecting viruses in HTS data have been reported but little attention has been paid thus far to their sensitivity and reliability for diagnostic purposes. Therefore, we compared the ability of 21 plant virology laboratories, each employing a different bioinformatics pipeline, to detect 12 plant viruses through a double-blind large-scale performance test using 10 datasets of 21- to 24-nucleotide small RNA (sRNA) sequences from three different infected plants. The sensitivity of virus detection ranged
between 35 and 100% among participants, with a marked negative effect when sequence depth decreased. The false-positive detection rate was very low and mainly related to the identification of host genome-integrated viral sequences or misinterpretation of the results. Reproducibility was high (91.6%). This work revealed the key influence of bioinformatics strategies for the sensitive detection of viruses in HTS sRNA datasets and, more specifically (i) the difficulty in detecting viral agents when they are novel or their sRNA abundance is low, (ii) the influence of key parameters at both assembly and annotation steps, (iii) the importance of completeness of reference sequence databases, and (iv) the significant level of scientific expertise needed when interpreting pipeline results. Overall, this work underlines key parameters and proposes recommendations for reliable sRNA-based detection of known and unknown viruses.
During the infection process, viruses and viroids are targeted by the host silencing machinery and, as a consequence, virus- or viroid-derived small RNAs (sRNAs) accumulate in infected host cells. In plants, these sRNAs are predominantly 21, 22, and 24 nucleotides (nt) in length, and each size class is produced by a different branch of the silencing machinery (Ding and Voinnet 2007). In 2009, the high-throughput sequencing (HTS) of sRNA populations followed by bioinformatic analysis was used for the first time; a powerful tool †Corresponding author: Sebastien Massart; E-mail: [email protected]
Funding:This article is based upon work from COST Action FA1407 (DIVAS), supported by COST (European Cooperation in Science and Technology). *Thee-Xtra logo stands for “electronic extra” and indicates that six supplementary materials are published online.
© 2019 The American Phytopathological Society
to identify and characterize viruses and viroids that infect plants, even in the case of novel viral agents (Kreuze et al. 2009).
In this way, HTS and the bioinformatics analysis of the data have already contributed to a paradigm shift in the fields of virus discovery and diagnosis (Adams et al. 2009; Al Rwahnih et al. 2015; Massart et al. 2014). Among various possible target nucleic acid pools such as virion-associated nucleic acids, double-stranded RNAs, total RNAs, ribosomal-RNA-depleted RNAs, or messenger RNAs, sRNAs offer the advantage of theoretically allowing the identification of all types of plant virus or virus-like agents (if they are targeted by the host silencing machinery), regardless of their genome nature or structure (DNA or RNA, single or double stranded, or satellite or viroid) (Roossinck et al. 2015). sRNA sequencing has consequently been a very popular strategy, used in approximately 50% of the publications on virus detection or symptom etiology (Barba et al. 2014; Hadidi et al. 2016).
Despite the fact that complete assemblies of viral genomes from sRNAs have been regularly achieved (Kreuze et al. 2009; Seguin et al. 2014; Vainio et al. 2015), in many cases only partial sequences, sometimes quite short, have been reconstructed or a virus has not been detected. This may reflect low proportions of viral sRNAs in total sRNA populations or insufficient sequencing depth (observations of several authors of the present study) but the assembly of viral sRNA sequences into contigs also faces specific computational challenges.
Assemblers have to simultaneously deal with the very small size and large number of total (viral and host) sRNA reads (typically millions for an individual sample) and, frequently, with the large diversity of the viral population infecting the sample. Several short-read assemblers are available today to perform this task, including Velvet (Zerbino and Birney 2008), Oases (Schulz et al. 2012), MetaVelvet (Namiki et al. 2012), ABySS (Simpson et al. 2009), or those integrated into commercial software packages such as Geneious (Biomatters) or CLC Genomics Workbench (Qiagen). In viral discovery and diagnostics, the quality of the initial sRNA assembly is critical for the effectiveness of the ensuing step (the annotation of contigs in order to identify the viruses present). This is particularly true when trying to identify a novel agent that is not represented in reference sequence databases (Barrero et al. 2017; Massart et al. 2014).
The annotation of contigs is usually performed using homology searches with tools such as BLAST, in its various forms (e.g., BLASTN or BLASTX) (Altschul et al. 1990), or MegaBLAST (Morgulis et al. 2008) on general (National Center for Bio-technology Information [NCBI] GenBank) or custom viral da-tabases. In some cases, this can be complemented by read or contig mapping strategies on general or virus-specific databases using tools such as BWA (Li and Durbin 2009), tools integrated in commercial software packages, or publicly available online tools. Such mapping approaches have the theoretical advantage of being potentially more sensitive to detect poorly represented viral agents but are obviously very limited when confronted with novel viruses or viroids absent from databases. If the host genome sequence is available, a filtering step can be applied to separate viral sRNAs or viral contigs from the host sRNAs or contigs, which may facilitate virus genome reconstruction (Seguin et al. 2014).
Although conceptually very simple, the analysis of an sRNA dataset to identify virus or virus-like agents is, in fact, a complex task (Soueidan et al. 2014; Wu et al. 2015), with many possible choices and options in terms of both general strategy and specific tools and parameters, all of which may impact the ultimate ability to pose a sensitive, specific, and repeatable diagnosis. Given the broad interest in the sRNA-based approach for virus detection (Hadidi et al. 2016; Massart et al. 2014; Wu et al. 2015), many laboratories, in particular in the plant virology field, have embraced it and developed in-house pipelines and strategies for sRNA HTS data analysis. However, the performance levels of these various tools and, more broadly, their comparative advantages or limits for virus detection have not been scrutinized thus far.
In the available literature, the comparison of bioinformatic pipe-lines is always carried out by a single group of scientists developing a new algorithm. Such small-scale comparisons are necessary but may generate some bias. Indeed, they reflect the performance of the algorithms as assessed by the pipeline developers. This will not necessarily reflect the performance of the algorithms once they are used by the scientific community. Performance testing of laboratory protocols by end users has been a common approach for more than a decade. Nevertheless, there have been very few studies comparing and benchmarking on a large scale the efficiency of bioinformatics analyses; moreover, they were carried out by individual laborato-ries, based on a restricted number of strategies (Barrero et al. 2017; Seguin et al. 2014; Visser et al. 2016). It is noteworthy that performance testing as addressed here is a key step toward the selection of specific protocols that can be further ring tested on a large scale for official validation and inclusion in rou-tine diagnostics (following, for example, the EPPO standard PM 7/122).
Bearing this in mind, a large-scale performance test of the bioinformatic pipelines implemented by a wide range of plant virology laboratories was set up. The comparative, double-blind study reported here provides the first large-scale evaluation of the sensitivity, specificity, and reproducibility of sRNA data analysis using a range of bioinformatics strategies and tools on 10 files generated from three different datasets rarefied at three different sequencing depths. Therefore, this performance testing repre-sents a first attempt at large-scale comparison and validation of bioinformatics pipelines by end users. It fills a key gap toward the standardization of HTS-based detection of viruses and will be a strong foundation for the development of diagnostic protocols. It also highlights key elements to be considered when performing such analyses for virus detection and diagnostic.
MATERIALS AND METHODS
Origin of the sequencing data. Three sRNA datasets from different origins and hosts and displaying different complexity levels were selected (Supplementary Material S1). The sRNA dataset from grapevine was previously generated from Vitis berlandieri× V. riparia ‘Kober 125AA’, planted in a screenhouse of the Crop Research Institute (Prague, Czech Republic) (Kom´ınek et al. 2009). Seven viruses and two viroids have been detected in leaf samples from this plant by HTS (Eichmeier et al. 2016) and confirmed by reverse-transcription polymerase chain reaction (RT-PCR) or enzyme-linked immunosorbent assay (ELISA): Grapevine leafroll-associated virus 1 (GLRaV-1, whole genome sequence deposited as KY827404), Grapevine virus A (GVA), Grapevine virus B, Grapevine rupestris stem pitting-associated virus (GRSPaV), Grapevine rupestris vein feathering virus, Grapevine Syrah virus 1, Grapevine red globe virus (GRGV), Hop stunt viroid (HSVd), and Grapevine yellow speckle viroid 1 (GYSVd1). In the case of GRGV, only very partial sequence data were available in GenBank when the present evaluation was performed.
The sRNA dataset from potato (Solanum tuberosum, unidentified cultivar) was collected from a field in Quichas, Cerro de Pasco, Peru in 2011. Two viruses were detected by HTS and confirmed by RT-PCR: Potato virus X (PVX) (present under the form of two distinct isolates) (Kutnjak et al. 2014) and a new nepovirus, Potato virus B (PVB), not yet available in the databases when the evaluation was performed (De Souza et al. 2017).
The sRNA dataset of apple was generated from mature leaf material collected from a Malus× domestica ‘Golden Delicious’ (NIVV) apple plant grafted onto an MM.109 rootstock, grown in a greenhouse of the Agricultural Research Council (Stellenbosch, South Africa). The Apple stem grooving virus (ASGV, under the form of two distinct isolates) was detected in this plant by HTS and confirmed by RT-PCR (Visser et al. 2014).
Fastq file preparation and quality control of sRNA reads.Three sequencing depths were selected for each sample: the highest depth (2.5M reads) can be considered within the range of realistic sequencing depths for virus detection, whereas the lower depths are not realistic for a routine use of sRNA sequencing but have the advantage of rarefying the viral sequences, creating datasets where virus detection is therefore expected to be more difficult. They also simulate “worst-case” situations in which virus titer is very low in a sample, even at high sequencing depth. The resulting datasets are publicly available online (https://github.com/ plantvirology/COST_Action_PT/releases) and should prove a valuable resource for future performance testing of bioinformatics strategies. CLC Genomic Workbench (Qiagen) was used to randomly subsample the original fastq files of 21-to 24-nt sRNA sequencing datasets from the three above-described plant samples. The chosen subsample data sizes were 50,000 (50K), 250,000 (250K), and 2,500,000 (2.5M) reads for each sample (Table 1). In addition, a second random subsampling was carried out at the 250K-read depth for the grapevine dataset to create two technical pseudoreplicates. The quality of the resulting 10 fastq files was controlled by running FastQC (unpresented data) and calculating the percentage of viral reads for each virus in each sample. For each of the 10 fastq files, a mapping of the reads against a set of reference sequences for each of the virus or viroid species was performed. Because the reference sequences for the fastq files derived from the grapevine sample were not known, the complete genome sequences providing the best cumulative e-value in BLAST analyses of reads were chosen. To reduce the bias of possible divergent strains, when the addition of a second reference sequence significantly im-proved the number of mapped reads for a given virus or viroid, a
simultaneous mapping on both reference sequences was computed. All mappings were carried out using the software BWA (version 0.7.12) to allow a minimum of 17 consecutive identities (–l= 17 and –k= 0) or 19 identities in an alignment of 20 nucleotides (–l = 20 and –k= 1). The numbers of mapped reads and percentages of breadth and depth of coverage for each fastq file as well as the GenBank accession numbers used as reference sequences for each virus or viroid are shown in Table 1.
Organization of the performance test. The participants, anonymous to one another and designated alphabetically (A through X), obtained access to the 10 double-blinded fastq files and analyzed them using their own bioinformatics pipelines to identify the viral agents present in each dataset. The bioinformatics protocols used by the 21 participants are detailed in Table 2. The results were reported by each participant in two Excel files. The first file contained the list of contigs with homologies to viral sequences generated by each pipeline and their characteristics (name coverage of the contig, contig sequence) for each fastq file. The second file contained the diagnostic report with the names of the viral agents detected in each sample. After submitting the first file, the participants received information on the host plant and they had to analyze the contig list to deliver a final list of the viruses or viroids detected in each sample.
Analyses of viral contigs. These analyses were carried out using the contigs reported as viral by each participant and their characteristics (number of reads and sequence).
To evaluate the ability of each pipeline to assemble reads into identifiable viral contigs, the number of reads integrated into contigs annotated as viral was calculated as a percentage of total reads and compared among the various datasets. The three apple datasets were not included in this comparison because too few participants successfully reported the identification of viral contigs. In addition, the numbers and respective lengths of the contigs identified as viral by different pipelines were plotted as a violin graph (ggplot 2.1.0; RStudio 0.99.489). Pipelines H and O were excluded from this analysis because they provided incomplete contig sequences. Furthermore, the PVB, PVX, and GLRaV-1 contig sequences submitted by participants were examined to compare efficiency levels in contig building and to identify possi-ble assembly artifacts (chimeric or misidentified contigs). The reference genome sequences (obtained from the samples) were KJ534601 and KJ534604 for the two PVX isolates, KY827404 for GLRaV-1, and KX656670 and KX656671 for the two genomic RNAs of PVB (unpublished at the time of the analyses). For this analysis, CLC Genomic Workbench 8.5.1 (Qiagen) built-in map-ping tool was used with the following parameters: minimum overlap and similarity 0.9, mismatch cost 2, linear insertion or deletion gap cost 3, open cost 6, and extent cost 1. Unmapped contigs were then subjected to BLASTN analysis (BLAST 2.2.29+ running within Geneious 9.1.6, with word size= 11, e-value = 1e-5, gap cost – open= 5, extend = 2, scoring – match = 2, and mismatch = _3; cutoff minimum coverage and identity criteria were similar to the mapping parameters) against the NCBI nt nucleotide database and a local database constructed from the above-listed reference sequences. The unmapped contigs that did not return specific BLASTN hits or did not pass the cutoff were marked as failed quality control (QC) sequences.
Data analysis. The results sent by participants were further analyzed using R v.3.3.2. The data files collected from the par-ticipating laboratories were first corrected for format compatibil-ity and then merged into a single data table containing one line per lab× sample × detected virus. Reported virus names were cleaned by a semiautomatic procedure to avoid discrepancies due to minor typing errors.
For each aggregation level (lab, virus, depth, or a combination of them), diagnostic sensitivity (referred to as sensitivity in the pre-sent article) and false discovery rates (FDR) were calculated by first comparing the reported virus to the provided reference list
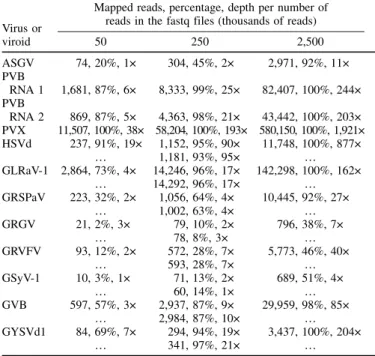
TABLE 1. Numbers of mapped reads, percentage of genome coverage (%), and average mapping depth (×) for the 10 fastq files and for each of the detected viruses and viroidsa
Virus or viroid
Mapped reads, percentage, depth per number of reads in the fastq files (thousands of reads)
50 250 2,500 ASGV 74, 20%, 1× 304, 45%, 2× 2,971, 92%, 11× PVB RNA 1 1,681, 87%, 6× 8,333, 99%, 25× 82,407, 100%, 244× PVB RNA 2 869, 87%, 5× 4,363, 98%, 21× 43,442, 100%, 203× PVX 11,507, 100%, 38× 58,204, 100%, 193× 580,150, 100%, 1,921× HSVd 237, 91%, 19× 1,152, 95%, 90× 11,748, 100%, 877× … 1,181, 93%, 95× … GLRaV-1 2,864, 73%, 4× 14,246, 96%, 17× 142,298, 100%, 162× … 14,292, 96%, 17× … GRSPaV 223, 32%, 2× 1,056, 64%, 4× 10,445, 92%, 27× … 1,002, 63%, 4× … GRGV 21, 2%, 3× 79, 10%, 2× 796, 38%, 7× … 78, 8%, 3× … GRVFV 93, 12%, 2× 572, 28%, 7× 5,773, 46%, 40× … 593, 28%, 7× … GSyV-1 10, 3%, 1× 71, 13%, 2× 689, 51%, 4× … 60, 14%, 1× … GVB 597, 57%, 3× 2,937, 87%, 9× 29,959, 98%, 85× … 2,984, 87%, 10× … GYSVd1 84, 69%, 7× 294, 94%, 19× 3,437, 100%, 204× … 341, 97%, 21× …
aFor grapevine, the first line and second lines correspond to samples 2 and 9 (pseudoreplicates), respectively. The reference sequences are ASGV= Apple stem grooving virus (NC_001749, JX080201), PVB= Potato virus B RNA 1 (KX656670.1) and RNA 2 (KX656671.1), PVX= Potato virus X (KJ534603 and KJ534604), HSVd= Hop stunt viroid (X87924), GLRaV-1 = Grapevine leafroll-associated virus 1 (KY827404), GRSPaV = Grapevine rupestris stem pitting-associated virus (AY881626 and KR054734), GVA= Grapevine virus A (AF007415 and DQ855084), GVB= Grapevine virus B (GU733707), GYSVd1= Grapevine yellow speckle viroid 1 (AB028466), family Tymoviridae corresponds to Grapevine red globe virus (GRGV) (KX171167), GSyV-1= Grapevine Syrah virus 1 (FJ436028), and GRVFV= Grapevine rupestris vein feathering virus (AY706994).
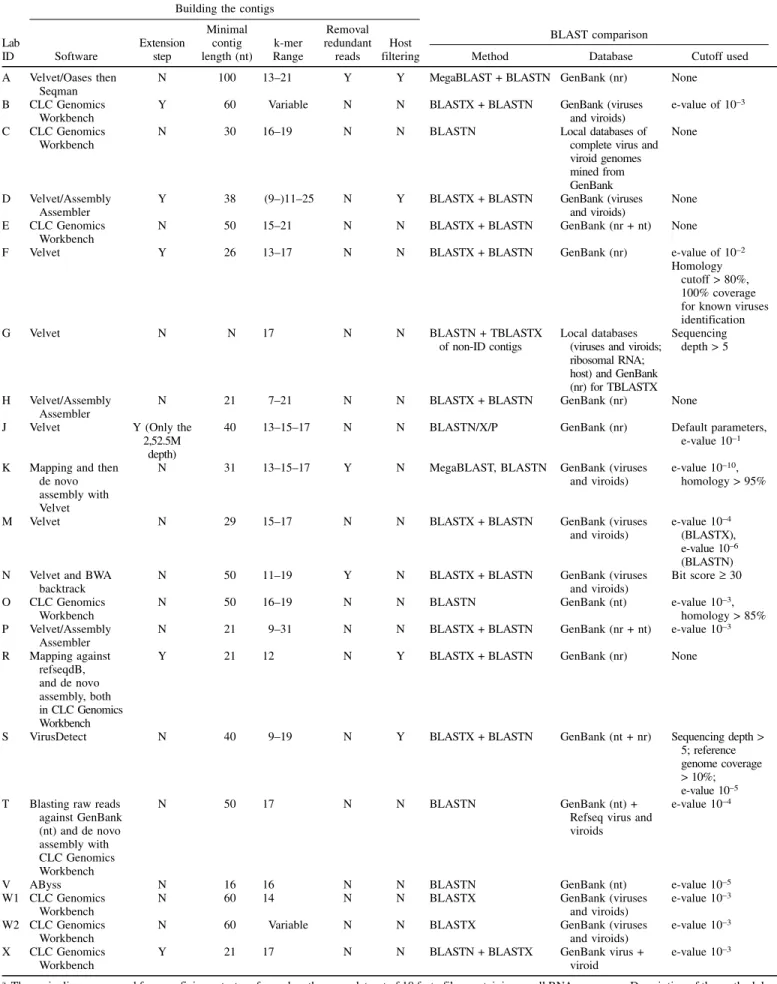
TABLE 2. Summary of the pipelines used by the participating laboratories for proficiency testinga
Building the contigs
BLAST comparison Lab ID Software Extension step Minimal contig length (nt) k-mer Range Removal redundant reads Host
filtering Method Database Cutoff used
A Velvet/Oases then Seqman
N 100 13–21 Y Y MegaBLAST+ BLASTN GenBank (nr) None
B CLC Genomics
Workbench
Y 60 Variable N N BLASTX+ BLASTN GenBank (viruses
and viroids)
e-value of 10_3
C CLC Genomics
Workbench
N 30 16–19 N N BLASTN Local databases of
complete virus and viroid genomes mined from GenBank None D Velvet/Assembly Assembler
Y 38 (9–)11–25 N Y BLASTX+ BLASTN GenBank (viruses
and viroids)
None
E CLC Genomics
Workbench
N 50 15–21 N N BLASTX+ BLASTN GenBank (nr+ nt) None
F Velvet Y 26 13–17 N N BLASTX+ BLASTN GenBank (nr) e-value of 10_2
Homology cutoff> 80%, 100% coverage for known viruses identification
G Velvet N N 17 N N BLASTN+ TBLASTX
of non-ID contigs
Local databases (viruses and viroids; ribosomal RNA; host) and GenBank (nr) for TBLASTX
Sequencing depth> 5
H Velvet/Assembly Assembler
N 21 7–21 N N BLASTX+ BLASTN GenBank (nr) None
J Velvet Y (Only the
2,52.5M depth)
40 13–15–17 N N BLASTN/X/P GenBank (nr) Default parameters,
e-value 10_1 K Mapping and then
de novo assembly with Velvet
N 31 13–15–17 Y N MegaBLAST, BLASTN GenBank (viruses
and viroids)
e-value 10_10, homology> 95%
M Velvet N 29 15–17 N N BLASTX+ BLASTN GenBank (viruses
and viroids)
e-value 10_4 (BLASTX), e-value 10_6 (BLASTN) N Velvet and BWA
backtrack
N 50 11–19 Y N BLASTX+ BLASTN GenBank (viruses
and viroids)
Bit score³ 30
O CLC Genomics
Workbench
N 50 16–19 N N BLASTN GenBank (nt) e-value 10_3,
homology> 85% P Velvet/Assembly
Assembler
N 21 9–31 N N BLASTX+ BLASTN GenBank (nr+ nt) e-value 10_3
R Mapping against refseqdB, and de novo assembly, both in CLC Genomics Workbench
Y 21 12 N Y BLASTX+ BLASTN GenBank (nr) None
S VirusDetect N 40 9–19 N Y BLASTX+ BLASTN GenBank (nt+ nr) Sequencing depth>
5; reference genome coverage > 10%; e-value 10_5 T Blasting raw reads
against GenBank (nt) and de novo assembly with CLC Genomics Workbench N 50 17 N N BLASTN GenBank (nt)+
Refseq virus and viroids
e-value 10_4
V AByss N 16 16 N N BLASTN GenBank (nt) e-value 10_5
W1 CLC Genomics Workbench
N 60 14 N N BLASTX GenBank (viruses
and viroids)
e-value 10_3 W2 CLC Genomics
Workbench
N 60 Variable N N BLASTX GenBank (viruses
and viroids)
e-value 10_3
X CLC Genomics
Workbench
Y 21 17 N N BLASTN+ BLASTX GenBank virus+
viroid
e-value 10_3
aThese pipelines were used for a proficiency test performed on the same dataset of 10 fastq files containing small RNA sequences. Description of the methodology used by the 21 participants (A to X) to build the contigs (software, extension step, minimal contig length, k-mer range, removal of redundant reads, and host filtering) and BLAST comparison (method, database, and cutoff) are summarized. Parameters for each pipeline are classically used for this type of analyses and are not chosen by default or randomly. Pipelines are then detailed for each participant.
(P= number of viruses in the reference list), then calculating the number of true- and false-positive detections (TPD and FPD, respectively) for each member of the level, followed by the sensitivity and FDR using the formulas Sensitivity= TPD/P and FDR= FPD/(TPD + FPD).
Therefore, the pipeline sensitivity was estimated as the percent-age of detected virus or viroid species over the total number of the viral agents known to be present in each plant sample. The FDR was estimated as the proportion of virus or viroids erroneously reported to be present over the total number of reported agents.
A partial least square regression (PLSR) was also conducted to identify the most important pipeline parameters on the detec-tion performance (sensitivity and FDR). The parameters were the following: minimum contig length, minimum k-mer, k-mer range, average contig length, number of contigs, and average number of reads. Pipelines B, W2, D, and H were removed from this analysis due to missing information about k-mer for the first two and an inconsistent reported number of reads for the latter two.
Criteria for evaluating the sensitivity of virus detection. Detection sensitivity was defined as the ability to detect a virus or viroid species known to be present in the analyzed plant. Different scenarios were available to rate TPD and FPD. For example, several pipelines reported the presence of an unknown nepovirus in the potato sample (PVB), which was absent in the sequence databases at the time of our test, while others reported the detection of a known nepovirus such as Tomato black ring virus (TBRV) or Beet ringspot virus (BRSV) because these viruses showed the highest BLAST score with the contigs representing the new viral agent. According to a stringent interpretation, the reports on TBRVor BRSV could be considered false positives because the sample was, in fact, infected by PVB and not by TBRV or BRSV. However, a less stringent interpretation would consider that the TBRV- or BRSV-reporting pipelines correctly detected the presence of a nepovirus in the sample. Such a complex situation also occurred in the case of the grapevine sample infected by a different member of the Tymovir-idae family, whose taxonomy is complex and for which partial sequences are difficult to unambiguously assign to one or another of several closely related viral species (GRGV, Grapevine vein feathering virus, and so on). Therefore, we assessed sensitivity using relaxed interpretation criteria, assuming positive detection when the presence of any kind of nepovirus and any kind of
Tymoviridae member was reported in the potato and grapevine samples, respectively. The use of more stringent criteria would obviously have decreased sensitivity and conversely increased the FPD rate.
RESULTS
Comparison of detection sensitivity among pipelines. The detailed results delivered by the participants of this perfor-mance testing are summarized in Table 3 and Supplementary Material S2 and are detailed in Supplementary Material S3. Global sensitivity for all 21 pipelines was 70%, taking into consideration all of the sequencing depths. As expected, detection sensitivity increased with increasing sequencing depths, ranging from 46% at the minimum depth (50K) to 87% at the maximum depth (2.5M). Taken together, these results indicate a variable and, in some instances limited, performance level by end users, and demonstrate that the detection of viruses present from HTS data might be complex.
When the sensitivity levels of different pipelines were compared, substantial differences were obtained. One-third of the pipelines (7 of 21) reached fully accurate detection (100% sensitivity) at the maximum sequencing depth (and 3 of them had false positives; see below). One pipeline (R) showed 100% sensitivity at all three sequencing depths and a second one (T) reached 90% sensitivity at the lowest depth (50K) and 100% at the two higher depths. Noticeably, both pipelines included an additional mapping step of all sRNA reads against existing databases. The four pipelines that used a host-filtering step (performed after inferring host species for each dataset) had higher average sensitivity (88%) than the other pipelines (68%).
Of 11 pipelines using Velvet as the first (or the only) de novo assembler (A, D, F, G, H, J, K, M, N, P, and S), 5 detected all the viruses at the highest sequencing depth (D, F, G, J, and S). Among the Velvet-based pipelines, pipeline J, which used lower k-mer values of 13, 15, and 17, was very sensitive for viral detection at the medium sequencing depth (94%) and at the lowest depth (70%). Comparatively, pipeline G, which used a single k-mer value of 17, showed only 53 and 20% sensitivity at the medium or low sequencing depths, respectively. Pipeline M, which used k-mer values of 15 and 17, reached good sensitivity at the medium and high sequencing depths (94 and 90%, respectively) but had a poorer performance at the lowest depth (50%). These elements suggest that the use of a wide range of k-mers (13 to 21) could be beneficial. Furthermore, a combination of Velvet (k-mer = 13 to 17) and Geneious (for Velvet contig extension), applied in pipeline F, showed better sensitivity at the lowest sequencing depth (80%) than those pipelines that used only Velvet. However, the use of a broad range of k-mer values did not yield a high detection level at the medium and lower sequencing depths when Velvet was combined with Assembly Assembler (pipelines D, H, and P). Likewise, pipeline A, which used Velvet/Oases and Seqman (for assembling Oases contigs filtered through the host genome), did not reach good sensitivity at the medium and low depths, although a broad k-mer range was applied. It should be noted, however, that this pipeline used the highest minimum contig length cutoff (100 nt). Importantly, this latter pipeline failed to detect one virus (ASGV) in the apple sample even at the highest sequencing depth because the minimum contig length cutoff was higher than the maximum lengths of the viral contigs generated by Velvet (<60 nt).
Pipeline S uses a specific Velvet- and BWA-based software program (VirusDetect_v1.5) that performs sRNA mapping to the viral reference sequence database as the first step and then (optionally) alignment to a host reference sequence to subtract nonviral sRNAs before de novo assembly. It reached 100% sitivity at the highest and medium sequencing depths. Its sen-sitivity was poorer at the lowest depth (50%), possibly due to a sequencing depth cutoff of 5 (i.e., an identified contig needs to
TABLE 3. Average virus detection sensitivity for the participant laboratories (A to X) at the three sequencing depths and for all samples
Sensitivity (%) False discovery rate (FDR) (%) Lab ID 2,500,000 250,000 50,000 Average 2,500,000 250,000 50,000 A 90 53 10 51 0 0 0 B 80 35 30 48 0 0 0 C 80 71 60 70 0 0 0 D 100 82 50 77 17 7 9 E 80 82 30 64 0 0 0 F 100 88 80 89 0 0 0 G 100 53 20 58 0 0 0 H 70 65 30 55 0 0 0 J 100 94 70 88 0 0 9 K 90 71 40 67 0 0 0 M 90 94 50 78 0 6 18 N 90 82 30 67 0 0 0 O 40 41 20 34 0 0 0 P 70 59 20 50 0 0 0 R 100 100 100 100 9 6 9 S 100 100 50 83 0 0 0 T 100 100 90 97 0 0 0 V 80 88 60 76 0 0 0 W1 90 82 40 71 0 0 0 W2 90 82 60 77 0 0 0 X 80 71 30 60 0 8 27 Average 87 76 46 70 Global FDR= 1.9
exceed an average sequencing depth of 5 to be reported) that is applied in default settings in VirusDetect to avoid false positives (which may occur in multiplexed libraries at high sequencing depths). On the other hand, the mapping step was not applicable for detection of a new nepovirus (absent in the viral database).
Finally, the pipelines that used either CLC Genomics Workbench (B, C, E, O, W1, W2, and X), or Abbyss (V) for de novo assembly did not reach 100% sensitivity at any sequencing depth, except the two most sensitive pipelines, R and T, for which the CLC assembly was complemented by a mapping step (see above).
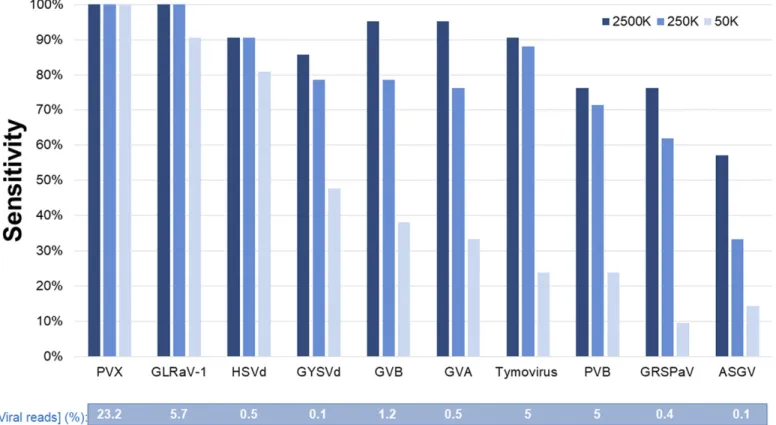
Comparison of sensitivity levels for different viral agents. There were large variations among pipelines as to their sensitivity in detecting the viruses and viroids present in the samples (Fig. 1). The proportion of reads for each agent in the dataset was a good indicator of the sensitivity of detection of each pathogen, although with a few notable exceptions. The high proportion of viral reads for PVX (23%) and GLRaV-1 (6%) likely explains their highest detection sensitivity, regardless of the pipeline or the sequencing depth. Most pipelines identified these viruses at the three coverage depths, except two that did not detect GLRaV-1 at the lowest depth.
On the other hand, even though PVB produced the third greatest percentage of sRNAs (5%), one-quarter of the pipelines failed to detect it even at the high and intermediate sequencing depths. De novo assemblers generated long viral contigs at these depths; thus, the differences in detection rates between PVX/GLRaV-1 and PVB could be related to the annotation strategies or expert analysis of the data. For example, pipelines C, K, and O used only BLASTN and not BLASTX to annotate the contigs and likely had too-stringent parameters (e.g., identity threshold> 85% and e-value of 10_10) to detect this new virus, similarly to pipeline A, which used MegaBLAST. At the minimum sequencing depth, sensitivity was strongly reduced, because only 5 of 21 pipelines detected PVB. This indicates that, for novel agents, especially at low sequencing depth,
the number and size of viral contigs may become too limiting for efficient annotation by BLAST: because the virus species was new, no specific BLAST hits were expected, resulting in only low-similarity hits, with other viruses in the same genus likely to be discarded as nonspecific.
Another situation was reflected by sensitivity in the detection of the two viroids HSVd and GYSVd1 present in the grapevine sample. At the lowest sequencing depth, sensitivity in their detection was >2 times higher than sensitivity in detecting virus GVA with a similar proportion of reads in the same sample. This likely reflects the fact that viroids have a much smaller genome size (approximately 20 times smaller than GVA), so that, for a given proportion of viral reads, the coverage of a viroid genome and, therefore, the assembly of reads into contigs are much better (percentage of genome coverage and genome fold coverage in Table 1) than for viruses with much bigger genomes.
ASGV present in the apple sample and GRSPaV present in the grapevine sample were detected with the lowest sensitivity level. For example, at the lowest sequencing depth, only two pipelines (R and T) correctly identified both viruses. As discussed above, these two pipelines combine de novo assembly and mapping all reads against viral reference databases. This separate step likely allowed these pipelines to detect ASGV and GRSPaV under the most stringent conditions, contrary to other pipelines that used a pure de novo assembly approach.
ASGV and GRSPaV represented the lowest proportion of viral reads as compared with the other viral agents. In this respect, it is noteworthy that they were detected with significantly greater sensitivity at the highest sequencing depth as compared with the intermediate sequencing depth. In contrast, sequencing depth did not play such a key role in the detection of other viral agents. Taken together, these results indicate that the proportion (and therefore the absolute number) of viral reads is likely the limiting factor in the detection of ASGV and GRSPaV.
Fig. 1.Mean diagnostic sensitivity for each virus and viroid at different sequencing depths. Results are presented for the 21 participating laboratories or pipelines. Percentage of reads for each virus or viroid in the original dataset is shown under the graph. PVX= Potato virus X, GLRaV-1 = Grapevine leafroll-associated virus 1, HSVd= Hop stunt viroid, GYSVd = Grapevine yellow speckle viroid, GVB = Grapevine virus B, GVA = Grapevine virus A, PVB = Potato virus B, GRSPaV = Grapevine rupestris stem pitting-associated virus, and ASGV= Apple stem grooving virus.
FDR.FDR was evaluated as the capacity of a pipeline to detect only the viruses present in the sample, as opposed to viral agents not present in the sample (false positives). Only five of the pipelines (D, J, M, R, and X) did report erroneously a total of 11 counts of detection of pararetroviruses belonging to the Caulimoviridae family (Caulimovirus, Badnavirus, and Cavemovirus), mostly from the potato sample (9 cases) but also in grapevine (2 cases). In addition, one pipeline (X) reported the presence of Grapevine fleck virus. This gives an overall FDR of approximately 2.1%, taking into account all pipelines, all samples, and all three sequencing depths (Table 3). This is an excellent performance but maybe not a surprising one given that a contig (or contigs) with sufficient homology with a known virus has to be assembled from the small interfering RNAs in order to result in FPD.
The second situation in which erroneous assignment of contigs can occur concerns the identification of novel agents that are not represented in the database or of agents whose taxonomic classification is unclear. The interpretation of these two cases is detailed in the Materials and Methods section. In such a case, the contig may be annotated by pipelines on the basis of the target sequence showing the highest BLAST score. Although the presence of a virus is correctly reported, its taxonomic identification is erroneous and, if several contigs are obtained, the presence of several agents may be reported. Such a situation was encountered, for example, in the case of PVB in the potato sample, which led two pipelines to report the presence of several different nepoviruses in the sample. Ultimately only additional expertise or curation efforts can sort out these situations.
Reproducibility. Two grapevine technical pseudoreplicates were provided to the different participants (see Materials and Methods). The comparison of the results obtained by the different pipelines provided information about the reproducibility of data analysis. Therefore, we analyzed (i) global reproducibility (taking into account all pipelines) and (ii) reproducibility per pipeline and per virus for the two pseudoreplicated grapevine samples.
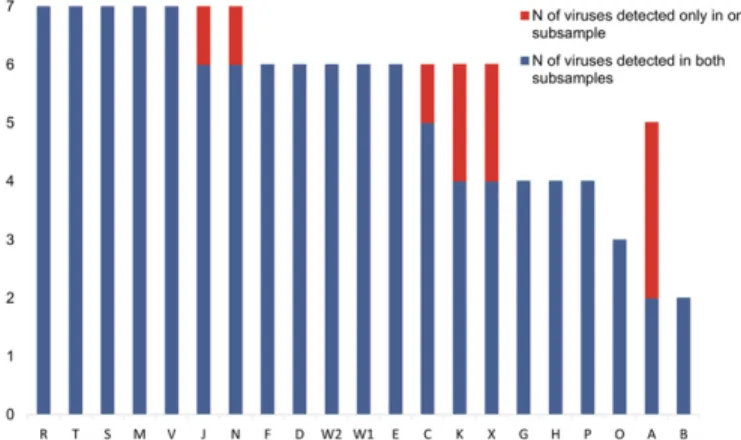
Of a total of 119 instances of detection of one of the viral agents by one of the pipelines, 10 (8.4%) were not reproduced between the pseudoreplicated samples, indicating that the overall reproducibil-ity of the performance test was quite high (91.6%). However, reproducibility varied between pipelines (Fig. 2). For 15 pipelines (71%), results were fully consistent between the pseudorepli-cates, regardless of the sensitivity of detection of individual viral agents. For the other participants, some viral agents (1, 2, or 3) were not detected in both pseudoreplicates, and the pipelines with lower detection sensitivity tended to show lower reproduc-ibility (Fig. 2).
As expected, a parallel analysis that addressed the reproducibility of the detection of different viruses and viroids by various pipelines similarly showed that the highest reproducibility was correlated with the highest sensitivity, with perfect reproducibility only for GLRaV-1 (100% sensitivity and reproducibility) and HSVd (90% sensitivity and 100% reproducibility) (Fig. 3). For all other viruses or viroids, one to three pipelines had discrepancies in their results between the two pseudoreplicate datasets, with the highest rate of discrepancies for GRSPaV (37.5%), the virus whose detection rate was also the lowest. Surprisingly, GYSVd1 was among the well-detected viral agents but also among those with the lowest reproducibility of detection, with three pipelines showing non-convergent results.
Percentage of reads in viral contigs. The percentages of viral reads assembled into contigs annotated as viral by each participant are summarized in Supplementary Material S4. For the grapevine sample, the percentages of reads in viral contigs dropped when depth decreased, as a probable consequence of a reduced assembly of viral sequences and a higher proportion of viral singletons or viral contigs falling below the minimal length (or average depth and genome coverage, in the case of VirusDetect) cutoff. All of the pipelines followed this trend, except pipeline R, with a peak for the 250K datasets, and pipeline O, with a drop for the 2.5M dataset. Although general trends were similar, large differ-ences were observed among pipelines for a single dataset. For example, the proportion of reads in viral contigs varied between 1% (A) and 11% (R) for the 250K datasets. However, pipelines A and M applied only nonredundant (unique) reads from each dataset for both contig assembly and read percentage counting. Together with the minimum contig length cutoff that varied greatly between pipelines (Table 2), this parameter could obviously influence the proportion of reads finally integrated into contigs annotated as viral. We further focused on GLRaV-1, which was identified by all pipelines but A at the 50K depth. The quantity of reads in contigs annotated as GLRaV-1 for each pipeline was correlated with global sensitivity when analyzing the 50K and 250K datasets but not with the 2.5M dataset.
For the potato sample, a similar drop of the percentage of reads in viral contigs was observed with decreasing sequencing depth, although in lower proportion and with a plateau between the intermediate and high sequencing depths. Exceptions concern pipelines A, M, T, and, to a lesser extent, W1, for which the lowest proportion of viral reads in contigs was observed with the 2.5M datasets. Pipeline T performed well at 50K reads (21%) but seemed to fail with the higher number of reads: proportions dropped to 5 and 0.5% for 250K and 2.5M, respectively. For a single dataset,
Fig. 2.Individual rate and reproducibility of detection of viral agents in the two grapevine pseudoreplicated datasets. Results are given for the seven viruses and viroids and for all the different participating laboratories at a sequencing depth of 250K reads. Bars indicate the total number of viral agents detected (sensitivity of detection) and the number of viral agents detected in both pseudoreplicates (reproducibility of detection).
Fig. 3.Global rate and reproducibility of viral agents’ detection in the two grapevine pseudoreplicated datasets. Results are given for the seven viruses and viroids, taking into account the results of the 21 different participating laboratories globally, at a sequencing depth of 250K reads. Bars indicate the total number of positive detections for each viral agent (sensitivity of detection= total column height) and the number of parallel detections in the two pseudoreplicates (reproducibility of detection).
the percentage of reads in viral contigs varied at least fivefold among pipelines. For potato, there was no relationship between the proportion of reads in viral contigs and pipeline sensitivity.
QC of the contigs. Violin plots summarizing the lengths of viral contigs in different samples showed huge diversity among pipelines (Supplementary Material S5). There was up to 100-fold difference in average contig size between pipelines V and J for the 2.5M potato dataset. Laboratory J used contig extension after de novo assembly, hence this difference. For all pipelines, longer contigs were built at higher sequencing depth but the presence of longer contigs did not correlate with increased sensitivity. During the QC of contigs generated for the potato sample, the average proportion of PVX and PVB contigs passing QC was 97% (Supplementary Material S6). For PVX, 5 of 19 pipelines had 100% of contigs passing QC (B, C, D, F, and G) and 5 pipelines (out of 13 that had detected PVB at least once) reached this level for PVB (A, E, G, R, and T). Again, large variations in pipeline performance were obtained: the percentages of incorrect contigs for each pipeline varied from 0% (pipelines G and R detected both viruses while B, C, F, and M detected only PVX) to 12.5% (pipeline T, concentrated on PVX at 50K). The proportion of contigs passing QC for GLRaV-1 was 96%. Pipelines B, F, G, M, N, R, and V assigned the contigs unerroneously, while pipeline X had 23.7% of failed contigs. A closer examination of the contigs that failed QC (data not shown) revealed that they were (i) chimeric plant–virus or viral strain–strain sequences (in the case of two PVX strains in the potato sample), (ii) misidentified (i.e., they either belonged to another viral species or to the host plant genome), or (iii) of unknown origin. Surprisingly, although the majority of failed QC contigs were produced by a few pipelines, there was no correlation with the assembler or extra parameters such as host sRNA filtering or additional contig extension steps.
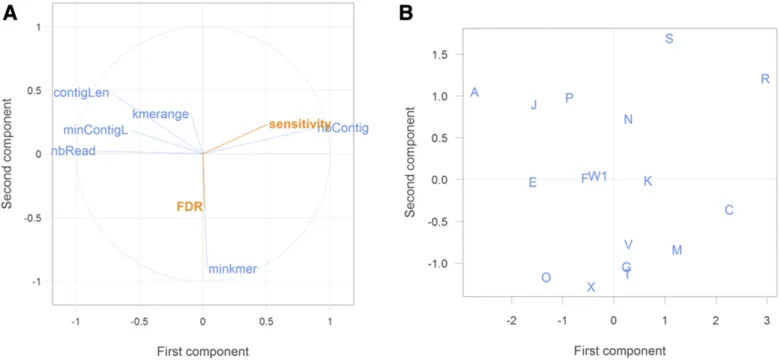
PLSR. A graphical two-dimensional representation of the PLSR, including all pipelines and sequencing depths, is shown in Figure 4. The pipelines were dispersed over the four quadrants of the graph without clear clustering. Better sensitivity was clearly related to a higher number of contigs and a smaller minimal contig length (and, as a consequence, a shorter average contig length). The
minimum k-mer size, the k-mer range, as well as the FDR had little influence on sensitivity (perpendicular vectors).
PLSR analyses were also carried out separately at each se-quencing depth (results not shown) and led to the same observation, except for the 2.5M depth, for which the correlation between sensitivity and pipeline parameters vanished because all pipelines achieved very high performances at this level.
The correlation analysis between sensitivity and five quantitative parameters (k-mer range, minimum k-mer, minimum contig length, average contig length, and number of contigs) revealed a maximal correlation of 0.45 with contig numbers (data not shown).
DISCUSSION
The present large-scale performance test highlights a huge di-versity of bioinformatics pipelines and expertise level for sRNA sequence analysis currently used by different participants. None of the 22 pipelines was fully identical to another one. This diversity and the lack of a thorough comparison between strategies rendered large-scale performance testing by end users mandatory to define the best practices and bioinformatics pipelines for virus discovery experiments and the future diagnostic use of HTS technologies. The test was therefore designed to evaluate, on a diverse set of viruses, (i) the performance of bioinformatics strategies (e.g., the selection of software, database, and parameters) and (ii) the expertise of the scientists who had to take diagnostic decisions based on the results of the bioinformatics analysis. Therefore, results depended on (i) the characteristics of the viral sequences in the dataset, (ii) the pipeline performance, (iii) the database accuracy and extensive-ness, and (iv) the scientists’ expertise.
The results clearly illustrate that, even if a reasonably high sequencing depth such as 2.5M reads is used, identifying all of the viral agents present in a plant sample is a nontrivial task and many elements have to be taken into consideration when trying to select a bioinformatics analysis strategy.
The most important characteristic for the viral sequences themselves is their relative abundance in the sequence dataset, a higher proportion being correlated with higher sensitivity of
Fig. 4.Graphical two-dimensional representation of the partial least square (PLS), including all of the pipelines and sequencing depths. A, Partial least square regression (PLSR) correlations between pipeline parameters and sensitivity and false discovery rate (FDR) and B, position of the laboratories’ pipelines in the new PLS projection space. Abbreviations: minContigL= minimum contig length, contigLen = average contig length, nbContig = number of contigs, minkmer = minimum k-mer, kmerange= k-mer range, and nbRead = average number of reads.
detection. The size of the viral genome is also important, as shown with the better detection of viroids compared with viruses at similar relative proportions in the grapevine sample. A further character-istic corresponds to the distribution of sRNA reads along the viral genome. For example, ASGV sRNA reads were generally aggre-gated in narrow specific hotspots that either share short overlaps or have gaps between them, resulting in the generation of short contigs (data not presented).
The performance of the pipelines can be evaluated through their sensitivity. Higher sensitivity was achieved by the pipelines that used a dual approach, combining de novo assembly and direct mapping of unassembled sRNAs against reference viral databases. In this scenario, sensitivity was increased by the mapping step, which can detect single reads that are not assembled into contigs or assembled in contigs smaller than the set minimum contig length (as for ASGV). Nevertheless, small sequence reads of 21 to 24 nt can be mapped on conserved regions shared by virus genera and families, thereby potentially leading to a reporting of virus species that are not present in the sample. In addition, HTS-based approaches are likely to meet contamination problems or issues, similar to PCR-based detection methods, so that the detection of a single or a few viral reads might not be considered sufficient to consider a sample positive. Ideally, all parts of a viral genome should be represented by sRNAs (and their contigs) to ensure that the virus species is correctly identified, even if very low levels of contamination between samples cannot be ruled out. With this in mind, dedicated pipelines such as VirusDetect provide percentages of genome coverage together with total and normalized sequencing depths as standard outputs to aid users in evaluating the significance of identified contigs.
Concerning de novo assembly of sRNAs, a parameter that significantly affected sensitivity was the minimum contig length cutoff, which should be kept under 60 nt. Retrospective analysis showed that the failure to detect ASGV was correlated in some pipelines to a cutoff of 60 nt or above that eliminated shorter contigs, including all those representing ASGV. As shown for GLRaV-1, sensitivity was also related to the ability of the pipelines to assemble reads in viral contigs with decreasing sequencing depths. This can also explain the failure of some of the pipelines to detect the same virus or viroid in the two grapevine pseudorepli-cates: contig length for a virus or viroid may have fallen below the detection threshold in one of the two replicates. In addition, the use of Velvet with low k-mer values (13, 15, and 17), with broader k-mer ranges, or in combination with contig extension by Geneious seemed to deliver the most sensitive results. This observation needs to be considered carefully because it was not confirmed by the PLSR analysis performed only on the pipelines that used Velvet but was confirmed by a principal component analysis on the same pipelines (data not shown). However, it is generally acknowledged that, as a counterpart, it can also increase the computing run time.
Other critical but more trivial limiting factors include the choice of the BLAST significance thresholds and the BLAST strategy (BLASTN only versus BLASTX or a combination of BLASTN and BLASTX). Given the need to detect both protein-coding and noncoding parts of viruses, and protein-noncoding viral agents such as viroids, the use of a BLASTN-only strategy with too-stringent thresholds resulted in lower sensitivity, in particular for the detection of PVB. Using NCBI online BLAST, the choice of highly similar sequences (MegaBLAST) also failed to identify even long contigs derived from PVB due to its genetic divergence with nepoviruses present in databases.
The situation observed for Tymoviridae (macula- and marafivi-ruses) illustrates another caveat in data analysis, that of database accuracy and extensiveness. In this particular example, the full extent of the high intraspecific diversity and of the relationships between viral agents is still unknown, and only very partial ge-nomic sequences were available for one of them. Consequently, the small contigs may have yielded a correct or incorrect annotation
depending on their positions in the genome. The very low coverage of the viral agents involved, which are phloem-limited, further complicated the analysis. As a consequence of these difficulties, even at the 2.5M sequencing depth, only two participants managed to correctly report the presence of all three viral agents. This result suggests that, for such complex situations, even this sequencing depth may represent a strong limiting factor to complete viral indexing. When the results were discussed, it appeared that many pipelines had detected sequence polymorphisms in the Tymoviridae contigs but that scientists considered the data insufficient for diagnostic assignment and that it was necessary to investigate the presence of these low-titer viruses by classical molecular biology tools before reporting them. This underlined the importance of expert scientist evaluation in final results and the usefulness of such performance testing. More positively, the results obtained in the present test prompted a reevaluation of the grapevine sample using classical PCR approaches, which ultimately confirmed the presence of the three putative Tymoviridae species (data not shown).
Despite the very low false detection rates observed whatever the bioinformatic pipeline, the importance of expert analysis is clearly illustrated in the present study. False discoveries fell into two categories. One, which concerned the false detection of various known nepoviruses such as TBRV in the potato sample by several pipelines, reflected their reporting strategy of listing only the highest BLAST score without additional expert analysis. The second involved the detection of various DNA pararetroviruses and corresponded to BLAST annotations of contigs that likely represent endogenous viral elements (EVEs) known to be integrated in plant genomes and represented in the population of endogenous plant sRNAs (Aiewsakun and Katzourakis 2015). This is a well-known hurdle with pararetroviruses (and other plant DNA viruses), for which distinguishing between an EVE and an episomaly replicating virus may require additional experimental efforts (Massart et al. 2017) or additional expertise in order to analyze BLAST annotations or the distribution of sRNAs along the virus genome in detail (Rajeswaran et al. 2014). In addition, as stated above, the mixed approach combining de novo assembly with read mapping on viral reference databases requires a high level of expertise when interpreting the results to avoid false-positive results. Expert analysis by trained scientists or diagnosticians is indeed required to validate the viral hit through the exploration of other BLAST homologies for the read, and to identify other reads mapping on the same sequence and their mapping location or the presence of reads with hits on taxonomically related viruses. This expert analysis is also necessary to spot the presence of a new virus, as exemplified in the case of PVB.
In conclusion, our large-scale evaluation of HTS bioinformatics pipelines, including 21 participants and 22 bioinformatics pipe-lines, is the first ever organized for virus detection. It represents a key milestone for the transition of HTS bioinformatics toward its use for virus diagnosis. It underlined the huge diversity in the performance of algorithms among pipelines and the key influence of scientist expertise for appropriate diagnostic interpretation of the pipeline results, especially in four cases: the identification of low titer virus, a new virus, integrated viral sequences, and poorly characterized viral species. This performance testing paves the way for designing future diagnostic standards because technical recommendations for the diagnostic use of sRNA sequencing can be proposed: (i) using, at the very minimum, 2.5M high-quality sequencing reads; (ii) using a de Brujin graph-based assembler such as Velvet with a broad range of k-mers for de novo assembly; (iii) using a combination of de novo assembly and database mapping; (iv) setting a low threshold for minimal contig length; (v) combining BLASTn and BLASTx analyses with low e-value thresholds to identify viral contigs; and (vi) analyzing carefully the results generated by the pipeline taking into account virus biology and taxonomy, sequence similarity between viruses, genome coverage, and database completeness for the identified species.
Whatever the pipeline, scientists and diagnosticians must have expert knowledge of viral taxonomy and be trained in data analysis to detect false-positive results. Our study also provides data and opens discussion on key aspects of HTS for diagnostic use: (i) a higher sequencing depth is recommended but it increases the cost of analysis, underlining the need to evaluate cost/benefit ratios; (ii) for some viral species and genera, more genomic sequences will be needed in the databases to allow streamline diagnosis; (iii) recommending a range of acceptable parameters and software might be preferred over defining a unique “one-fit-for-all” standard protocol for bioinformatics analysis; (iv) the development of a curated reference database could accompany the setting up of recom-mended bioinformatics pipelines; (v) the definition of threshold levels related to genome coverage or to a number of reads required to detect a virus will be needed, even though their definition will be a complex task due to the huge diversity of viral agents and sample types in plant virology; and (vi) these and other specificities of HTS technologies, with a paramount importance of bioinformatics, will probably require adaptation of Quality Management Systems and Standards.
LITERATURE CITED
Adams, I. P., Glover, R. H., Monger, W. A., Mumford, R., Jackeviciene, E., and Navalinskiene, M. 2009. Next-generation sequencing and metagenomic analysis: A universal diagnostic tool in plant virology. Mol. Plant Pathol. 10:537-545.
Aiewsakun, P., and Katzourakis, A. 2015. Endogenous viruses: Connecting recent and ancient viral evolution. Virology 479-480:26-37.
Al Rwahnih, M., Daubert, S., Golino, D., Islas, C., and Rowhani, A. 2015. Comparison of next-generation sequencing versus biological indexing for the optimal detection of viral pathogens in grapevine. Phytopathology 105: 758-763.
Altschul, S. F., Gish, W., Miller, W., Myers, E. W., and Lipman, D. J. 1990. Basic local alignment search tool. J. Mol. Biol. 215:403-410.
Barba, M., Czosnek, H., and Hadidi, A. 2014. Historical perspective, devel-opment and applications of next-generation sequencing in plant virology. Viruses 6:106-136.
Barrero, R. A., Napier, K. R., Cunnington, J., Liefting, L., Keenan, S., and Frampton, R. A. 2017. An internet-based bioinformatics toolkit for plant bio-security diagnosis and surveillance of viruses and viroids. BMC Bioinf. 18:26. De Souza, J., M¨uller, G., Perez, W., Cuellar, W., and Kreuze, J. 2017. Com-plete sequence and variability of a new subgroup B nepovirus infecting potato in central Peru. Arch. Virol. 162:885-889.
Ding, S.-W., and Voinnet, O. 2007. Antiviral immunity directed by small RNAs. Cell 130:413-426.
Eichmeier, A., Kom´ınkov´a, M., Kom´ınek, P., and Bar´anek, M. 2016. Com-prehensive virus detection using next generation sequencing in grapevine vascular tissues of plants obtained from the wine regions of Bohemia and Moravia (Czech Republic). PLoS One 11:e0167966.
Hadidi, A., Flores, R., Candresse, T., and Barba, M. 2016. Next-Generation Sequencing and Genome Editing in Plant Virology. Front. Microbiol. 7:1325. Kom´ınek, P. 2009. Distribution of grapevine viruses in vineyards of the Czech
Republic. J. Plant Pathol. 90:357-358.
Kreuze, J. F., Perez, A., Untiveros, M., Quispe, D., Fuentes, S., and Barker, I. 2009. Complete viral genome sequence and discovery of novel viruses by deep sequencing of small RNAs: A generic method for diagnosis, discovery and sequencing of viruses. Virology 388:1-7.
Kutnjak, D., Silvestre, R., Cuellar, W., Perez, W., M¨uller, G., and Ravnikar, M. 2014. Complete genome sequences of new divergent potato virus X isolates and discrimination between strains in a mixed infection using small RNAs sequencing approach. Virus Res. 191:45-50.
Li, H., and Durbin, R. 2009. Fast and accurate short read alignment with Burrows-Wheeler transform. Bioinformatics 25:1754-1760.
Massart, S., Candresse, T., Gil, J., Lacomme, C., Predajna, L., and Ravnikar, M. 2017. A framework for the evaluation of biosecurity, commercial, reg-ulatory, and scientific impacts of plant viruses and viroids identified by NGS technologies. Front. Microbiol. 8:45.
Massart, S., Olmos, A., Jijakli, H., and Candresse, T. 2014. Current impact and future directions of high throughput sequencing in plant virus diagnostics. Virus Res. 188:90-96.
Morgulis, A., Coulouris, G., Raytselis, Y., Madden, T. L., Agarwala, R., and Sch¨affer, A. A. 2008. Database indexing for production MegaBLAST searches. Bioinformatics 24:1757-1764.
Namiki, T., Hachiya, T., Tanaka, H., and Sakakibara, Y. 2012. MetaVelvet: An extension of Velvet assembler to de novo metagenome assembly from short sequence reads. Nucleic Acids Res. 40:e155.
Rajeswaran, R., Seguin, J., Chabannes, M., Duroy, P.-O., Laboureau, N., and Farinelli, L. 2014. Evasion of short interfering RNA-directed antiviral si-lencing in Musa acuminata persistently infected with six distinct banana streak pararetroviruses. J. Virol. 88:11516-11528.
Roossinck, M. J., Martin, D. P., and Roumagnac, P. 2015. Plant virus metagenomics: Advances in virus discovery. Phytopathology 105: 716-727. link
Schulz, M. H., Zerbino, D. R., Vingron, M., and Birney, E. 2012. Oases: Robust de novo RNA-seq assembly across the dynamic range of expression levels. Bioinformatics 28:1086-1092.
Seguin, J., Rajeswaran, R., Malpica-L ´opez, N., Martin, R. R., Kasschau, K., and Dolja, V. V. 2014. De novo reconstruction of consensus master genomes of plant RNA and DNA viruses from siRNAs. PLoS One 9: e88513.
Simpson, J. T., Wong, K., Jackman, S. D., Schein, J. E., Jones, S. J. M., and Birol, I. 2009. ABySS: A parallel assembler for short read sequence data. Genome Res. 19:1117-1123.
Soueidan, H., Schmitt, L.-A., Candresse, T., and Nikolski, M. 2014. Finding and identifying the viral needle in the metagenomic haystack: Trends and challenges. Front. Microbiol. 5:739.
Vainio, E. J., Jurvansuu, J., Streng, J., Rajam¨aki, M.-L., Hantula, J., and Valkonen, J. P. T. 2015. Diagnosis and discovery of fungal viruses using deep sequencing of small RNAs. J. Gen. Virol. 96:714-725.
Visser, M., Bester, R., Burger, J. T., and Maree, H. J. 2016. Next-generation sequencing for virus detection: Covering all the bases. Virol. J. 13:85. Visser, M., Maree, H. J., Rees, D. J. G., and Burger, J. T. 2014.
High-throughput sequencing reveals small RNAs involved in ASGV infection. BMC Genomics 15:568.
Wu, Q., Ding, S.-W., Zhang, Y., and Zhu, S. 2015. Identification of viruses and viroids by next-generation sequencing and homology-dependent and homology-independent algorithms. Annu. Rev. Phytopathol. 53: 425-444.
Zerbino, D. R., and Birney, E. 2008. Velvet: Algorithms for de novo short read assembly using de Bruijn graphs. Genome Res. 18:821-829.