THE PEP STANDARD
COMPUTABLE GENERAL EQUILIBRIUM MODEL
SINGLE‐COUNTRY, STATIC VERSION
PEP‐1‐1
SECOND REVISED EDITION
OCTOBER 2009
(MINOR CORRECTIONS, JANUARY 2010)
Bernard Decaluwé
1André Lemelin
2Hélène Maisonnave
3Véronique Robichaud
4Poverty and Economic Policy (PEP)
Research Network
1 Département d’économique, Université Laval, Québec 2 Centre INRS‐UCS, Université du Québec, Montréal 3 Financial and Fiscal Commission, South Africa, and PEP, Université Laval, Québec 4 CIRPÉE et PEP, Université Laval, Québec
CONTENTS
Contents 3
Preface 7
Introduction 8
1. Production 9
2. Income and savings 13
2.1 Households 13
2.2 Businesses 15
2.3 Government 16
2.4 Rest of the world 20
2.5 Transfers 20
3. Demand 22
4. Producer supplies of products and international trade 24
5. Prices 29
5.1 Production 29
5.2 International trade 31
5.3 Price indexes 32
6. Equilibrium 33
7. Gross domestic product 34
References 35
Appendix A: Equations, sets, variables and parameters 36
A1. Equations 36
A1.1 Production 36
A1.2 Income and savings 37
A1.5 Prices 40 A1.6 Equilibrium 42 A1.7 Gross domestic product 43
A2. Sets 43
A2.1 Industries and commodities 43 A2.2 Production factors 43
A2.3 Agents 43
A3. Variables 44
A3.1 Volume variables 44 A3.2 Price variables 45 A3.3 Nominal (value) variables 46
A4. Parameters 48
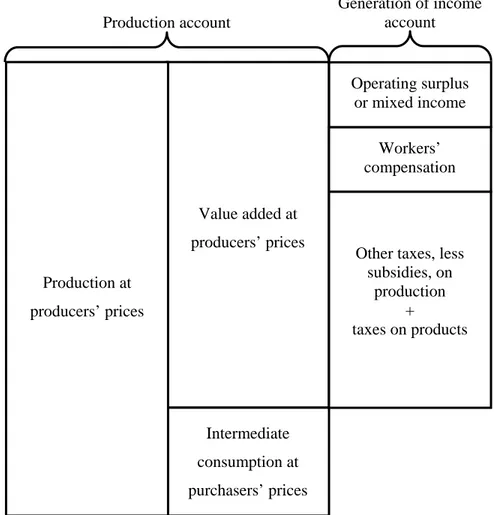
Appendix B: Model variables and concepts of the 1993 system of national accounts (SNA93) 51 B1. « Indirect » taxes 51 B1.1 Other taxes on production 52 B1.2 Taxes on products 53 B1.3 Corresponding variables in PEP-1-1 53
B2. Price concepts 54
B2.1 Producers’ prices and basic prices 54 B2.2 Purchasers’ prices 58 B2.3 Corresponding variables in PEP-1-1 59 B3. Trade and transport margins 59
B4. GDP concepts 61
B4.1 GDP at basic prices and at producers’ prices 61 B4.2 GDP at purchasers’ prices from the perspective of final demand 62 B4.3 GDP from the income perspective 62 B4.4 What about GDP at factor cost? 64 Appendix C: Mathematical derivations 66 C1. Relative demand of capital and labor 66 C1.1 Cost-minimizing problem 66 C1.2 Relative demand 67 C1.3 Elasticity of substitution 68
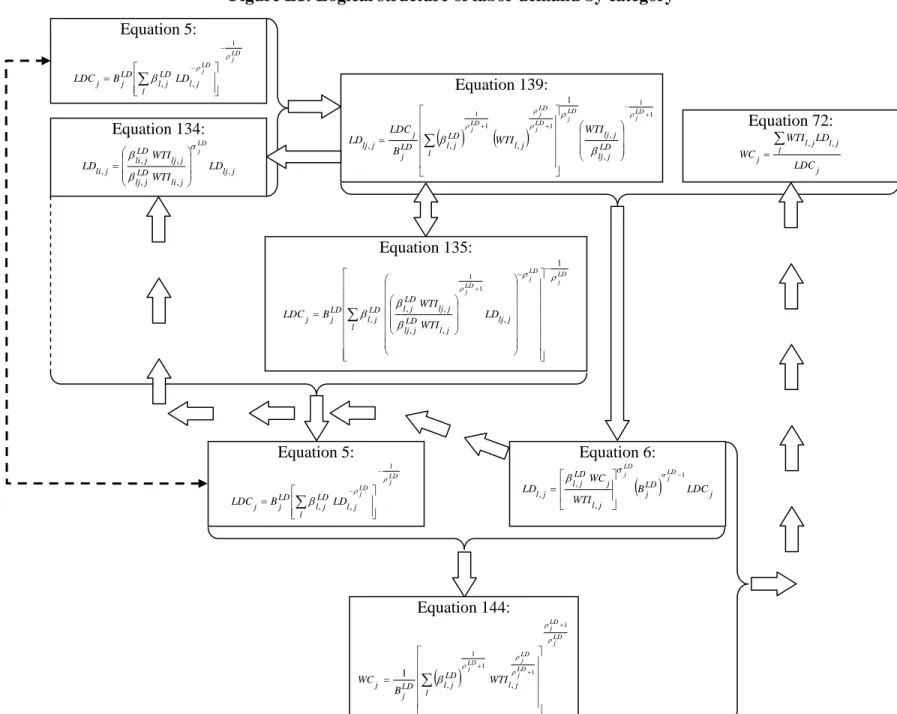
C2. Labor demand by category 70 C2.1 Wage bill minimizing problem 70 C2.2 Relative labor demand 71 C2.3 Unit cost of composite labor 72 C2.4 Labor demand for a single category in terms of relative wage rates 75 C2.6 Elasticity of substitution 75 C3. Demand for capital by category 77 C4. Stone-Geary utility and the demand for consumer goods 77 C5. Allocation of aggregate output to product supplies 78 C5.1 Sales revenue maximizing problem 78 C5.2 Relative supply of products 80 C5.3 Price of aggregate output 81 C5.4 Supply of individual products 83 C5.5 Elasticity of transformation 84 C6. Supply on domestic and export markets 86 C6.1 Sales revenue maximizing problem 86 C6.2 Relative supply on the domestic and export markets 87 C6.3 Elasticity of transformation 88 C7. Demand for local products and imports 91 C7.1 Expenditure minimizing problem 91 C7.2 Relative demand for local products and imports 92 C7.3 Elasticity of substitution 93 C8. Exact price indexes PIXINV and PIXGVT 95 Appendix D: Note on the rental rate and the rate of return on capital 97 Appendix E: Walras’ law, redundant equations, and slack variables (Leon) 99 E1. Walras’ Law and the LEON slack variable 99 E2. Demand for labor by category and the price of composite labor 99 E2.1 Equation 140 implies equations 135 and 5 100 E2.2 Equation 72 redundant given equations 5 and 6 101 E2.3 Summary of the logical structure 104 E3. Other slack variables 107 Appendix F: Model parametrization 109
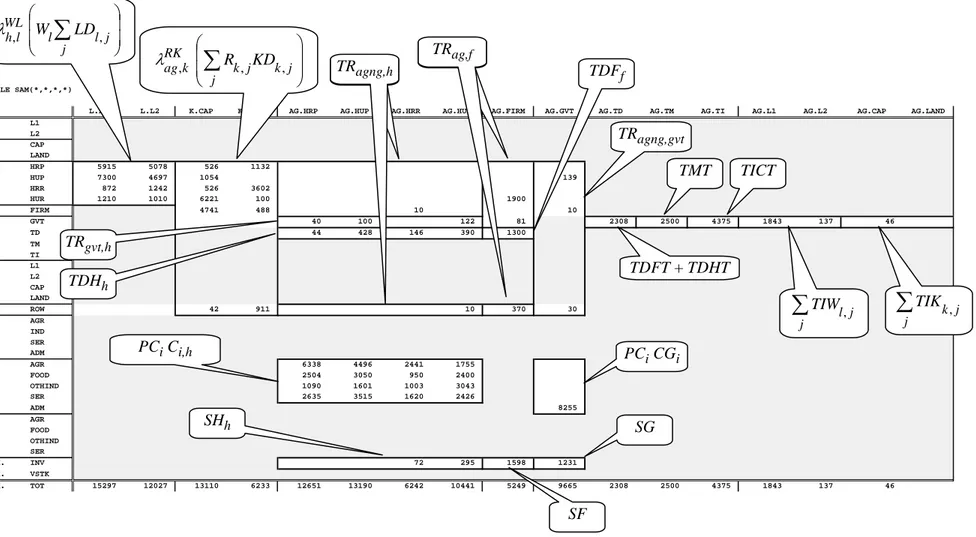
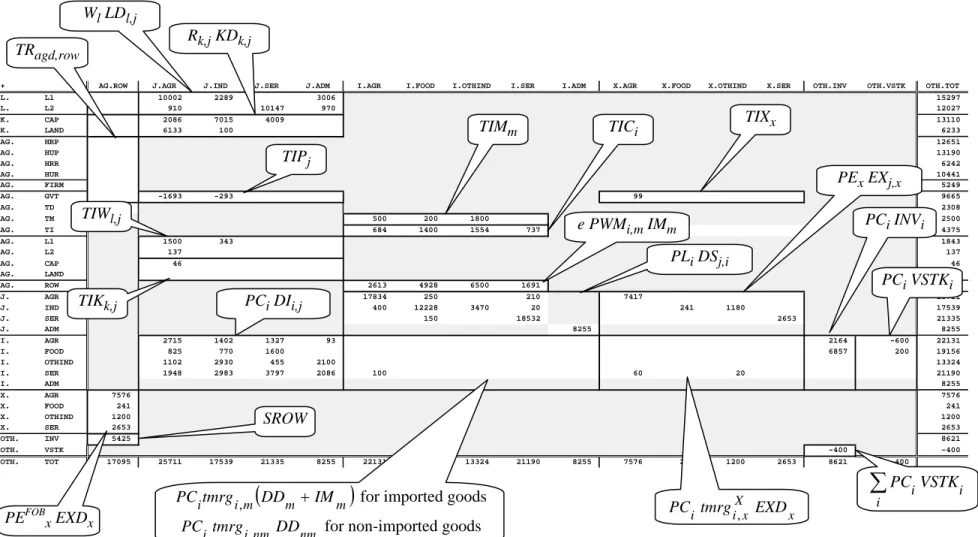
F2. Assignments from SAM data 110
F2.1 Notation 110
F2.2 Assignment of temporary base values to volume variables 110 F2.3 Assignment of base values to nominal variables 111 F2.4 Assignment of temporary values to parameters 112 F3. Free parameters 112 F3.1 Price elasticity of indexed values 112 F3.2 CES and CET elasticities 112 F3.3 Elasticity of international demand for exported commodity x 112 F3.4 LES parameters 113 F3.4 Intercepts of transfers, direct taxes and savings 113 F3.5 Exogenous prices 113
F4. Calibration 114
F4.1 Nominal variables 114 F4.2 Revised parameter assignments 116 F4.3 Parameters 116 F4.4 Indexed transfers and intercepts 123 F4.5 Leontief input coefficients 124 F4.6 CET parameters 124 F4.7 CES parameters 127 F4.8 LES parameters 132 F5. Calibration of gross domestic products 133 References for Appendix F 133
SINGLE-COUNTRY, STATIC VERSION
PREFACE
This paper documents the PEP-1-1 model developed by four members of the PEP research network. The PEP-1-1 model is the first major output of a project that emerged spontaneously from the long-standing association between the co-authors. Our ambition is to crystallize years, even decades for some of us, of CGE modeling experience, and to share the result with the PEP MPIA Network, and with the modeling community at large. In addition, PEP-1-1 is to be our basis, from which to further deepen our understanding of CGE analysis and develop modeling techniques that will tackle new problems. But, both in sharing our experience and exploring new paths, we want to remain in the realm of operational model building. So our intentions are all at once pedagogical, experimental, and practical. And, besides, we enjoy working together: it’s just plain fun !
A first, provisional edition of the PEP-1-1 documentation was issued in July 2009, in response to the interest shown by participants of the June 2009 PEP Network meeting in Santiago, Chile. So the authors have responded by hastening to make this paper available as soon as possible.
The model presented in this edition contains a few improvements relative to the provisional version. The principal changes are:
− The value added production function is now CES, rather than Cobb-Douglas.
− Investment demand distinguishes between gross fixed capital formation (GFCF) and changes in inventories.
− The aggregate output of each industry consists of several products, consistent with rectangular input-output tables which are now the standard.
− Several intermediate variables have been added to make the theoretical underpinnings of the model more explicit, and to link model variables to national accounting concepts more closely. In addition, a new appendix contains the detailed mathematical derivations of model equations.
Of course, we have tried to eliminate as many errors and « misprints » as possible. Needless to say, we welcome comments that will help us improve either the model or its presentation. Readers are invited to send their comments to André Lemelin at the following address: [email protected]
INTRODUCTION
This paper proposes a static computable general equilibrium (CGE) model designed for the study of a national economy. This CGE model is intended to be an operational tool for PEP Network researchers and other users, so we hope. With it, they will be able to develop a relatively standard model, and easily apply it to their country, whatever the particular structure of their social accounting matrix (SAM). The present model differs significantly from Decaluwé, Martens and Savard’s (2001) EXTER model, which has been used extensively in the past by network researchers who had been trained in one of the many modeling « Schools » held over the years in many parts of the world. In many respects, the PEP-1-1 model is richer than the more pedagogical EXTER. First, the PEP-1-1 model distinguishes several categories of workers and of capital. Also, PEP-1-1 is capable of taking into account a broader set of tax instruments, and it models all possible transfers between institutions (agents). Finally, the GAMS code, presented in a separate document, has been written in a general form, thanks to the use of sets. This will facilitate the application of PEP-1-1 to variously aggregated SAMs, by means of a few simple steps to make the SAM directly readable into the GAMS program. We are currently working on extensions of the PEP-1-1 model, to guide researchers in building dynamic or multi-country world models5.
In what follows, we present the model equations and state their underlying hypotheses. Appendices contain the complete list of equations, sets, variables and parameters. Our presentation begins with the production equations, from which are derived factor-demand equations and price equations. This follows the method of exposition suggested in Decaluwé, Martens and Savard (2001).
5 PEP-1-1 stands for single-country, single-period model. Forthcoming are: (i) single-country, multi-period, recursive dynamic model 1-t, (ii) single-period world model w-1, and finally, (iii) multi-period, recursive dynamic world model PEP-w-t.
1. PRODUCTION
The set of productive activities is represented by indices ,
{
,..., ,...}
1 Jj J J jj
j ∈ = .
Firms are assumed to operate in a perfectly competitive environment. So each industry’s representative firm maximizes profits subject to its production technology, while it considers the prices of goods and services and factors as given (price-taking behavior). Chart 1 describes the nested structure of production.
Chart 1: Nested structure of production
…
… …
Value added (VAj)
Leontief
Composite Labor (LDCj) Composite capital (KDCj)
Capital 1 (KD1,j)
Product 1 (DI1,j) Product 2 (DI2,j)
CES CES Capital 2 (KD2,j) Labor 1 (LD1,j) CES Leontief Labor 2 (LD2,j) Aggregate intermediate consumption (CIj) Output (XSTj)
Such nested structures are common in CGE models. It is usually expected that the elasticity of substitution is greater at lower levels of the hierarchy. There are other possible specifications, and, in the end, it is up to the modeler to decide which combination of specifications best fits the situation.
At the top level (equations 1 and 2), the sectoral output of each productive activity j combines value added and total intermediate consumption in fixed shares. In other words, the two aggregate inputs are considered to be strictly complementary, without any possibility of substitution, following a Leontief production function.
1.
VA
j=
v
jXST
j:
j
CI Total intermediate consumption of industry j :
j
VA Value added of industry j
:
j
XST Total aggregate output of industry j :
j
io Coefficient (Leontief – intermediate consumption) :
j
v Coefficient (Leontief – value added)
At the second level, each industry’s value added consists of composite labor and composite capital, following a constant elasticity of substitution (CES) specification.
3.
(
)
VA j VA j VA j j VA j j VA j VA j j B LDC KDC VA ρ ρ ρ β β 1 1 − − − ⎥ ⎥ ⎦ ⎤ ⎢ ⎢ ⎣ ⎡ − + = where : jKDC Industry j demand for composite capital
:
j
LDC Industry j demand for composite labor
:
VA j
B Scale parameter (CES – value added)
:
VA j
β Share parameter (CES – value added)
:
VA j
ρ Elasticity parameter (CES – value added) ; −1<ρVAj <∞
Profit maximization (or cost minimization) by the firms leads them to employ labor and capital to the point where the value marginal product of each is equal to its price (the wage rate and the rental rate of capital respectively). With a CES production function, such behavior is described by the demand for labor relative to capital of equation 4 (Appendix C1).
4. j j j VA j VA j j KDC WC RC LDC VA j σ β β ⎥ ⎥ ⎥ ⎦ ⎤ ⎢ ⎢ ⎢ ⎣ ⎡ − = 1 where : j
RC Rental rate of industry j composite capital :
j
:
VA j
σ Elasticity of transformation (CES – value added) ; < VA<∞
j
σ 0
In accordance with the algebra of CES aggregator functions,
VA j VA j VA j σ σ ρ =1− (Appendix C1).
At the bottom level on the value added side, the various categories of labor, indexed as
{
,..., ,...}
1 Ll L L
l∈ = , are combined following a constant elasticity of substitution (CES) technology (equation 5), which reflects the imperfect substitutability between different types of labor. The firm chooses its labor composition so as to minimize its labor cost given the relative wage rates. Labor demand of each type derives from the first-order conditions of cost minimization by the representative firm, subject to the CES technology (equation 6) (Appendix C2). Likewise, composite capital is a CES combination of the different categories of capital, indexed as k∈K =
{
K1,...,Kk,...}
. As in the case of labor, it is assumed that different categories of capital (land, buildings, machinery and equipment, etc.) are imperfect substitutes (equation 7). The demand for each type of capital results from cost minimization (equation 8). 5. LD j LD j l l j LD j l LD j j B LD LDC ρ ρ β 1 , , − − ⎥ ⎥ ⎦ ⎤ ⎢ ⎢ ⎣ ⎡ =∑
6.( )
LDj j j l j LD j l j l B LDC WTI WC LD LD j LD j 1 , , , − ⎥ ⎥ ⎦ ⎤ ⎢ ⎢ ⎣ ⎡ = σ σ β 7. KD j KD j k k j KD j k KD j j B KD KDC ρ ρ β 1 , , − − ⎥ ⎥ ⎦ ⎤ ⎢ ⎢ ⎣ ⎡ =∑
8.( )
KDj j j k j KD j k j k B KDC RTI RC KD KD j KD j 1 , , , − ⎥ ⎥ ⎦ ⎤ ⎢ ⎢ ⎣ ⎡ = σ σ β where : ,j kKD Demand for type k capital by industry j :
, j
l
LD Demand for type l labor by industry j :
, j
l
,j k
:
KD j
B Scale parameter (CES – composite capital) :
LD j
B Scale parameter (CES – composite labor)
:
,
KD j k
β Share parameter (CES – composite capital) :
,
LD j l
β Share parameter (CES – composite labor)
:
KD j
ρ Elasticity parameter (CES – composite capital); −1< ρKDj <∞ :
LD j
ρ Elasticity parameter (CES – composite labor); −1< ρLDj <∞ :
KD j
σ Elasticity of substitution (CES – composite capital); 0<σKDj <∞ :
LD j
σ Elasticity of substitution (CES – composite labor); 0<σLDj <∞
In accordance with the algebra of the CES production function,
KD j KD j KD j σ σ ρ =1− and LD j LD j LD j σ σ ρ = 1− (Appendix C2).
Finally, returning to the second level, but on the intermediate consumption side, aggregate intermediate consumption is made up of various goods and services. Here it is assumed that intermediate inputs are perfectly complementary, and are combined following a Leontief production function. No substitutions are possible. 9. j j i j i aij CI DI , , = where : ,j i
DI Intermediate consumption of commodity i by industry j :
, j
i
2. INCOME AND SAVINGS
The PEP-1-1 model offers the possibility of several categories of households and businesses, respectively
indexed as ,
{
,..., ,...}
{
}
1 Hh H AG H hjh ∈ ⊂ = , and f, fj∈F ⊂ AG = F1,...,Ff,... , together with
government, designated as GVT, and the rest of the world, ROW. Elements of the set AG of all agents are designated as:
{
}
{
H ,...,F1,...,Ff,...GVT,ROW}
AG agj ag, ∈ = H∪F∪ GVT,ROW = H1,..., h .2.1 Households
Household incomes come from three sources: labor income, capital income, and transfers received from other agents.
10.
h h
h
h YHL YHK YHTR
YH = + +
where :
h
YH Total income of type h households
:
h
YHK Capital income of type h households :
h
YHL Labor income of type h households :
h
YHTR Transfer income of type h households
Each household type receives a fixed share of the earnings of each type of labor (equation 11). Likewise, total capital income is distributed between agents, including households, in fixed proportions (equation 12). Finally, transfer income is simply the sum of all transfers received by type h households (equation 13). 11.
∑
∑
⎟⎟ ⎠ ⎞ ⎜ ⎜ ⎝ ⎛ = l l j l j WL l h h W LD YHL , , λ 12.∑
∑
⎟⎟ ⎠ ⎞ ⎜ ⎜ ⎝ ⎛ = k j k j k j RK k h h R KD YHK , , , λ 13. =∑
ag ag h h TR YHTR , where : ,j k,ag h
:
l
W Wage rate of type l labor
:
,
RK k ag
λ Share of type k capital income received by agent ag :
,
WL l h
λ Share of type l labor income received by type h households
Subtracting direct taxes and household transfers to government yields type h household disposable income (equation 14). Indeed, since household transfers to government are mostly contributions to various social programs, our calculation of disposable income is consistent with national accounts. Whatever disposable income is left after savings and transfers to other agents is entirely dedicated to consumption (equation 15).
Finally, household savings are a linear function of disposable income. This differs from the frequently used specification where savings are a fixed proportion of income. Equation 16, by contrast, allows for the marginal propensity to save to be different from the average propensity. This choice is motivated by the fact that it is common for certain household categories to have negative savings. Now, if it is assumed that the marginal propensity to save is equal to the average propensity, and if that parameter is calibrated on negative observed savings, then there results an undesirable consequence: a fall in the income of these households increases their savings, or a rise in income leads to more endebtedness. Our formulation avoids this pitfall, but introduces an extra free parameter: instead of just having to calibrate the average propensity to save, the modeler must also determine the marginal propensity. Usually, it is the latter that is handled as a free parameter, and its value is determined from the literature or by econometric estimation. Once the marginal propensity has been determined, the savings function intercept is calibrated from the SAM. For household categories with negative savings, the intercept will be negative, while the slope (the marginal propensity) is positive. In addition, equation 16 makes it possible to fully of partially index the intercept to changes in the consumer price index. This is especially useful for testing the model’s homogeneity, in which case price elasticity η is set to 1.
14. YDHh YHh TDHh TRgvth , − − = 15. = − −
∑
agng agngh h h h YDH SH TR CTH , 16. h h h h PIXCON sh sh YDH SH = η 0 + 1 where : h:
PIXCON Consumer price index
:
h
SH Savings of type h households
:
h
TDH Income taxes of type h households
:
h
YDH Disposable income of type h households :
η Price elasticity of indexed transfers and parameters :
0h
sh Intercept (type h household savings)
: 1h
sh Slope (type h household savings)
agng: Index of non-government agents;
{
}
{
ROW}
H H F F ROW F H AG AGNG agng f h,..., ,..., ,..., ,..., 1 1 = ∪ ∪ = ⊂ ∈2.2 Businesses
Business income consists, on one hand, of its share of capital income, and, on the other hand, of transfers received from other agents (including the transfer part of interest on consumer debt).
17. YFf =YFKf +YFTRf 18.
∑
∑
⎟⎟ ⎠ ⎞ ⎜ ⎜ ⎝ ⎛ = k j k j k j RK k f f R KD YFK , , , λ 19. =∑
ag f ag f TR YFTR , where : fYF Total income of type f businesses :
f
YFK Capital income of type f businesses :
f
YFTR Transfer income of type f businesses
Deducting business income taxes from total income yields the disposable income of each type of business (equation 20). Likewise, business savings are the residual that remains after subtracting transfers to other agents from disposable income (equation 21).
20. YDFf =YFf −TDFf 21. = −
∑
ag ag f f f YDF TR SF , wheref
:
f
TDF Income taxes of type f businesses
:
f
YDF Disposable income of type f businesses
2.3 Government
In the PEP-1-1 model, it is possible to take into account a large variety of tax instruments. Indeed, equation 22 says that the government draws its income from household and business income taxes, taxes on products and on imports (TPRCTS), and other taxes on production (TPRODN). According to the 1993
System of National Accounts (SNA93), taxes on products (not « production ») and imports consist of
indirect taxes on consumption, taxes and duties on imports, and export taxes, while other taxes on production consist of payroll taxes, taxes on capital, and taxes on production (see Appendix B1). In addition to these various forms of fiscal revenue, government receives part of the remuneration of capital and transfers from other agents. Equations 22 to 34 describe the different government revenue sources.
22. YG=YGK+TDHT+TDFT+TPRODN+TPRCTS+YGTR
23.
∑
∑
⎟⎟ ⎠ ⎞ ⎜ ⎜ ⎝ ⎛ = k j k j k j RK k gvt R KD YGK , , , λ 24. =∑
h h TDH TDHT 25. =∑
f f TDF TDFT26. TPRODN =TIWT +TIKT +TIPT
27. =
∑
j l l j TIW TIWT , , 28. =∑
j k k j TIK TIKT , , 29. =∑
j j TIP TIPT30. TPRCTS =TICT +TIMT +TIXT
31. =
∑
i i TIC TICT 32. =∑
m m TIM TIMT 33. =∑
x x TIX TIXT34. =
∑
agng agng gvt TR YGTR , where :TDFT Total government revenue from business income taxes :
TDHT Total government revenue from household income taxes :
i
TIC Government revenue from indirect taxes on product i :
TICT Total government receipts of indirect taxes on commodities :
, j
k
TIK Government revenue from taxes on type k capital used by industry j :
TIKT Total government revenue from from taxes on capital :
m
TIM Government revenue from import duties on product m :
TIMT Total government revenue from import duties :
j
TIP Government revenue from taxes on industry j production (excluding taxes directly related to the use of capital and labor)
:
TIPT Total government revenue from production taxes (excluding taxes directly related to the use of capital and labor)
:
, j
l
TIW Government revenue from payroll taxes on type l labor in industry j :
TIWT Total government revenue from payroll taxes :
x
TIX Government revenue from export taxes on product x :
TIXT Total government revenue from export taxes :
TPRCTS Total government revenue from taxes on products and imports
:
TPRODN Total government revenue from other taxes on production6
:
YG Total government income
:
YGK Government capital income :
YGTR Government transfer income
Similarly to what has been done with household savings, income taxes are described as a linear function of total income, whether it be for households (equation 35) or for businesses (equation 36). That way,
an arrangement can be useful for simulating fiscal changes: for instance, marginal rates of taxation can be computed from fiscal parameters7; given these marginal rates, the intercept is then calibrated from SAM values. Moreover, the intercept may be partially of fully indexed to changes in the consumer price index.
35. TDHh = PIXCONηttdh0h+ttdh1hYHh
36. TDFf = PIXCONηttdf0f +ttdf1fYFKf
where : 0f
ttdf Intercept (income taxes of type f businesses) :
1f
ttdf Marginal income tax rate of type f businesses :
0h
ttdh Intercept (income taxes of type h households) :
1h
ttdh Marginal income tax rate of type h households
As mentioned earlier, the model allows for taxes on production factors (payroll taxes and capital taxes), as well as for taxes on production itself (together, these three forms of taxation constitute « other taxes on production » in the SNA93 – see Appendix B1). First, as regards taxes on factors of production, the model notation distinguishes tax rates by industry, and also by type of labor or capital. Each rate then applies to the corresponding transactions (equations 37 and 38). Next, a tax may be applied to the total value of production (equation 39).
37. TIWl j ttiwl jWlLDl j , , , = 38. TIKk,j =ttikk,jRk,jKDk,j 39. j j j j ttip PP XST TIP = where : j
PP Industry j unit cost, including taxes directly related to the use of capital and labor, but
excluding other taxes on production :
, j
k
ttik Tax rate on type k capital used in industry j :
j
ttip Tax rate on the production of industry j :
, j
l
ttiw Tax rate on type l worker compensation in industry j
Finally, the government can implement three types of taxes on products (for the definition of « taxes on products », see Appendix B1). Equations 40 and 41 describe how these taxes are levied in the cases of non-imported and imported products. It should be noted that these taxes apply on the sales value including margins (trade and transport margins are discussed in Appendix B3) and custom duties whenever the latter exist. Other taxes collected are taxes and duties on imported products (equation 42), and export taxes (equation 43).
40. nm i i inm nm nm nm ttic PL PC tmrg DD TIC ⎟⎟ ⎠ ⎞ ⎜⎜ ⎝ ⎛ + =
∑
, 41.(
)
⎥ ⎦ ⎤ ⎢ ⎣ ⎡ ⎟⎟ ⎠ ⎞ ⎜⎜ ⎝ ⎛ + + + ⎟⎟ ⎠ ⎞ ⎜⎜ ⎝ ⎛ + =∑
∑
m i i im m m m i i im m m m ttic PL PC tmrg DD ttim PWM e PC tmrg IM TIC , 1 , 42. TIMm =ttimmPWMme IMm 43. x i X x i i x x x ttix PE PC tmrg EXD TIX ⎟⎟ ⎠ ⎞ ⎜⎜ ⎝ ⎛ + =∑
, where : iDD Domestic demand for commodity i produced locally :
e Exchange rate8; price of foreign currency in terms of local currency :
x
EX Quantity of product x exported :
m
IM Quantity of product m imported
:
x
PE Price received for exported commodity x (excluding export taxes) :
i
PL Price of local product i (excluding all taxes on products) :
m
PWM World price of imported product m (expressed in foreign currency) :
i
ttic Tax rate on commodity i :
m
ttim Rate of taxes and duties on imports of commodity m :
x
ttix Export tax rate on exported commodity x :
,ij
i
tmrg Rate of margin i applied to commodity ij
2006).
,x i
The current government budget surplus or deficit (positive or negative savings) is the difference between its revenue and its expenditures. The latter consist of transfers to agents and current expenditures on goods and services.
44. SG YG TR G agng agnggvt − − =
∑
, where : SG Government savings :G Current government expenditures on goods and services
2.4 Rest of the world
The rest of the world receives payments for the value of imports, part of the income of capital, and transfers from domestic agents (equation 45). Foreign spending in the domestic economy consists of the value of exports, and transfers to domestic agents. The difference between foreign receipts and spending is the amount of rest-of-the-world savings (equation 46), which are equal in absolute value to the current accoung balance, but of opposite sign (equation 47).
45.
∑
∑
∑
⎟⎟+∑
⎠ ⎞ ⎜ ⎜ ⎝ ⎛ + =agd rowagd
k j k j k j RK k row m m m TR KD R IM PWM e YROW λ , , , , 46. = −
∑
−∑
agd agd row
x x FOB x EXD TR PE YROW SROW , 47. SROW = −CAB where :
CAB Current account balance :
FOB x
PE FOB price of exported product x (in the national currency) :
SROW Rest-of-the-world savings :
YROW Rest-of-the-world income
2.5 Transfers
The way to treat transfers in a CGE model is not obvious. In most cases, indeed, these are payments without any real counterpart, and they are not explicitly related to a specific form of economic behavior. For lack of information on the precise nature of each type of transfer, they should be treated in the most neutral way possible, to prevent them from becoming a factor modifying economic agents’ behavior. So
household transfers to non-government agents and business transfers are simply proportional to disposable income. As for household transfers to government, they are akin to social program contributions: as such, they are treated in the same way as household income taxes. All other transfers are initially set equal to their SAM values, and indexed, fully or partially, to the consumer price index.
48. TRagng,h =λTRagng,hYDHh
49. h h h h gvt PIXCON tr tr YH TR 0 1 , = + η 50. TRag,f =λTRag,fYDFf
51. TRagng,gvt = PIXCONηTRagng0 ,gvt
52. 0
,
,row agdrow
agd PIXCON TR TR = η where : , TR agj ag
λ Share parameter (transfer functions) :
0gvt,h
tr Intercept (transfers by type h households to government) :
1gvt,h
The demand for goods and services, whether domestically produced or imported, consists of household consumption demand, investment demand, demand by public administrations, and demand as transport or trade margins (for the treatment of margins in the SNA93, see Appendix B3).
It is assumed that households have Stone-Geary utility functions (from which derives the Linear Expenditure System). A characteristic of these utility functions is that there is a minimum level of consumption of each commodity (which may be zero for some commodities). Contrary to Cobb-Douglas utility functions, often used in the literature, this specification imposes neither zero cross-price elasticities between all pairs of goods, nor unit income-elasticities for all goods. Thus, it offers a degree of flexibility with respect to substitution possibilities in response to relative price changes. Type h household demand for each good (equation 53) is determined by utility maximization subject to the budget constraint (Appendix C4). 53. ⎟⎟ ⎠ ⎞ ⎜ ⎜ ⎝ ⎛ − + =
∑
ij ij MIN h ij h LES h i i MIN h i i h i PC C PC CTH C PC C , , , , γ where : ,h iC Consumption of commodity i by type h households
:
,
MIN h i
C Minimum consumption of commodity i by type h households
:
i
PC Purchaser price of composite comodity i (including all taxes and margins) :
,
LES h i
γ Marginal share of commodity i in type h household consumption budget
Investment demand includes both gross fixed capital formation (GFCF) and changes in inventories. The two components of investment demand are quite different. In particular, GFCF cannot be negative (even though net investment, that is, gross investment minus depreciation, may be), whereas changes in inventories in the SAM may be positive or negative: roughly speaking, GFCF can be thought of as irreversible, while inventory accumulation is almost fully reversible. Endogenizing negative inventory changes is difficult to achieve satisfactorily in a CGE model. To avoid these complications, inventory changes are exogenous in PEP-1-1, fixed in volume. GFCF, on the contrary, is endogenous in the default closure of PEP-1-1, where total investment expenditure is determined by the savings-investment equilibrium constraint (equation 92), with savings endogenous. GFCF expenditure, obtained by subtracting the cost of changes in inventories from total investment expenditure (equation 54), is distributed among commodities in fixed shares (equation 55); implicitly, the production function of new
capital is Cobb-Douglas. So, for a given amount of investment expenditures, the quantity demanded of each commodity i for investment purposes is inversely related to its purchaser price. The same hypothesis is made regarding government current expenditures on goods and services (equation 56). With a given current expenditure budget, the quantity demanded of each commodity varies inversely with its price.
54. = −
∑
i i iVSTK PC IT GFCF 55. PCINV INVGFCF i i i =γ 56. PCiCGi =γiGVTG where :GFCF Gross fixed capital formation
:
i
INV Final demand of commodity i for investment purposes :
IT Total investment expenditures :
i
VSTK Inventory change of commodity i :
INV i
γ Share of commodity i in total investment expenditures :
i
CG Public consumption of commodity i (volume)
:
GVT i
γ Share of commodity i in total current public expenditures on goods and services
In addition to being required for final demand, goods and services are used as inputs in the production process. Intermediate demand for each commodity is the sum of industry demands.
57. =
∑
j i j i DI DIT , where : iDIT Total intermediate demand for commodity i
Finally, some services, such as transport and retail and wholesale trade, are used to move commodities and make them available to the market. So margin rates are applied to the volume of domestic production and imports to determine the quantities of these margin services required to distribute commodities to buyers (trade and transport margins are discussed in Appendix B3).
58. =
∑
+∑
+∑
x x X x i m im m ij iij ij i tmrg DD tmrg IM tmrg EXD MRGN , , , where : i4. PRODUCER SUPPLIES OF PRODUCTS AND INTERNATIONAL
TRADE
In this section, we define the trade relations with the rest of the world, that is, the supply of exports and the demand for imports. This is achieved through specifying domestic buyers’ behavior with respect to the different supply sources, and domestic producers’ supply behavior. The latter comprises two aspects: first, how composite output translates into the supply of products, and, second, how the supply of each product is directed to destination markets. The small-country hypothesis is adopted, in the sense that the world price of traded goods (imports and exports) is exogenous.
The section on production describes how industries combine inputs to produce total aggregate output
XSTj. Industries usually produce more than one product. The Leontief-style one-to-one correspondence between products and industries is a special case, and the 1993 System of National Accounts recommends constructing input-output tables in the rectangular format, where there are generally more goods than industries. If an industry’s aggregate output were simply the sum of its products, the profit-maximizing firm would concentrate all of its output on the product with the highest price. Here, however, it is assumed that, although an industry can reorganize its production to change the proportions of goods produced, the different products are not perfectly « transformable » into one another. This is represented by means of a constant elasticity of transformation (CET) function that describes how easily the product-mix can be adjusted in response to price changes (equation 59):
59. XT j XT j i ji XT i j XT j j B XS XST ρ ρ β 1 , , ⎥⎥ ⎦ ⎤ ⎢ ⎢ ⎣ ⎡ =
∑
where : ,i jXS Industry j production of commodity i
:
XT j
B Scale parameter (CET – total output) :
,
XT i j
β Share parameter (CET – total output) :
XT j
ρ Elasticity parameter (CET – total output) ; < XT <∞
j
ρ 1
Producers allocate output among products so as to maximize sales revenue, given product prices, subject to equation 59. Individual product supply functions (equation 60) are derived from the first-order conditions of revenue maximizing (Appendix C5).
60.
( )
XT j XT j j XT i j i j XT j j i j PT P B XST XS σ β σ ⎥ ⎥ ⎥ ⎦ ⎤ ⎢ ⎢ ⎢ ⎣ ⎡ = + , , , 1 where : ,i jP Basic price of industry j’s production of commodity i :
XT j
σ Elasticity of transformation (CET – total output) ; 0<σXTj <∞
In accordance with the algebra of the CET transformation function,
XT j XT j XT j σ σ ρ =1+ (Appendix C5).
Next, the output of every product of an industry is shared out among markets (domestic or export), again with the goal of maximizing the firm’s total revenue, given the demand in each market and the various taxes that apply. It is assumed that production directed to one market is somewhat different from production directed to another market. This imperfect substitutability is represented in PEP-1-1 by means of a constant elasticity of transformation (CET) aggregator function that describes how readily production can be redirected from one market to another.9
61.
(
)
X x j X x j X x j x j X x j x j X x j X x j x j B EX DS XS , 1 , , , , , , , , 1 ρ ρ ρ β β ⎥ ⎥ ⎦ ⎤ ⎢ ⎢ ⎣ ⎡ − + = where : ,i jDS Supply of commodity i by sector j to the domestic market
:
,
X x j
B Scale parameter (CET – exports and local sales) :
,
X x j
β Share parameter (CET – exports and local sales) :
,
X x j
ρ Elasticity parameter (CET – exports and local sales) ; 1<ρXj,x < ∞
Obviously, for products that are not exported to the world market, total output is simply equal to supply on the domestic market.
62. XSj,nx =DSj,nx
9 Equation 61 implies that there is a single trading partner, the « Rest-of-the-world ». It is left up to the modeler to adapt the model, whenever appropriate, to distinguish more than one trading partner.
CET aggregator function (equation 61) (Appendix C6). 63. x j x x X x j X x j x j DS PL PE EX X x j , , , , , 1 σ β β ⎥ ⎥ ⎦ ⎤ ⎢ ⎢ ⎣ ⎡ − = where : , X x j
σ Elasticity of transformation (CET – exports and local sales) ; 0<σXj,x <∞
In accordance with the algebra of the CET transformation function,
X x j X x j X x j , , , 1 σ σ ρ = + (Appendix C6).
To summarize, producers’ supply behavior is represented by nested CET functions: on the upper level, aggregate output is allocated to individual products; on the lower level, the supply of each product is distributed between the domestic market and exports.
Many CGE models presume that producers can always sell as much as they wish on the world market at the (exogenous) current price; we take a different view (and, in so doing, we depart from the « pure » form of the small-country hypothesis): equation 64 says that a local producer can increase his share of the world market only by offering a price that is advantageous relative to the (exogenous) world price PWXx. The ease with which his share can be increased depends on the degree of substitutability of the proposed product to competing products; in other words, it depends on the price-elasticity of export demand. Equation 64 also makes it possible to simulate an exogenous variation in world demand for the product, through a change in the variable .
FOB x PE O x EXD XD 64. x FOB x O x x PE PWX e EXD EXD σ ⎟ ⎟ ⎠ ⎞ ⎜ ⎜ ⎝ ⎛ = x where : x
EXD World demand for exports of product x
:
FOB x
PE FOB price of exported commodity x (in local currency)
:
x
PWX World price of exported product x (expressed in foreign currency)
:
XD x
Buyer behavior is symmetrical to producer behavior, in that it is assumed that local products are imperfect substitutes for imports, or, in other words, that goods are heterogenous with respect to their origin. So commodities demanded on the domestic market are composite goods, combinations of locally produced goods and imports. The imperfect substitutability between the two is represented by a constant elasticity of substitution (CES) aggregator function (equation 65).
65.
(
)
M m M m M m m M m m M m M m m B IM DD Q ρ ρ ρ β β 1 1 − − − ⎥ ⎥ ⎦ ⎤ ⎢ ⎢ ⎣ ⎡ − + = where : mQ Quantity demanded of importable composite commodity m
:
M m
B Scale parameter (CES – composite commodity)
:
M m
β Share parameter (CES – composite commodity)
:
M m
ρ Elasticity parameter (CES – composite commodity); − < M <∞
m
ρ 1
Naturally, for goods with no competition from imports, the demand for the composite commodity is the demand for the domestically produced good.
66. Qnm = DDnm
Just as sellers seek to maximize revenue, buyers minimize expenses, subject to the CES aggregation function (equation 65). Relative demand functions derive from the first-order optimum conditions (Appendix C7). 67. m m m M m M m m DD PM PD IM M m σ β β ⎥ ⎥ ⎦ ⎤ ⎢ ⎢ ⎣ ⎡ − = 1 where : m
PD Price of local product m sold on the domestic market (including all taxes and margins) :
m
PM Price of imported product m (including all taxes and margins) :
M m
σ Elasticity of substitution (CES – composite commodity); 0<σmM <∞
In accordance with the algebra of CES aggregator functions,
M m M m M m σ σ ρ =1− (Appendix C7).
is implicit. According to the small-country hypothesis, the price-elasticity of import supply is assumed to be infinite at the going world price: this is what is implied by fixing the world price of imports as exogenous in equation 82 below.
5. PRICES
5.1 Production
The different prices and price indexes naturally depend on the hypotheses and functional forms already stated. In aggregations, the price of an aggregate is a weighted sum of the prices of its components. The weights are determined by equating the value of the aggregate to the sum of the values of its components, given the quantity of the aggregate (which is determined from the aggregator function). The weight assigned the price of each component is therefore the ratio of its volume (or quantity) to the volume (or quantity) of the aggregate10. Only in Leontief fixed-proportions aggregations are the weights invariant to
relative price changes; in other cases, component proportions, and, consequently, component price weights, change in response to relative price changes, and they change more or less sharply, depending on the elasticity of substitution or transformation. For instance, the unit cost of an industry’s output (including taxes directly related to the use of capital and labor, but excluding other taxes on production) is a weighted sum of the prices of value added and aggregate intermediate consumption (equation 68).
68. j j j j j j XST CI PCI VA PVA PP + =
Here, the weights are VAj XSTj and CIj XSTj. Multiplying both sides of equation 68 by XSTj yields the value accounting identity
j j j j j jXST PVA VA PCI CI
PP = + . The same principle applies to the prices
of other aggregates. The price of aggregate intermediate consumption is a combination of the commodity prices of the industry’s intermediate inputs (equation 70), just as the price of value added is a combination of the prices of composite labor and composite capital (equation 71). So is it with the prices of composite factors. The price of an industry’s composite labor is a weighted sum of the wage rates (including payroll taxes) of the different categories of labor used by that industry (equation 72). In the same way, the price of an industry’s composite capital is a weighted sum of the rental rates of the different types of capital used by that industry (equation 74).
Since various forms of taxation appear in the model, it is necessary to define the relationship between prices before taxes, and prices including taxes. The basic price of production (for a definition of « basic
10 Note that, in general, the weights do not add up to 1. An alternative, mathematically equivalent, modeling approach would have been to determine aggregate prices from the cost (or value) functions dual to the aggregation functions, and then to compute the quantity indexes of the aggregates from the identities between the value of an aggregate and the sum of its components’ values.
on labor or capital, already included in the unit cost) (equation 69). Likewise, wages paid by industry differ from wages received by workers by the amount of payroll taxes (equation 73). The same applies to the rental rate of capital (equation 75). The principles of price aggregation and tax accounting yield the following price equations, in addition to equation 68, stated earlier.
69.
(
)
j j j ttip PP PT = 1+ 70. j i i i j j CI DI PC PCI∑
= , 71. j j j j j j VA KDC RC LDC WC PVA + = 72. j l l j l j j LDC LD WTI WC∑
= , , 73.(
)
j l l j l W ttiw WTI , , = 1+ 74. j k k j k j j KDC KD RTI RC∑
= , , 75. RTIk,j = Rk,j(
1+ttikk,j)
where : jPT Basic price of industry j’s output :
j
PCI Intermediate consumption price index of industry j
Finally, the rental rate received by the owners of capital, Rk,j, is determined in one of two manners, depending on the option selected by the user regarding the mobility of capital. In PEP-1-1, parameter
kmob acts as a switch. If kmob = 1, capital is assumed to be perfectly mobile, and the aggregate supply of type k capital KSk is exogenous, fixed at its initial SAM value, so the use of capital by the industries is constrained by the supply-demand equilibrium condition (equation 91). In that case, the allocation of capital between industries is the result of the arbitrage process that makes the rental rate received by owners equal across industries (equation 76). If kmob = 0, capital is assumed to be industry-specific, equation 76 is not in effect, the KDk,j are exogenous, fixed at their initial SAM values, and rents paid on the use of capital are Ricardian rents.
76. Rk,j = RKk, if capital is mobile
where :
k
RK Rental rate of type k capital (if capital is mobile)
5.2 International trade
Exporting industries have the possibility of selling their output on the international market or the domestic market. So the price of their aggregate production is a weighted sum of the price obtained on each market, following the price aggregation principle. The weight assigned to each market is proportional to the quantity sold on that market (equation 77); these weights vary in response to relative price changes, more or less sharply, depending on the elasticity of transformation in the CET. The basic price (for a definition, see Appendix B2) obtained by industry j for exportable product x is a weighted sum of its basic price on the domestic market and its basic price on the export market (equation 78). The FOB price paid by purchasers on the export market is different from the one received by the producer, since margins and export taxes must be added on (equation 80). And of course, for products not exported by an industry, the price obtained is the domestic market price (equation 79).
77. j i i j i j j XST XS P PT
∑
= , , 78. x j x j x x j x x j XS DS PL EX PE P , , , , + = 79. Pj,nx = PLnx 80.(
x)
xFOB i X x i i x PC tmrg ttix PE PE ⎟⎟ + = ⎠ ⎞ ⎜⎜ ⎝ ⎛ +∑
, 1As was previously explained, commodities purchased on the domestic market are composites. For goods facing import competition, the price of the composite is a weighted sum of the price paid for domestically produced, and imported goods (equation 83). The price paid for the local product is the sum of the price received by the producer, margins, and indirect taxes (equation 81). Similarly, the price paid for the imported product is the world price, translated into the local currency, plus taxes and duties on imports, margins, and domestic indirect taxes (equation 82). The price of commodities for which there is no competing import is simply the price paid for the local product (equation 84).
81.
(
)
⎟⎟ ⎠ ⎜ ⎜ ⎝ + + =∑
ij i iji i i i ttic PL PC tmrg PD , 1 82.(
) (
)
⎟⎟ ⎠ ⎞ ⎜⎜ ⎝ ⎛ + + + =∑
i i im m m m m ttic ttim ePWM PC tmrg PM , 1 1 83. m m m m m m Q DD PD IM PM PC = + 84. nm nm PD PC =5.3 Price indexes
Finally, four price indexes have been defined: the GDP deflator (equation 85), the consumer price index (equation 86), the investment price index (equation 87), and the public expenditures price index (equation 88). The first is a Fisher index, the second is a Laspeyres index, and the third and fourth are exact price indexes, dual to the Cobb-Douglas functions which describe commodity demand for investment purposes and for public consumption (Appendix C8).
85.
∑
∑
∑
∑
= j j j j j j j j j j j j VA PVAO VA PVA VAO PVAO VAO PVA PIXGDP 86.∑
∑
∑
∑
= ij ij h ijh i i h ih C PC C PC PIXCON 0 , 0 0 , 87.∏
⎟⎟ ⎠ ⎞ ⎜ ⎜ ⎝ ⎛ = i i i INV i PC PC PIXINV γ 0 88.∏
⎟⎟ ⎠ ⎞ ⎜ ⎜ ⎝ ⎛ = i i i GVT i PC PC PIXGVT γ 0 where : PIXGDP GDP deflator :PIXGVT Public expenditures price index
:
6. EQUILIBRIUM
Whether it be for the goods and services market or the factor market, supply and demand equilibrium must be verified. Thus, equation 89 defines the equilibrium between the supply and demand of each commodity on the domestic market. Equations 90 and 91 ensure the equilibrium between total demand for each factor and available supply. Likewise, total investment expenditure must be equal to the sum of agents’ savings (equation 92). The sum of supplies of every commodity by local producers must be equal to domestic demand for that commodity produced locally (equation 93). And finally, supply to the export market of each good must be matched by demand (equation 94).
89. i i i i i h ih i C CG INV VSTK DIT MRGN Q =
∑
, + + + + + 90. l j l j LS LD =∑
, 91. k j k j KS KD =∑
, 92. IT SH SF SG SROW f f h h + + + =∑
∑
93. i j ji DD DS =∑
, 94. x j jx EXD EX =∑
, where : lLS Supply of type l labor
:
k
7. GROSS DOMESTIC PRODUCT
GDP at basic prices is equal to payments made to factors, plus taxes on production other than taxes on labor or capital already included in factor costs (equation 95). On the other hand, GDP at market prices from the final demand perspective is the sum of net final expenditures: household consumption, current public expenditures on goods and services, investment expenditures, plus the value of exports, minus the value of imports (equation 98). As for GDP at market prices from the income perspective (equation 97), it is equal to the sum total of income paid to labor and to capital, plus taxes on products and imports (TPRCTS – equation 30), plus other taxes on production (TPRODN – equation 26). GDP at market prices exceeds GDP at basic prices by exactly the amount of taxes on products and imports (TPRCTS). For a
discussion of GDP concepts according to the SNA93, see Appendix B4.
95. GDP PVAVA TIPT j j j BP =
∑
+ 96. GDPMP =GDPBP+TPRCTS 97. GDP W LD R KD TPRODN TPRCTS j k k j k j j l l l j IB =∑
+∑
+ + , , , , , 98.∑
∑
⎥+∑
−∑
⎦ ⎤ ⎢ ⎣ ⎡ + + + = m m m x x FOB x i i h ih i i i FD PC C CG INV VSTK PE EXD e PWM IM GDP , where : BP GDP GDP at basic prices : FDGDP GDP at purchasers’ prices from the perspective of final demand :
IB
GDP GDP at market prices (income-based) :
MP
REFERENCES
DECALUWÉ, Bernard, André LEMELIN, David BAHAN (2006) « Oferta endógena de trabajo y capital parcialmente móvil en un MEGC birregional: Versión estática del modelo de equilibrio general computable del Ministerio de Hacienda de Québec », Investigación Económica, 258, octubre-diciembre.
DECALUWÉ, Bernard, André LEMELIN, David BAHAN et Nabil ANNABI (2005) « Offre de travail endogène et mobilité du capital dans un MEGC bi-régional: la version statique du modèle d’équilibre général calculable du Ministère des Finances du Québec », texte d'une conférence donnée à Séville, lors de l'atelier international The State-of-the-Art in Regional Modeling, 21-23 octobre 2004, co-organisé par le Global Economic Modeling Network (ECOMOD) et la Fundación Centro de Estudio Andaluces (centrA), Ministère des Finances du Québec, collection Feuille d’argent, Travaux de recherche 2005-001, 62 pages.
http://www.finances.gouv.qc.ca/documents/feuille/fr/2005_001.pdf
DECALUWÉ, Bernard, André LEMELIN, Véronique ROBICHAUD, David BAHAN, et Daniel FLOREA (2004). « Le modèle d'équilibre général calculable du ministère des Finances, de l'Économie et de la recherche du Québec: un modèle bi-régional du Québec et du Reste-du-Canada », chapitre 14, p. 285-297 dans CLOUTIER, L. Martin et Christian DEBRESSON, avec la collaboration d'Érik DIETZENBACHER, Changement climatique, flux technologiques, financiers et commerciaux –
nouvelles directions d'analyse entrée-sortie, Actes de la Quatorzième Conférence internationale de
techniques d'analyse entrée-sortie, tenue à Montréal, 10-15 octobre 2002, Presses de l'Université du Québec.
DECALUWÉ, Bernard, André LEMELIN, Véronique ROBICHAUD et David BAHAN (2003). Modèle
d'équilibre général du ministère des Finances du Québec (MEGFQ): caractéristiques et structure du modèle, ministère des Finances du Québec, Collection Feuille d'argent, Travaux de recherche
2003-002
http://www.finances.gouv.qc.ca/documents/feuille/fr/2003_002.pdf
Disponible en version anglaise sous le titre: General equilibrium model of the ministère des Finances
du Québec (GEMFQ): Characteristics and structure of the model
http://www.finances.gouv.qc.ca/documents/Feuille/en/2003_002_eng.pdf
DECALUWÉ, B., A. MARTENS et L. SAVARD (2001). La politique économique du développement et
les modèles d'équilibre général calculable, Les Presses de l'Université de Montréal, Montréal.
INTER-SECRETARIAT WORKING GROUP ON NATIONAL ACCOUNTS (1993). « System of National Accounts 1993 (SNA93) », Eurostat, International Monetary Fund, OECD, United Nations, World Bank; Bruxelles-Luxembourg, New York, Paris, Washington (D.C.), 711 p.
APPENDIX A: EQUATIONS, SETS, VARIABLES AND PARAMETERS
A1. Equations
A1.1PRODUCTION 1. VAj = vjXSTj 2. CIj =iojXSTj 3.(
)
VA j VA j VA j j VA j j VA j VA j j B LDC KDC VA ρ ρ ρ β β 1 1 − − − ⎥ ⎥ ⎦ ⎤ ⎢ ⎢ ⎣ ⎡ − + = 4. j j j VA j VA j j KDC WC RC LDC VA j σ β β ⎥ ⎥ ⎦ ⎤ ⎢ ⎢ ⎣ ⎡ − = 1 5. LD j LD j l l j LD j l LD j j B LD LDC ρ ρ β 1 , , − − ⎥ ⎥ ⎦ ⎤ ⎢ ⎢ ⎣ ⎡ =∑
6.( )
j LD j j l j LD j l j l B LDC WTI WC LD LD j LD j 1 , , , − ⎥ ⎥ ⎦ ⎤ ⎢ ⎢ ⎣ ⎡ = σ σ β 7. KD j KD j k k j KD j k KD j j B KD KDC ρ ρ β 1 , , − − ⎥ ⎥ ⎦ ⎤ ⎢ ⎢ ⎣ ⎡ =∑
8.( )
j KD j j k j KD j k j k B KDC RTI RC KD KD j KD j 1 , , , − ⎥ ⎥ ⎦ ⎤ ⎢ ⎢ ⎣ ⎡ = σ σ β 9. j j i j i aij CI DI, = ,A1.2INCOME AND SAVINGS
A1.2.1 Households
10. YHh =YHLh+YHKh +YHTRh
11.
∑
∑
⎟⎟ ⎠ ⎞ ⎜ ⎜ ⎝ ⎛ = l j j l l WL l h h W LD YHL λ , , 12.∑
∑
⎟⎟ ⎠ ⎞ ⎜ ⎜ ⎝ ⎛ = k j j k j k RK k h h R KD YHK λ , , , 13. =∑
ag hag h TR YHTR , 14. h gvt h h h YH TDH TR YDH , − − = 15. = − −∑
agng agngh h h h YDH SH TR CTH , 16. SHh = PIXCONηsh0h+sh1hYDHh A1.2.2 Firms 17. f f f YFK YFTR YF = + 18.∑
∑
⎟⎟ ⎠ ⎞ ⎜ ⎜ ⎝ ⎛ = k j j k j k RK k f f R KD YFK λ , , , 19. =∑
ag f ag f TR YFTR , 20. f f f YF TDF YDF = − 21. = −∑
ag ag f f f YDF TR SF , A1.2.3 Government22. YG=YGK+TDHT+TDFT+TPRODN+TPRCTS+YGTR
23.