HAL Id: cea-01366727
https://hal-cea.archives-ouvertes.fr/cea-01366727
Submitted on 15 Sep 2016
HAL is a multi-disciplinary open access
archive for the deposit and dissemination of
sci-entific research documents, whether they are
pub-lished or not. The documents may come from
teaching and research institutions in France or
abroad, or from public or private research centers.
L’archive ouverte pluridisciplinaire HAL, est
destinée au dépôt et à la diffusion de documents
scientifiques de niveau recherche, publiés ou non,
émanant des établissements d’enseignement et de
recherche français ou étrangers, des laboratoires
publics ou privés.
Thermoelectric energy recovery at ionic-liquid/electrode
interface
Marco Bonetti, Sawako Nakamae, Bo Tao Huang, Thomas J. Salez, Cécile
Wiertel-Gasquet, Michel Roger
To cite this version:
Marco Bonetti, Sawako Nakamae, Bo Tao Huang, Thomas J. Salez, Cécile Wiertel-Gasquet, et al..
Thermoelectric energy recovery at ionic-liquid/electrode interface. Journal of Chemical Physics,
Amer-ican Institute of Physics, 2015, �10.1063/1.4923199�. �cea-01366727�
Marco Bonetti,1 Sawako Nakamae,1 Bo Tao Huang,1 Thomas J. Salez,2, 1 C´ecile Wiertel-Gasquet,1 and Michel Roger1
1)Service de Physique de l’Etat Condens´e, CEA-IRAMIS-SPEC, CNRS-UMR 3680, CEA Saclay,
F-91191 Gif-sur-Yvette Cedex, France
2)´
Ecole des Ponts ParisTech, 6 et 8 avenue Blaise Pascal, Champs-sur-Marne F-77455 Marne-la-Vall´ee, France
(Dated: (23 June 2015))
A Thermally Chargeable Capacitor containing a binary solution of 1-ethyl-3-methylimidazolium bis(trifluoromethylsulfonyl)-imide (EMIMTFSI) in acetonitrile is electrically charged by applying a tempera-ture gradient to two ideally polarisable electrodes. The corresponding thermoelectric coefficient is -1.7 mV/K for platinum foil electrodes and -0.3 mV/K for nanoporous carbon electrodes. Stored electrical energy is extracted by discharging the capacitor through a resistor. The measured capacitance of the electrode/ionic-liquid interface is 5 µF for each platinum electrode while it becomes four orders of magnitude larger ≈ 36 mF for a single nanoporous carbon electrode. Reproducibility of the effect through repeated charging-discharging cycles under a steady-state temperature gradient demonstrates the robustness of the electrical charging pro-cess at the liquid/electrode interface. The acceleration of the charging by convective flows is also observed. This offers the possibility to convert waste-heat into electric energy without exchanging electrons between ions and electrodes, in contrast to what occurs in most thermogalvanic cells.
I. INTRODUCTION
Conversion of low-grade waste heat (typically at tem-peratures < 200o C) into electrical energy has become
a topical challenge in energy research of the 21st cen-tury. For example, solid state thermoelectric converters are attracting attention as promising devices for portable generators.1 An alternative to solid-state thermoelectric
generators can be found in thermogalvanic cells contain-ing an electrolyte and a redox couple2–15 where the dif-ference in the redox potentials (reaction entropies) at two electrodes under a thermal gradient can be used to generate electricity. In thermogalvanic cells, ions circu-late inside the cell and exchange electrons with the elec-trodes. Presently, high thermogalvanic coefficient values are found in ionic-liquid/organic solvent mixtures16 us-ing various inorganic and organic redox couples.9–11The
redox reaction can also take place inside electrodes via insertion/deintercalation of ions, e.g. lithium in an inter-calated compound like LixV2O5, leading to a thermally
rechargeable battery.17
It has recently been proven by Qiao’s group18–21 that the thermocells can also be conceived with pure elec-trolytes (without redox couples) that operate with ide-ally polarizable electrodes with no exchange of electrons between electrodes and the electrolyte ions. In their ex-periments, platinum and nanoporous carbon electrodes were immersed in a cell made of two compartments main-tained at different temperatures and electrically con-nected through a salt bridge. In this case, no electri-cal current flows inside the cell and thus the thermocell operates by a pure capacitive process at the electrodes. Therefore the cell operates as a “Thermally Chargeable Capacitor” (TCC). The thermoelectric potential is then due to the internal electric field22generated by the
ther-mal drift of ions (Soret effect) in the electrolyte and
the temperature dependence of the surface potential at the liquid/electrode interfaces. At the contact with elec-trodes, ions lose a part of their solvation layers and their entropy is modified. The corresponding thermoelectric potentials for aqueous solutions of alcaline salts have been compared in Ref. 20. The electrical energy stored in the form of accumulated charge at the electrode in-terfaces can be subsequently recovered by ’discharging’ through an external load.
In this paper, we extend the work of Qiao’s group20,21 to the interface between ideally polarisable electrodes and an ionic liquid. Ionic liquids (IL) have a low melting tem-perature close to room temtem-perature unlike most molten salts, a relatively high decomposition temperature16,23 and a large electrochemical window.24 They can oper-ate on a wide temperature range 0–200oC, suitable for
low-grade waste heat recovery applications.
The IL/metal electrodes interface is known to be complex, extending over 4–8 layers, giving rise to a vast literature (for a short review on this subject see e.g. Ref. 25). IL’s large ions can be adsorbed on a metal surface in multiple configurations.26 Such
conformational changes are accompanied by a partial loss of entropy from the bulk state, possibly result-ing in a large temperature-dependent surface poten-tial. Here, we have chosen the binary mixture 1-ethyl-3-methylimidazolium bis(trifluoromethylsulfonyl)-imide (EMIMTFSI, 391.3 g/mole), diluted to 2M in ace-tonitrile (AN). This concentration gives a weak maxi-mum of the Seebeck coefficient and the highest ionic con-ductivity σ(40oC)= (57.3±0.5) mS cm−1among different
organic solvents.27
To estimate the electrical energy stored in the TCC under a temperature gradient, we have performed dis-charge potential measurements by connecting the elec-trodes to an external resistive load. Bare platinum foil electrodes were first used as a model system which has
2
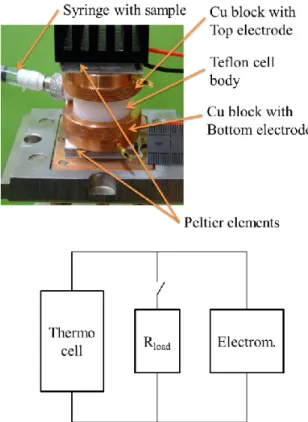
FIG. 1. Top:Thermally Chargeable Capacitor. Two copper blocks screwed onto the Teflon cell body press the platinum foil electrodes against two O-rings to achieve sealing. The copper blocks are electrically in contact with the electrodes and are thermally regulated by means of Peltier elements. The electrodes are connected to an electrometer for open-circuit potential measurement, or to a resistive load via a switch-box to discharge the cell. The cell is 25 mm in height and 35 mm in diameter. Notice the syringe that is used to fill the cell and allows the fluid to expand when the cell is heated. Bottom: corresponding electrical circuit (see text for explanations).
been extensively studied both experimentally and theo-retically. Repeated cycles of charge/discharge under a constant temperature gradient show that the charging of the IL/electrode interface layer is a robust process. The same experiments were then repeated with platinum-foil electrodes covered with a thin sheet of nanoporous car-bon, which increases the electrode capacitance by four orders of magnitude, a necessary condition for heat to electrical energy conversion applications.
II. EXPERIMENTAL SETUP
The experimental setup (TCC geometry) is different from that of Lim et al.20 Rather than two horizontally connected compartments held at different temperatures, here the differential potential measurements were carried
out in a single-volume vertical cell with a φ = 6 mm di-ameter sample cavity machined out from a solid Teflon cylinder closed by two symmetrical 10 mm diameter plat-inum foil electrodes of 100 µm thickness (99.99 % pure, Sigma-Aldrich). (A complete view of the cell assembly is shown in Figure 1.). Our geometry is thus similar to that corresponding to usual supercapacitors. The Pt electrode surface is wet polished with a diamond paste with particle sizes reduced from 9 to 1 µm, subsequently cleaned in an ultrasonic bath with acetone or acetonitrile and rinsed in ultrapure water and then vacuum dried. Additional cleaning by immersion of the electrodes in a concentrated HCl (36%wt) solution for many hours and ultrasonication in ultrapure water did not have any effect on the measured thermoelectric potential. The electrode surface in contact with the liquid is A ≈ 0.28 cm2 and
the distance between the electrodes is l = 6 mm. Two 10 mm thick copper blocks are screwed onto the cell body, thereby squeezing the Pt electrodes hermetically against the Teflon cylinder (the sample volume is 0.17 cm3). To investigate the influence of the effective
elec-trode surface, a thin sheet of nanoporous carbon (Nan-oTuneX Y-Carbon) with ≈20 nm average pore diameter was sandwitched between the platinum foil and the cell body. The electrodes are electrically and thermally in contact with the top and bottom copper blocks which ensures a fast heat transfer to and from the liquid mix-ture. The temperature of the Cu blocks is monitored by 100 Ω-platinum resistance thermometers and regu-lated by a temperature controller (LakeShore 340) that finely adjusts the output power of two Peltier elements with lapped alumina surface of 30x30 mm2. The thermal
stability of both Cu blocks, δT, is less than 2 mK over many hours. The natural convection of the liquid mix-ture can be either minimized; by heating only the top Cu-block while keeping the bottom Cu-block at 30 oC,
or maximized; by reversing the heating direction. The maximum allowed temperature difference is ≈ 60oC, cor-responding to a temperature gradient across the cell body ≈ 65 K cm−1. The sample liquid filling is achieved by
injection through a small radial hole in the cylindrical cavity using a syringe. The syringe is left in place so that overfilling of the cell when the two Cu blocks are screwed together or the thermal expansion of the fluid during the measurements is compensated by the displacement of the piston inside the syringe. The electric conductivity of the sample was also measured using the same cell. The ionic liquid (EMIMTFSI, 98% purity, Sigma-Aldrich) and ace-tonitrile (99.8% purity, Sigma-Aldrich) were used as re-ceived without further purification. The TCC is filled with a solution of 2M EMIMTFSI in AN. The water con-tent was less than 0.05% w/w (Karl-Fisher).
The entire cell is electrically floating with respect to the Peltier elements and is placed in a Faraday cage. The thermoelectric open-circuit potential (during charg-ing) and the discharge potential between the electrodes are measured by a high impedance electrometer with a 1014 Ω input resistance (Keithley K-6514). Discharging
is achieved via a manual switch that connects instanta-neously the cell electrodes to an external resistive load that ranges between 1.5 kΩ to 100 MΩ. The electrical circuit corresponding to the measurement setup is pre-sented in Figure 1 (bottom panel).
III. EXPERIMENTAL RESULTS WITH PLATINUM-FOIL ELECTRODES
III.1. Thermoelectric coefficient
The open circuit potential ∆V between the hot and cold electrodes (no current flow) is proportional to the temperature difference ∆T between the two electrodes:
∆V = −Λ∆T. (1)
Λ represents the thermoelectric coefficient. ∆V can be split into three contributions:
∆V = φH− Eintl − φC (2)
where φH and φC represent the interface electrostatic
potentials at the hot and cold electrodes, l is the electrode separation and Eintis a uniform Seebeck internal electric
field resulting from the thermal drift of ions:
Eint= Se∇T. (3)
Se represents the Seebeck coefficient. φH and φC
are the results of IL anions and cations adsorbed at the metal interfaces. Such adsorption effects have been observed by scanning tunelling microscopy,26,28 atomic force microscopy,29 angle-resolved X-ray pho-toelectron spectroscopy,30 electrochemical impedance
spectroscopy.31,32 The temperature dependence of the
structure of an IL/metal interface has also been evi-denced in Ref. 29, 31, and 32, which implies that the interface potential φ depends on temperature as well. For small temperature variations, we can write:
φH− φC= dφ dT∆T (4) and we have: Λ = Se− dφ dT (5)
We expect the second term in Eq. (5) to be particularly important in the case of large-ion adsorption since dφ/dT depends on ∆Sconf/e, where ∆Sconf is the change in
configurational entropy of adsorbed ions.22,40
For monovalent ions, the Seebeck coefficient of an elec-trolyte at initial state, i.e. when a temperature gradi-ent is applied while the ion concgradi-entration is still uniform throughout the cell, is:22
Seinit= (t+Sb+− t−Sb−)/e (6)
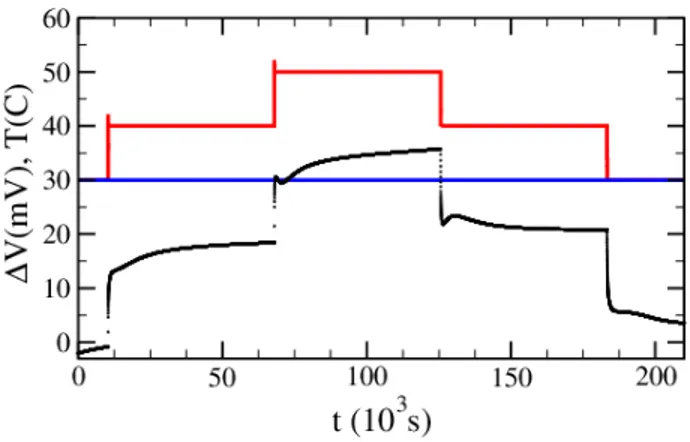
FIG. 2. Thermoelectric potential ∆V (black line) for a so-lution of EMIMTFSI (2M) in acetonitrile when the temper-ature of the top electrode (red line) is changed by a 10oC
step between 30oC and 50oC. The temperature of the bottom electrode (blue line) is maintained at 30oC.
where bS+, bS− are the Eastman entropies of transfer of
cations and anions and t+, t− the corresponding Hittorf
transport numbers. When ions have moved to establish a Soret steady-state, in an open circuit condition, we have:22,33
Sest= ( bS+− bS−)/(2e) (7) A typical time evolution of ∆V when the temperature of the hot electrode is heated from 30oC to 50oC by 10oC
steps, while the cold electrode is maintained at 30oC is shown in Figure 2. A nice reversibility is observed when cooling the hot electrode back to 30oC. An average value
ΛP t≈ −1.7 mV K−1 is deduced from the measurement.
The time evolution of ∆V corresponding to the first heat-ing cycle is zoomed in Figure 3. This evolution is gov-erned by the Soret diffusion of IL ions through the cell which, in one dimension, leads to:34,35
∆V (t) − ∆V (0) = (∆V (∞) − ∆V (0)) × h 1 − 8 π2 P n odd exp(−n2t/θ) n2 i (8) where θ = l2/(π2D) is the characteristic time of diffusion
with D representing the diffusion coefficient of cations. For t > θ only the lowest order term in the sum of expo-nential terms is significant.
The experimental data at t > 10000 s (Figure 3) have been fit to Eq. (8). An additional linear term correspond-ing to an instrumental drift of 74 µV/hour was also taken in account. The characteristic time θ is ≈ 10620 s ≈ 3 hours from which we estimate D ≈ 3.4 × 10⁻¹⁰ m2s−1. This value is three times higher than the value deduced from nuclear magnetic resonance measurements in pure EMIMTFSI at room temperature.36 Such an increase
in D is in agreement with the numerical simulations37
that predict a 4-fold boost in the diffusion coefficient of 2M EMIMBF4 diluted in acetonitrile. In Figure 3, the red dashed line represents the extrapolation of the full
4 Eq. (8) down to t = 0. Note that the time required for
the onset of a uniform temperature gradient is 5 to 10 mn, which explains the deviation from Eq. (8) at t < 1000 s.
III.2. TCC charging and discharging
Discharging of the TCC is obtained by connecting the two electrodes to an external resistive load (R≈ 6– 100 MΩ) much larger than the internal resistance of the liquid sample (37 Ω at 40oC). The experimental
proce-dure for charging/discharging measurements is described as follows:
1. Initial discharge: The cell is completely discharged
FIG. 3. Zoom on the first step in Figure 2 (solid black line). The red dashed line is a fit through Eq. (8).
FIG. 4. Charge/discharge potential of the TCC with Pt foil electrodes as a function of time. At time t = 0, the TCC is completely discharged and charging potential is measured in open circuit (cell connected to the electrometer alone) dur-ing 19 hours up to a steady-state value. Discharged is then accomplished by connecting the electrodes to a 20 MΩ resis-tor. During the whole process the top and bottom electrode are maintained at 50oC and 30oC respectively. The dashed red line is fit to a sum of two exponentials with characteristic times α = 790 s and θ = 10600 s.
through a low value resistor.
2. Charging phase: At an experimentally defined t = 0, the cell is put in open circuit (disconnected from the resistive load). From t = 0 to t ≈ 19 hours we observe an increase of the open-circuit poten-tial ∆V from 0 to a steady value of ≈ 45 mV (see Figure 4, charging phase). At this stage, the TCC is considered to be fully charged. ∆V (t) can be fit by the sum of two exponential terms with characteristic times α = 790 s ≈ 13 min and θ = 10600 s ≈ 3 hours. θ is close to the time-scale corresponding to the ion diffusion through the cell (see previous subsection).
3. Discharging phase: The electrodes are then con-nected to an external resistive load (20 MΩ for the measurement shown in Figure 4). The potential ∆V drops rapidly to a low value ≈ 2 mV.
Note that a steady-state temperature gradient between the top (50oC) and the bottom (30oC) electrode is main-tained throughout the measurements.
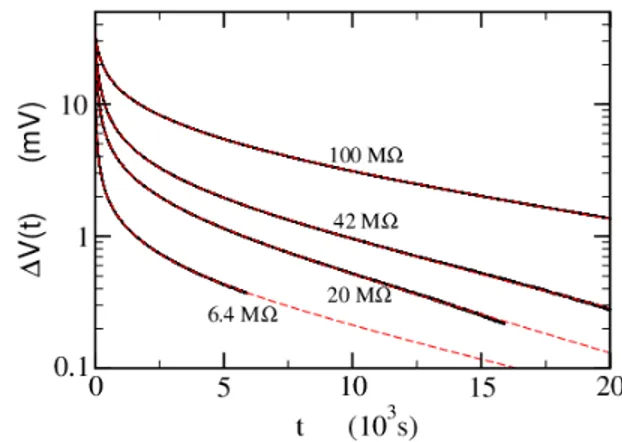
Similar charge/discharge curves are obtained with the resistive loads R = 6.4, 42 and 100 MΩ. The discharge potentials are reported in a semi-log plot in Figure 5. As can be seen from the figure, the semi-logarithmic plots of ln ∆V (t) are not linear, thus a rational fraction con-taining two time constants was used to fit the data. The time constants τ and θ characterize respectively the fast (discharging) and slow (thermodiffusion) processes:
− t + at
2+ bt3
τ + ct + θbt2 (9)
The long time-scale constant θ ≈ 3±1 hours is roughly independent of the resistive load. It is comparable to the diffusion time of ions through the cell and may be due
FIG. 5. Discharge potential through different loads from 6.4 to 100 MΩ. Solid black lines: experimental data. Red dashed lines: fits using Eq. (9). TCC with Pt-foil electrodes, filled with EMIMTFSI (2M) in acetonitrile. A small instrumental offset at large t has been subtracted from the experimental data.
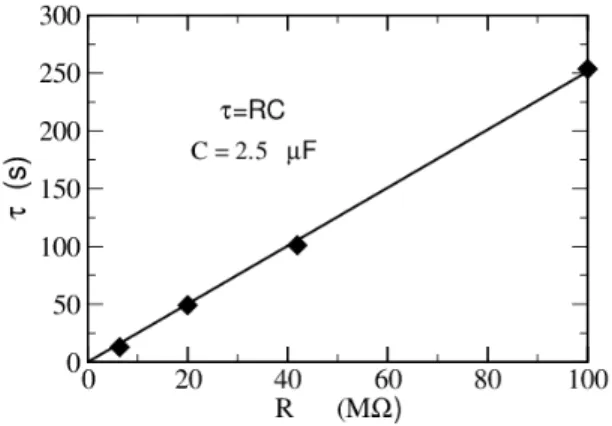
FIG. 6. Short relaxation time τ corresponding to different resistive loads R = 6.4, 20, 42 and 100 MΩ.
to the readjustment of the ion concentration gradient in the bulk to satisfy the new steady-state boundary con-ditions corresponding to equipotential electrodes rather than open-circuit potential electrodes.
The corresponding values of the short relaxation time τ are reported as a function of the load resistance R in Figure 6. As seen from the graph, τ is propor-tional to R, from which one can extract capacitance C = τ /R ≈ 2.5 µF.Assuming identical electrodes, this corresponds to the capacitance of two electrode/ionic-liquid interfaces in series (see section IV). The capac-itance of a single electrode is thus CP t = 5 µF,
giv-ing per surface area CP t/A = 18µF/cm2. This value
is of the same order of magnitude as the differential ca-pacitance obtained through electrochemical impedance spectroscopy at the interface of similar ILs with noble-metal electrodes, e.g. ≈ 4 µFcm−2 with
1-buthyl-3-methylimidazolium hexafluorophosphate (BMIMPF6) on platinum electrodes,31 and ≈ 6 − 8 µFcm−2
with 1-ethyl-3-methylimidazolium tris(pentafluoroethyl)-trifluorophosphate (EMIMFAP) on gold electrodes.38
This indicates that the short relaxation time τ is indeed related to the fast rearrangement of the ions at the liq-uid/solid interface, while negligible current flows through the bulk sample.
From the discharge potential the current flowing through the resistive load can be calculated. The time in-tegration of the electric current gives an estimate on the total charge Q accumulated in the electrodes. Figure 7 shows an almost constant value of the charge Q ≈ 1 µC for all R, corresponding to a charge density (Q/A) of ≈ 3 µC cm−2.
III.3. Charge/Discharge cycling at constant temperature gradient
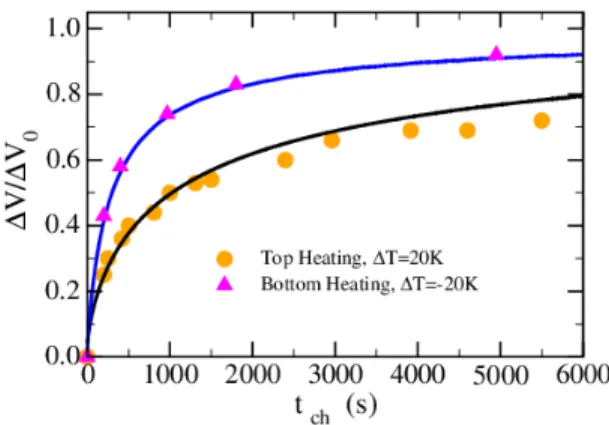
To test the recharging capability of the TCC, we have performed many charge/discharge cycles with progres-sively increasing charging time tch under a steady-state
temperature gradient (see Figure 8). A 20 MΩ resis-tive load was used for discharging. Here, we have in-tentionally stopped charging/discharging before reach-ing the stationary states. Figure 9 shows the normal-ized differential potential ∆V /∆V0 as a function of tch,
where ∆V0 is the stationary differential potential
mea-sured when the electric layer is fully charged. Two sets of data are represented. The circles are obtained for pure diffusive heat flow when the temperature of the top elec-trode is heated to 50oC and the bottom is maintained
close to room temperature (30oC). The triangles are ob-tained when an internal convective flow settles in the cell heated from the bottom with the same temperature dif-ference.
When heated from the bottom, the onset of convective flow occurs at a critical Rayleigh number Rac≈ 1700.39
FIG. 7. Charge Q accumulated in the IL/Pt-electrode inter-face as a function of the resistive load R.
FIG. 8. Charging and discharging cycles of the TCC with Pt-foil electrodes, filled with 2 M EMIMTFSI in acetonitrile. Charging: curve AB. Discharging: curve BC. The time du-ration (tB − tA) of charging is progressively increased.
Dis-charging is made over a 20MΩ resistive load. Steady-state temperature difference is 20K. Heating is from the top elec-trode; heat flow is purely diffusive.
6
FIG. 9. Normalized charging potential ∆V /∆V0 as a
func-tion of time tch. Filled circles: Heating on the top electrode;
pure diffusive heat flow. Filled triangles: Heating from the bottom electrode; convective heat flow. In both experiments, the steady-state temperature difference is 20 K. Full lines: Continuously time-recorded charging potential starting from a completely discharged cell and ending to the full charged state.
For pure EMIMTFSI using the current cell geometry and ∆T = 20 K between the electrodes, Ra ≈ 20 × 103 well above the critical value. In our less viscous binary so-lution, this value is expected to be even higher. Con-sequently, heat transfer across the bottom and top elec-trodes is dominated by an almost turbulent convective heat flow rather than pure heat conduction through a stationary liquid.39It can be observed from Figure 9 that
50% of the fully charged state is achieved in ∆t ≈ 250 s when there are convective flows, whereas it takes ≈ 1000 s when the heat flow is purely diffusive. Clearly, convec-tive flows accelerate the charging of the electric layer. In Figure 9 we have also plotted (full solid lines) the contin-uous differential voltage measurement during the (full) charging phase after completely discharging the TCC. Both curves (with and without convection) coincide re-markably well with the measurements performed in the charge/discharge sequence, showing the robustness of the electric layer charging process that can withstand many cycles.
III.4. Efficiency
The electrical energy stored at the IL/electrode inter-face and recovered through a single discharge is: W = (1/2)C∆V2= (1/2)CΛ2
P t∆T2. With ΛP t≈ −1.7 mV/K
at ∆T = 20oC, we obtain W/A ≈ 0.05 mJ m−2.
Dur-ing a chargDur-ing time of ∆t ≈ 250 s (see section III.3.), the energy loss Q is essentially due to the heat flow from the hot to the cold electrode: Q ≈ κA∆t∆T /l, where κ ≈ 0.3 W m−1 K−1 is the thermal conductivity of the electrolyte and l = 6 mm the distance between electrodes.
The TCC efficiency is expressed by:
η = W Q = T lΛ2P t 2κ∆t C Aηc (10) where ηc = ∆T /T represents the Carnot efficiency. We
obtain η ≈ 0.24 × 10⁻⁹ ηc, which is far too small for
any imaginable waste-heat recovery application. How-ever, the efficiency can be improved by adjusting various experimental parameters:
1. The electrode surface: Electrodes with larger effec-tive surface area can be used to increase the specific capacity.
2. Thermoelectric coefficients: Λ of the order of 10 mV K−1 has been observed in solutions of tetraalkylammonium nitrate in alcohols.40 Since
the efficiency is proportional to Λ2 a factor 100 might be gained by prospecting among the huge number of combinations IL/solvent.
3. The (re)charging time ∆t can be shorter depending on the IL and the nature of the electrodes. 4. TCC geometry: The thermal heat loss may be
sub-stantially reduced by modifying the geometry of the cell (e.g. non uniform section with reduced diame-ter at mid distance between electrodes, or by indiame-ter- inter-calating a porous membrane between electrodes). To illustrate, we have investigated one such example; namely the charging/discharging effect using nanoporous carbon electrodes, as presented in the following section.
IV. EXPERIMENTAL RESULTS WITH NANOPOROUS-CARBON ELECTRODES
A 0.2 mm thick and 4 mg weight nanoporous carbon (NanoTuneX Y-Carbon) electrode foil has been sand-witched between the platinum electrode and the cell body at both ends. N2 adsorption/desorption isotherms
were performed with a Micromeritics ASAP 2020 instru-ment. BET analysis gives a surface area of ≈ 300 m2/g.
The pore-size distribution is determined from desorption isotherm according to the BJH method. The average pore size is ≈ 20 ± 10 nm.
The thermoelectric coefficient under the same condi-tion as in the previous seccondi-tion is ΛC = −0.3 mV K−1,
approximately 6 times smaller than that obtained with Pt electrodes: ΛP t = −1.7 mV K−1. This observation
shows the importance of the interface potential φ(T ) in Eq. (5) and its drastic dependence on the nature of the electrode. The remarkably large thermoelectic coefficient Λ on platinum electrodes is likely due to the configu-rational entropy change in EMIM+ and/or TFSI− ions
adsorbed at the surface.
A series of charging/discharging cycles through various resistive loads from 1.5 to 10 kΩ has been performed.
FIG. 10. TCC with Y-Carbon electrodes. Discharge through different loads: 1.5 (blue), 3 (green), 5 (red), and 10 kΩ (black). The white dashed lines are fits through Eq. (9). The corresponding short relaxation times τ as a function of R are show in inset. The corresponding capacitance is 18.3 mF, four orders of magnitude larger than that obtained with Pt electrodes. Sample is 2M EMIMTFSI in acetonitrile.
Note that, due to much larger capacitances of carbon electrodes, it was necessary to use much smaller R values here than those used with Pt electrodes.
The discharge potentials are shown in Figure 10. The results are fit once again to Eq. (9) to extract τ and θ. The corresponding short relaxation-times τ are reported in the inset, from which the differential capacitance of the system was determined as C = 18.3 mF, four orders of magnitude larger than that corresponding to Pt elec-trodes. The long time-scale constant θ ≈ 2 hours was obtained from R = 10 kΩ measurement; (note that for smaller R, the experimental time range (t < θ) does not permit accurate determination of θ).
Applying a larger temperature difference ∆T = 40oC with Ttop = 70oC and Tbot = 30oC leads to the same
conclusion. In Figure 11, the short characteristic times τ obtained using the two different ∆T values are com-pared. They lead to the same capacitance C = 18.3 mF. Therefore, by simply changing the electrode material, we were able to increase the TCC efficiency by 2 ≈ 3 orders of magnitude.
Finally, we have performed a set of charge/discharge with asymmetric electrodes: i.e., nanoporous Y-Carbon electrode at the top, and Pt electrode at the bottom. The results are similar to those obtained with two symmetric pure platinum electrodes with a slightly higher capaci-tance value of 5.4 µF. The short characteristic times ob-tained under different measurement conditions are sum-marised in Figure 11. In all cases the cell can be modelled as two capacitances in series, taking CC = 36.5 mF for
a carbon electrode and CP t = 5 µF for a platinum
elec-trode.
The specific capacitance for one carbon electrodes is ≈ 3µF/cm2, a value close to that deduced from Fig. 4 in Ref. 41: ≈ 4µF/cm2 from electrochemical analysis of
FIG. 11. Short charateristic times τ with: a) Two Pt elec-trodes (black circles); the black line corresponds to two capac-itors with CP t= 5 µF in series; b) Two Y-Carbon nanoporous
electrodes at 30–50oC (green up-triangles) and 30–70oC (blue
down-triangles); the blue line corresponds to two capacitors with CC = 36.5 mF in series; c) One Pt electrode and one
Y-Carbon nanoporous electrode (red diamonds); the red line corresponds to two different capacitances CP t = 5 µF and
CC = 36.5 mF in series.
a 1 M solution of the ionic liquid tetraethylammonium tetrafluoroboride in acetonitrile.
V. CONCLUSION
We have investigated the thermal-to-electric energy conversion possibility in TCC’s through charge accumu-lation in the electrical layers forming at the IL-electrode interface. The accumulated electric charge can be dissi-pated through an external load in a discontinuous way through a charge/discharge sequence while maintaining a steady-state temperature gradient across the cell. Most of the discharge occurs in a short time corresponding to a fast rearrangement of the IL/electrode interface. Re-peated cycles of charge/discharge of the TCC show that the charging process is robust and well reproducible.
With no ionic electric current flowing through the cell, the described energy recovery process differs from that of most thermogalvanic cells. Some advantages of the present method include avoiding Joule heating and the reliance on the ionic conductivity, which tend to limit the efficiency of thermogalvanic cells.
Although the present efficiency value is not usable for any waste-heat recovery application, it can be improved greatly by a careful selection of electrode materials, ionic liquid and cell designs. Indeed, from Fig. 4 in Ref. 41, carbon nanopowder with higher surface area of order 2000 m2/g increases the capacity by a factor 10 with
re-spect to the presently used Y-Carbon. Other nanostruc-tured electrodes, as nanoporous metals or carbon nan-otubes can also be investigated. The charging time of the electric layer can also be reduced greatly by
induc-8 ing convective flows. Last but not the least a plethora
of IL/electrode combinations can be explored to increase the thermoelectric coefficient Λe to maximize the
volt-age difference, and ultimately, to increase the efficiency of thermoelectric capacitors.
ACKNOWLEDGMENTS
We thank D. Duet for technical support and M. Bombled from Laboratoire L´eon Brillouin (CEA-CNRS, Saclay) for performing the BET surface area and BJH pore-size measurements on nanoporous carbon. This project is supported by Agence Nationale pour la Recherche (France) ANR-TEFLIC- Progelec 12-PRGE-0011-01.
1T. Kuroki, K. Kabeya, K. Makino, T. Kajihara, H. Kaibe,
H. Hachiuma, H. Matsuno, and A. Fujibayashi, J. Electronic Ma-terials 43, 2405 (2014).
2B. Burrows, J. Electrochem. Soc. 123, 154 (1976). 3J. Richter, Electrochimica Acta 22, 1035 (1977).
4J. M. Hornut and A. Storck, J. Appl. Electrochem. 21, 1103
(1991).
5Y. V. Kuzminskii, V. A. Zasukha, and G. Y. Kuzminskaya, J. of
Power Sources 52, 231 (1994).
6T. Hinoue, E. Ikeda, S. Watariguchi, and Y. Kibune, Anal. Chem.
79, 291 (2007).
7A. Gunawan, C.-H. Lin, D. Buttry, A. V. Mujica, R. A.
Tay-lor, R. S. Prasher, and P. E. Phelan, Nanoscale and Microscale Thermophysical Eng. 17, 304 (2013).
8Y. Yamato, Y. Katayama, and T. Miura, J. Electrochemical Soc.
160, H309 (2013).
9T. J. Abraham, D. R. MacFarlane, and J. M. Pringle, Energy
Environ. Sci. 6, 269 (2013).
10T. J. Abraham, D. R. MacFarlane, R. H. Baughman, L. Jin,
N. Li, and J. M. Pringle, Electrochemica Acta 113, 87 (2013).
11V. Zinovyeva, S. Nakamae, M. Bonetti, and M. Roger,
Chem-ElectroChem 1, 426 (2014).
12P. F. Salazar, S. Kumar, and B. A. B. A. Cola, J. Appl.
Elec-trochem. 44, 325 (2014).
13S. Uhl, E. Laux, T. Journot, L. Jeandupeux, J. Charmet, and
H. Keppner, J. Electronic Materials 43, 3758 (2014).
14T. I. Quickenden and Y. Mua, J. Electrochem. Soc. 142, 3985
(1995).
15Y. Yang, S. W. Lee, H. Ghasemi, J. Loomis, X. Li, D. Kraemer,
G. Zheng, Y. Cui, and G. Chen, Proc. Nat. Acad. Sci. 111, 17011 (2014).
16M. Galinski, A. Lewandowski, and I. Stepniak, Electrochemica
Acta 51, 5567 (2006).
17N. S. Hudak and G. G. Amatucci, J. Electrochem. Soc. 158,
A572 (2011).
18Y. Qiao, V. K. Punyamurtual, A. Han, and H. Lim, J. Power
Sources 183, 403 (2008).
19B. Xu, L. Liu, H. Lim, Y. Qiao, and X. Chen, Nano Energy 1,
805 (2012).
20H. Lim, W. Lu, and Y. Qiao, Appl. Phys. Lett. 101, 063902
(2012).
21H. Lim, W. Lu, X. Chen, and Y. Qiao, Nanotechnology 24,
465401 (2013).
22J. Agar, Thermogalvanic cells (Paul Delahay ed., Interscience
New York, 1963) Chap. Advances in Electrochemistry and Elec-trochemical Engineering, pp. 31 – 121.
23H. L. Ngo, K. LeCompte, L. Hargens, and A. B. McEwen,
Ther-mochemica Acta 357-358, 97 (2000).
24M. Hayyan, F. S. Mjalli, M. A. Hashim, I. M. AlNashef, and
T. X. Mei, J. Ind Eng. Chem. 19, 106 (2013).
25Y. Z. Su, Y. C. Fu, Y. M. Wei, J. W. Yan, and B. W. Mao,
ChemPhysChem 11, 2764 (2010).
26Y. Z. Su, Y. C. Fu, J. W. Yan, Z. B. Chen, and B. W. Mao,
Angew. Chem. Int. Ed. 48, 5148 (2009).
27A. B. McEwen, H. L. Ngo, K. LeCompte, and J. L. Goldman, J.
Electrochemical Soc. 146, 1687 (1999).
28G. B. Pan and W. Freyland, Chem. Phys. Lett. 427, 96 (2006). 29D. Wakeham, R. Hayes, G. G. Warr, and R. Atkin, J. Phys.
Chem. B 113, 5961 (2009).
30T. Cremer, M. Stark, A. Deyko, S. H. P., and F. Maier, Langmuir
27, 3662 (2011).
31F. Silva, C. Gomes, M. Figueiredo, R. Costa, A. Martins, and
C. M. Pereira, J. Electroanal. Chem. 662, 153 (2008).
32V. Lockett, R. Sedev, J. Ralston, M. Horne, and T. Rodopoulos,
J. Phys. Chem. C 112, 7486 (2008).
33A. W¨urger, Phys. Rev. Lett. 101, 108302 (2008). 34J. A. Bierlein, J. Chem. Phys. 23, 10 (1955).
35J. N. Agar and J. C. R. Turner, Proc. Royal Soc. London A 225,
307 (1959).
36A. Noda, K. Hayamizu, and W. Watanabe, J. Phys. Chem. B
105, 4603 (2001).
37V. V. Chaban, I. V. Voroshylova, O. N. Kalugin, and O. V.
Prezhdo, J. Phys. Chem. B 116, 7719 (2012).
38D. M., B. Huber, and B. Roling, J. Phys. Chem. C 115, 6802
(2011).
39P. G. Drazin and W. H. Reid, Hydrodynamic Stability
(Cam-bridge University Press, Cam(Cam-bridge, 1981).
40M. Bonetti, S. Nakamae, M. Roger, and P. Guenoun, J. Chem.
Phys. 134, 114513 (2011).
41O. Barbieri, M. Hahn, A. Herzog, and R. K¨otz, Carbon 43, 1303