HAL Id: hal-02464935
https://hal.archives-ouvertes.fr/hal-02464935
Submitted on 12 Jun 2020
HAL is a multi-disciplinary open access
archive for the deposit and dissemination of
sci-entific research documents, whether they are
pub-lished or not. The documents may come from
teaching and research institutions in France or
abroad, or from public or private research centers.
L’archive ouverte pluridisciplinaire HAL, est
destinée au dépôt et à la diffusion de documents
scientifiques de niveau recherche, publiés ou non,
émanant des établissements d’enseignement et de
recherche français ou étrangers, des laboratoires
publics ou privés.
Creating Regular Matrices of Aligned Silica
Nanohelices: Theory and Realization
Jie Gao, Sanaa Semlali, Julien Hunel, David Montero, Yann Battie, David
Gonzalez-Rodriguez, Reiko Oda, Glenna Drisko, Emilie Pouget
To cite this version:
Jie Gao, Sanaa Semlali, Julien Hunel, David Montero, Yann Battie, et al.. Creating Regular Matrices
of Aligned Silica Nanohelices: Theory and Realization. Chemistry of Materials, American Chemical
Society, 2020, 32 (2), pp.821-829. �10.1021/acs.chemmater.9b04372�. �hal-02464935�
Jie Gao,
1Sanaa Semlali,
2Julien Hunel,
3David Montero,
4Yann Battie,
5David
Gonzalez-Rodri-guez,
5Reiko Oda,
1Glenna L. Drisko,*
2Emilie Pouget*
11 CNRS, Univ. Bordeaux, Bordeaux INP, Chimie et Biologie des Membranes et des Nanoobjets, UMR 5248, Allée St
Hilaire, Bat B14, 33607 Pessac, France
2 CNRS, Univ. Bordeaux, Institut de Chimie de la Matière Condensée de Bordeaux, UMR 5026, 87 av du Dr.
Schweit-zer, 33600 Pessac, France.
3 CNRS, Univ. Bordeaux, Institut des Sciences Moléculaires, UMR 5255, 351 cours de la Libération, 33405 Talence,
France.
4 Sorbonne Univ., Institut des Matériaux de Paris Centre (IMPC FR 2482), UFR de Chimie Campus Jussieu, 75252
Paris, France
5 Laboratoire LCP-A2MC, Institut Jean Barriol, Université de Lorraine, 1, boulevard Arago, 57078 Metz cedex 3,
France.
KEYWORDS: Silica, Elongated nano-object, Helix, Evaporation-induced self-assembly, Dip-coating, Capillarity theory
ABSTRACT: Here we exercise nanoscale control over the assembly of highly anisotropic silica helices using convective flow
by using the physical properties occurring during evaporation-induced self-assembly. Organizing and patterning such chi-ral elongated objects over large surfaces in a controllable and reproducible fashion is challenging, but desirable to optimize the performance of biomimetic structures, nano-sensors (mechanical properties of helices) or optical materials (chiral ob-jects have asymmetric interactions with light as absorption is different for left- and right-handed polarization). The cou-pling of evaporation forces and physicochemical solution properties induce specific helix alignment and the stick-slip phe-nomenon produces a periodical deposition of bands with controllable and regular spacing. Helix orientation, packing den-sity and spacing can then be tuned. We observe the effect of polymer additives, silica helix concentration, and substrate withdrawal speed on the quality and the orientation of the helix deposition. Theoretical modeling based on capillary hy-drodynamics is developed to describe the relationship between evaporative conditions and pitch distance, the band width of the stick region and the helix orientation.
1. Introduction
Organizing elongated nanometric objects into an ordered array can increase or generate properties unobserved when these objects are individually dispersed or randomly ori-ented. Material scientists have proposed various ap-proaches to place and arrange complex anisotropic nano-building blocks.[1-3] The self-templating process,[4,5]
organi-zation via organic matrices,[6,7] spraying,[8-10] and
evapora-tion based techniques are among the techniques available for guiding anisotropic object assembly.[11-16] The formation
of lyotropic liquid crystals directly in bulk or via these evaporation techniques represents an interesting tool.[17-19]
Where convective evaporation has generated beautifully organized patterned surfaces from inorganic anisotropic
objects like nanowires and nanorods[12,15,20] or chiral
biolog-ical rod-like viruses,[21,22] to the best of our knowledge, the
organized assembly of synthetic chiral anisotropic objects has not yet been reported. Nanoscale helices behave differ-ently than nanoparticles and rods due to the excellent cou-pling of sheer forces in liquid with helix particle motion. Such dynamics may help or destroy the organization, a question which we probe here.
Dip-coating does not require sophisticated and expensive equipment or a pre-treatment of substrates, and is achieved simply by withdrawing the substrates im-mersed in liquid with solutes or particles under controlled speed. Pre-etching, laser imprinted designs and complex chemical treatment processes can be added to increase the complexity, but are typically unnecessary. Dip-coating has
been applied to many industrial fields, e.g. in the prepara-tion of ceramics,[23] films, and hybrid materials.[24] Since an
early study by Schunk, Hurd and Brinker 20 years ago,[25]
the mechanisms underlying this technique continue to in-trigue researchers. During evaporation, complex interac-tions are present between the solutes, solution and the sur-rounding environment at the interface, as well as in the bulk, affected by various conditions including chamber temperature, humidity, solution concentration, surface tension, viscosity and withdrawal speed. When this occurs in the presence of particles, they are concentrated at the drying line by convective transport driven by evaporation, and then tightly packed due to interparticle capillary forces.[26-28] Not only do nanoparticles become pinned to
the surface by the meniscus, but the meniscus becomes pinned to the surface by nanoparticles. Substrate with-drawal stretches the pinned meniscus and eventually un-pins it, resulting in regular and compact particle-loaded lines separated by zones of poorly covered surfaces. This process is called the stick-slip phenomenon and can be used to produce regular and controllably spaced linear ar-rays of particles.[29]
Spheres or small aspect ratio particles can roll more easily than non-round objects with large aspect ratio and thus it is relatively easy to process them into dense as-semblies. The equilibrium between the particle-substrate or particle-particle electrostatic interaction repulsions and van der Waals interaction forces can prevent tight particle packing. The movement of particle suspensions with more complex shapes are plagued by more complex interparticle interactions and higher drag forces along the substrate, in-creasing the difficulty of obtaining well-organized mono- or multilayered structures. Once evaporation thins the me-niscus to the thickness of the nano-object diameter, the objects can no longer diffuse or freely rotate and can only slide closer to or away from nearby objects. Also, the con-vective vs shear gradient forces can induce nanoparticle orientations parallel and perpendicular to the contact line (the meniscus).[22,23,29,30] Finally, the physical-chemical
properties of the solution (surface tension, viscosity, pH, etc.), as well as the withdrawal speed, can all play a crucial role in surface patterning. These forces can control the for-mation of nematic-like phases via entropy gain in the con-centrated and confined zones, as shown with carbon nano-tubes,[31] ZnO nanorods,[21] gold nanorods[12] or biological
filaments.[22,23] Because the helical particles present
differ-ent sheer forces coupling in liquid than more common rods, their assembly should be altered but has never been studied because of the lack of model systems at the na-noscale. However, we expect these assemblies of helices to open up possible applications in chiroptical devices.
In this article, we propose a complete study of the organization of highly anisotropic silica nanohelices over large surfaces, coupled with analytical hydrodynamic the-ory of the observed phenomena. We produce stable colloi-dal solutions of nanohelices in a mixture of ethanol and isopropanol and study their organization by evaporation during dip-coating on silicon substrates. This convective assembly of silica helices is studied by examining the effect
of polymer additives, withdrawal speed and silica helix concentration. These different parameters are studied and optimized to accurately control the nanohelix deposition density, macroscopic organization and nanometric ne-matic order alignment. The obtained morphologies of or-ganized helices are interpreted using theoretical modeling based on capillary hydrodynamics, giving insight into the physicochemical processes at work during the complex and constantly evolving environment of drying films.
2. Results and discussions
The sol-gel transcription of self-assembled C2H4
-1,2-((CH3)2n+C16H33)2 with a tartrate counterion yields
nano-metric silica helices with controlled morphology (21 nm in width and a pitch of 92 nm) and handedness (Figure 1). [32-34] These helices are initially long and entangled. Tip
soni-cating their suspension after transcription can fragment them into disentangled strands, micrometers in length.[35]
These strands form stable and homogeneously dispersed colloidal suspensions in a range of solvents, such as the mixture of ethanol and isopropanol used in the present study.
Evaporation-induced self-assembly is affected by the solution properties (viscosity, colloidal stability, colloi-dal concentration, etc.) and the evaporation rate. In this study, polymer additives, which modify the surface tension of the solution, the viscosity, the evaporation rate and also the steric and/or electrostatic particle-particle interac-tions, impact the deposition of the silica nanohelices. First, the suspensions (Isoelectric point in water ~ 4.3, see zeta-potential measurement in Supporting Information 1) of the nanohelices were dip-coated onto a silicon substrate, with and without polymer additives (Figure 1). Anionic poly-acrylic acid (PAA) and cationic polyethyleneimine (PEI) are the two linear polyelectrolytes used in this study, cho-sen as they precho-sent opposite charges at neutral pH. Alt-hough it is difficult to probe the surface charge in alcoholic suspensions, the impact of the presence or absence of charged polymers on the aggregation of the colloidal silica helices in suspensions is visible using the electron micros-copy images in Figure 1 and their different scattering prop-erties (Supporting Information 2). The homogeneity of the surface coating is directly influenced by the presence or ab-sence of the polymer in the suspension: in the abab-sence of polyelectrolyte (Figure 1b), the deposition conditions ap-plied here led to a sparse, disordered and inhomogeneous helix coverage. The addition of cationic PEI increases the surface density of silica nanohelices, compared to suspen-sions with no polyelectrolyte, probably due to a lower evaporation rate, allowing the more efficient pinning of the helices on the surface. However, the helices are still inho-mogeneously distributed and randomly oriented (Figure 1c), likely due to the attractive interaction between cationic PEI and negatively charged silica surface. This Coulombic attraction leads to their aggregation and PEI crosslinking between nanohelices. On the contrary, in the presence of the anionic PAA, the helices are well oriented parallel to each other (Figure 1d). Perhaps the co-suspension of nega-tively charged PAA and neganega-tively charged nanohelices is
more stable with higher helix mobility. Additionally, PAA decreases the evaporation rate, giving the nanohelices time to align. PAA incorporation in the solution allows helices to be aligned vertically or horizontally, with controlled in-terband spacing.
Figure 1. Effect of surface functionalization on helix
as-sembly. (a) Transmission electron microscopy (TEM) image
of individual silica helices. (b-d) Scanning electron micro-scope (SEM) images for the assemblies of silica helices with (b) no polyelectrolyte, (c) PEI and (d) PAA. The withdrawal speed is 5 µm/s and the helix concentration is 0.4 mg/mL.
2.1. Withdrawal speed: evidence of two evaporative regimes
Numerous reports show that during dip-coating the with-drawal speed is closely related to the drag forces and the evaporation conditions strongly affect film thickness.[36,37]
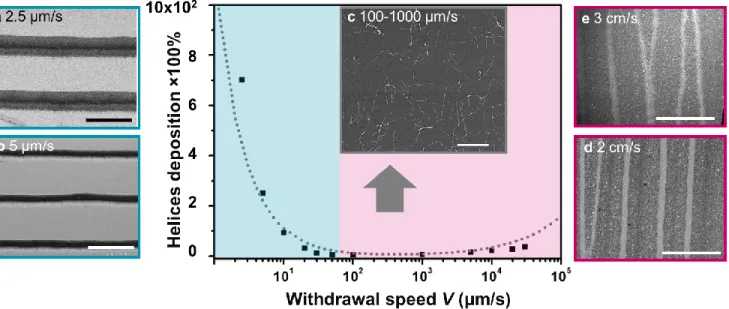
We studied the effect of the withdrawal speed between 2.5 and 30,000 µm/s on the deposited film formed by the silica helices (Figure 2). The deposition density is defined as the percentage of the surface covered by helices divided by the total surface. In the presence of multilayers of helices in some regions, this percentage is multiplied by the number
of layers (estimated by AFM characterization), giving num-bers that can exceed 100% deposition density (See detailed image treatment in Supporting Information 3).
As observed in Figure 2, the density of helices covering the surface is high at the slowest withdrawal rates and decreases with increasing withdrawal speed until poor coverage occurs at withdrawal rates between 100-1000 µm/s. This density remains low until it increases again at the withdrawal speed of ~10000 µm/s, although it does not reach the high values observed at the slowest speeds. From the previous studies, these two regions of higher particle deposition density are explained by the presence of two physical regimes, governed by evaporative transport and by advective transport, respectively.[36] The regime at slow
withdrawal rate corresponds to the evaporative transport regime (in blue in Figure 2), where film thickness decreases with increasing withdrawal speed. The regime at fast withdrawal rate corresponds to the advection regime (in violet in Figure 2), where the film thickness increases with withdrawal speed. In both regimes, well-organized bands appear on the substrate: horizontal ones in the evaporative transport regime due to the stick-slip phenomenon (periodic helix-rich bands, the stick regions, alternate with helix-poor areas, the slip regions); vertical ones in the advection regime (Figure 3). The orientation of the helices in the bands is analyzed by Image-J as shown in the color scheme in Figure 3g. Light blue indicates an orientation of 0°, the horizontal direction, where red indicates ±90°, the vertical direction, from which the order parameter S can be extracted (see Experimental section and Supporting Information 4). A high order parameter S between 0.85-0.95 in the horizontal orientation happens for the stick regions for the evaporative transport regime. The SEM image in Figure 3b details the border of a slip and stick region, confirming the horizontal orientation of the helices in the stick bands. At an intermediate speed (30-1000 μm/s), the order parameter is low (0.2-0.3), indicating a mostly random orientation (Figure 2c) with a slight alignment preference for 90°, suggesting that helices are subjected to higher shear, but without enough time to fully align. At a withdrawal speed ranging from 5000 to 30000 µm/s, the deposition density increases with a preferential alignment of 90° (parallel to the withdrawal shear) with an average order parameter S of 0.75 (Figures 2d and 2e).
Figure 2. Helix deposition vs withdrawal speed. (a-e) SEM images at various withdrawal speeds between 2.5-30 000 μm/s. The SiO2:PAA ratio is 1:10, the silica concentration is 0.4 mg/mL. The dotted line indicates the theoretically predicted
dependence of particle deposition density (ρP) as a function of the withdrawal rate. Scale bars (a, b, d and e) represent 100
μm, and (c) 1 μm.
The density data vs withdrawal rate in Figure 2 can be de-scribed by a theoretical model. The two competing particle transport mechanisms, can be quantified as follows: 𝑄𝑎≈ 𝑐 ℎ 𝑉 (1)
𝑄𝑒≈ 𝑐 𝑙𝑐𝑉𝑒 (2)
Here 𝑄𝑎 is the nanohelix transport rate towards the liquid
meniscus due to particle advection into the Landau-Levich film driven by substrate motion. This advective transport rate increases with the withdrawal speed 𝑉 and is propor-tional to the particle concentration c and to the thickness of the Landau-Levich film ℎ. 𝑄𝑒 is the nanohelix transport
rate towards the meniscus due to evaporation, and 𝑉𝑒 is the
evaporation speed. The typical length over which evapora-tion contributes to particle deposievapora-tion scales with the ca-pillary length 𝑙𝑐, the typical size of the meniscus, as this will
be the typical size of the flow recirculation region. The number of particles deposited per unit surface of the plate, which is denoted 𝜌𝑃, can be estimated by:
𝜌𝑃=𝑄𝑎+𝑄𝑒 𝑉 ≈ 𝑐 𝑙𝑐𝐶𝑎 2 3⁄ + 𝑐𝑙 𝑐 V𝑒 𝑉 = 𝑐 𝑙𝑐[( 𝜇𝑉 𝛾) 2 3⁄ + 𝑉𝑒 𝑉] (3)
where 𝜌𝑃 is the particle deposition density, 𝑄𝑎 is the
advec-tive transport rate, 𝑄𝑒 is the evaporative transport rate and
𝑉 is the withdrawal rate of the substrate. Variable 𝑐 is the particle concentration in solution, 𝑙𝑐 is the capillary length
or typical size of the meniscus, and 𝐶𝑎 is the capillary
num-ber. 𝐶𝑎= 𝜇𝑉 𝛾⁄ ; where 𝜇 ≈ 10-3 Pa.s is the dynamic viscosity
of ethanol and 𝛾 ≈ 20 mN/m1 is the surface tension
coeffi-cient of ethanol. With a density ρ ≈ 800 kg/m3, the capillary
length of ethanol at 25 °C is estimated to be 𝑙𝑐 ≈ 1.6 mm.
The evaporation rate of ethanol at 25 oC is estimated from
published data[38] to be the order of 𝑉
𝑒= 0.2 𝜇𝑚/𝑠. This
model reproduces the experimental observation in Figure
2. The fit, plotted as a dashed line, has the predicted 𝜌𝑃
scaled by a proportionality constant to fit the data. At low withdrawal speeds, evaporation at the meniscus creates the dominant flux of suspended particles. For 𝑉 < 50 𝜇m/s, particle deposition is inversely proportional to 𝑉, as it is dominated by liquid evaporation. As the plate is with-drawn faster, the plate spends less time in contact with the meniscus, where evaporation-driven deposition occurs. Thus, particle deposition density decreases dramatically from 700% at a withdrawal speed of 2.5 μm/s to 13% at a speed of 30 μm/s. For 𝑉 > 1000 𝜇m/s, the dominant depo-sition mechanism becomes advection, where particle transport is driven by the motion of the substrate. Advec-tion increases with the thickness of the Landau-Levich film, 𝜌𝑃≈ 𝑉2 3⁄ . In the intermediate regime, 50 < 𝑉 < 1000
𝜇m/s, both evaporation-induced transport and advection are weak, and particle deposition density reaches its mini-mum.
As described in previous studies,[39,40] there is a
transition occurring from evaporative to advective transport which corresponds to the condition 𝑄𝑒= 𝑄𝑎. By
balancing Equations (1) and (2) and by considering the cur-rent experimental conditions, we obtain a critical speed: 𝑉𝑐𝑟𝑖𝑡= 𝑉𝑒2 5⁄ ≈ 300 𝜇𝑚/𝑠. This result is consistent with the
recorded data presented in Figure 2.
2.2. Evaporative transport regime: controlled stick-slip phenomenon
At low withdrawal speeds, in the evaporative transport re-gime, a clear stick-slip phenomenon appears where peri-odic helix-rich bands, the stick regions, alternate with he-lix-poor areas, the slip regions (Figures 2a and 2b). Because of the low withdrawal speed used here, the meniscus be-comes stretched as the drying line slowly moves farther
Figure 3. Controlling orientation through withdrawal
speed. (a-c) The horizontal and (d-f) the vertical alignment
(a,d) scheme, (b,e) SEM image, and (c,f) orientation analysis. The colloidal solution is silica:PAA=1:10, the silica concentration is 0.4 mg/mL and the withdrawal speed is either (a-c) 10 μm/s or (d-f) 3000 μm/s. (g) is the legend for the colors shown in (c) and (f), with respect to various angles. Scale bars represent 1 μm.
away from the bulk solution as the substrate is withdrawn. As long as the meniscus is pinned to the drying line, more helices can accumulate in the drying zone, leading to a higher concentration of particles than that of the bulk so-lution. At some point, the meniscus is so stretched that it overcomes the particle pinning forces and quickly jumps to
its resting position, where it is pinned again by a fresh set of deposited particles. This periodic pinning and break-up of the meniscus is well-known in the evaporative transport regime as the stick-slip phenomenon.41 The fact that
nano-helices accumulate at the meniscus instead of entering into the wetting film crucially depends on the ratio between particle size and film thickness, as has been demonstrated for spherical particles through numerical simulation.[42]
For nanohelices, we must additionally consider that their trajectories follow what is called a Jeffery orbit[43] as they
are transported through solution. The Jeffery orbit has been first studied for the motion of rigid elliptical particles in shear flow, which rotate periodically. At slow withdrawal rates, the wetting film is too thin for helices to enter via a Jeffery orbit and so the helices become trapped in the me-niscus. Helix deposition is then driven by evaporative transport in this meniscus, by a similar mechanism as that described for spherical particles.[44,45] In the presence of
helices, the meniscus becomes pinned (Figure 4b). Starting from the initial meniscus position (Figure 4a), the distance between the pinning point and the substrate’s surface is denoted hp. This distance hp increases with time, as a result
of helix deposition. The slower the withdrawal rate, the more helices are deposited and the larger is the helix stick region. The motion of the substrate as it is withdrawn stretches the meniscus. Due to capillary-induced curva-ture, the meniscus eventually touches the surface of the substrate and breaks up (Figure 4c). The two resulting me-nisci rapidly retract to recover their static shape with a con-tact angle θc (Figure 4d). The upper and lower meniscus
continue to retract over time due to evaporation. The mo-tion of the receding contact line during evaporamo-tion will tend to align the nanohelices in the direction of the hori-zontal band, showing nematic-like phase organization. In order to further control the patterning of surfaces, the effect of the mass ratio of SiO2:PAA on the helix assembly
and stick-slip morphologies was investigated from 1:0 to 1:20 for a withdrawal speed of 5 µm/s and a silica nanohelix concentration of 0.4 mg/mL (Figure 5). Increasing the PAA concentration enhances the width of the stick region and
Figure 4. Conceptualization of the horizontal strip formation. (a) The start of the stick zone deposition. (b) Intermediate stage. (c) The meniscus touches the substrate, breaks-up and ends deposition in the current stick zone. (d) After meniscus break-up, rapid retraction occurs, which contributes to the pitch between stick zones.
the helix concentration in these zones, because the helix transport rate increases with concentration for a given evaporation rate. We also note that higher concentration of PAA may additionally lower the evaporation rate. The orientation of the helices inside the stick regions is also in-fluenced by the polymer additive: S increases from 0.02 in the absence of PAA to a maximum of 0.86 for a mass ratio of SiO2:PAA of 1:10, confirming the importance of the
pres-ence of the negatively charged polymer to the free rota-tional motion of the helices.
Figure 5. Dependence of order on SiO2:PAA ratio. SEM
im-ages of the dip-coated samples with a SiO2:PAA ratio of (a) 1:5,
(b) 1:10 and (c) 1:20. The images (d-f) show higher magnifica-tion of the stick regions of (a-c). The withdrawal speed was 5 µm/s, the helix concentration was 0.4 mg/mL. Scale bars rep-resent 100 µm for (a-c) and 1 µm for (d-f).
The stick-slip phenomenon gives controlled surface pat-terning and can be tuned via the silica concentration of the nanohelix suspensions. Figure 6 shows the evolution of this patterning from 0.1 to 1 mg/mL silica helix solutions with a ratio SiO2:PAA of 1:10 and a withdrawal speed of 5 µm/s.
The samples observed by polarized optical microscopy in the reflection mode show a black background correspond-ing to the slip regions and light lines correspondcorrespond-ing to the stick regions.
Figure 6. Dependence of pitch on silica concentration.
(a-f) Reflection mode polarized optical microscopy images of
substrates prepared using a silica concentration ranging from 0.1 to 1 mg/mL. The SiO2:PAA ratio used was 1:10, the
withdrawal speed was 10 μm/s. Scale bars represent 100 µm.
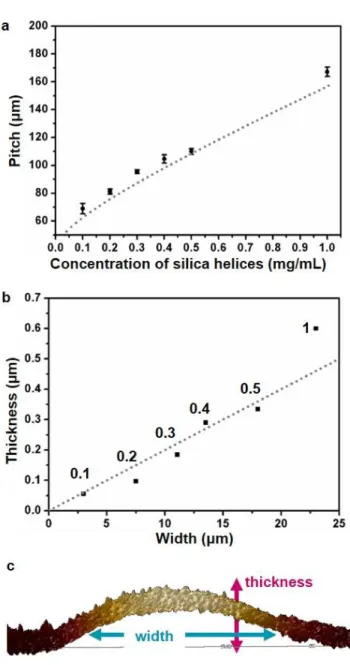
As plotted in Figure 7b, the pitch between two stick regions increases with increasing silica concentration. Due to the higher helix concentration in solution, more helices are de-posited during drying. Due to the more significant quantity of helices at the drying line, the meniscus is pinned at a larger distance from the substrate hp, resulting in a bigger
jump to its static equilibrium position upon unpinning (Figure 4). Theoretical calculations of pitch (Lp) as a
func-tion of helix concentrafunc-tion have been performed; details of the theoretical modeling can be found in the Experimental section. The theoretical model shows a good fit to the ex-perimental data (Figure 7). The pitch increases with con-centration rapidly at low concon-centrations and more slowly at higher concentrations. In parallel, atomic force micros-copy was used to accurately measure the height of the na-nohelix stacking (width) and the thickness of the stick gions (Figure 7c). The width and thickness of the stick re-gion increase with silica concentration. Moreover, experi-mental data in Figure 7b shows that the width is propor-tional to the thickness. This suggests that the shape of the helix deposition may be determined by the evaporation of the remnant solution after the stick-slip occurs. The evap-orating drop of liquid has a constant contact angle that is independent of particle concentration. The tangent of this contact angle may thus set a constant ratio between the height and the thickness of the deposit.
Figure 7. Theoretical modelling of experimental stick-slip
variations. (a) Stick-slip pitch vs helix concentration,
meas-ured from the optical microscopy images in Figure 6. (b) Stick thickness vs stick width measured using AFM for all the stud-ied concentrations. (c) Side view of AFM image one stick line for a silica concentration of 0.4 mg/mL, showing the definition of width and thickness of the stick regions. In (a) and (b), the dotted line shows the theoretical predictions of the evapora-tive transport model.
2.3. Advection regime: the unexpected vertical bands
In the advection regime, no particle accumulation due to evaporation occurs; the concentration of helices in the liq-uid film is equivalent to that of the bulk solution. Moreo-ver, in the advection regime, the meniscus is thicker than the length of the helices. Thus, helices are aspirated into the meniscus via advection, spinning in a Jeffery orbit (Supporting Information 7). Once inside the drying film, advection velocity dominates over rotational diffusion and so the helices will tend to align with the flow,[46] referred to
as shear flow. Although this explains the vertical alignment
of the nanohelices (Figure 3 d-f), it does not explain their organization into bands of nanohelices (Figure 2 d,e). Few examples are known of such bands forming in the draining regime because of shear force.[47,48] Two factors seem to be
the origin of the band formation: the elongated shape of the nanohelices and the presence of PAA. As shown in the Supporting Information 5, if the same experiment is per-formed with spherical silica nanoparticles of similar diam-eter and in the presence PAA, no bands form, but a homo-geneous deposition is observed. And if the same experi-ment is performed with silica helices, but without the pres-ence of PAA, helices are randomly deposited without any obvious organization. Moreover, in a film containing the helices and PAA, a hexagonal organization is observed if the substrate dries horizontally (Supporting Information 6), showing that helices still align relative to each other. This confirms that the shear forces induced by gravity driven draining alone are not enough to cause the align-ment of the helices, but the presence of the polymer acting as a lubricant is required. Furthermore, the vertical band formation seems to be a consequence of these shear forces during the final evaporation stage after substrate with-drawal, as the bands only appear when the sample is dried vertically. Such vertical band formation is reminiscent of experiments performed by Huang and collaborators,[49]
where stripes of nanoparticles formed perpendicular to a dewetting front. The gravity effect in our experiments ap-pears necessary to drive the propagation of the dewetting front. The mechanism leading to the formation of bands perpendicular to a drying front remains unknown, alt-hough a relation to a fingering instability is possible.[50,51] 3. Conclusion
In this study, we have shown that we can orientate these chiral elongated nano-objects in a chosen direction and or-ganize them in periodic structures in arrays of adjustable density. Indeed, large surfaces can be covered with orga-nized silica nanohelices of controlled patterns, deposition density and object orientation. The effect of various pa-rameters (polymer additives, nano-object concentration and withdrawal speed) on the organization was investi-gated to understand the formation mechanism. Thick bands can be obtained perpendicular to the withdrawal di-rection with a controlled periodicity and a nematic align-ment of nanohelices within each band when working in the evaporative transport mode (slow withdrawal). Less dense bands can be obtained parallel to the withdrawal direction in the advection mode (rapid withdrawal), also showing a good nematic order. The reason for orientation can be ex-plained by theoretical considerations based on fluid me-chanics, where capillary contraction orients the helices parallel to the contact line at low velocity, and shear forces orient the helices perpendicularly at high velocities. Using a theoretical model based on capillary hydrodynamics, we were able to predict the observed pitch width and distance. Thus, the model predicts the morphologies that should be obtained by varying the different experimental parameters. It would be particularly interesting to then extend this work to objects with unique chiroptical properties, such as
gold-based helices.[55,56] The organization of these
elon-gated and chiral nano-objects is of great interest for appli-cations that are presently being developed in our labora-tory, such as nano-sensors and model systems for cell dif-ferentiation to generate new biological tissues.
4. Experimental Section
Silica nanohelix colloidal solutions: The solutions were
pre-pared following three steps: synthesis of the organic tem-plate, silica transcription and helix dispersion; each of which has been described by Okazaki, et al.[35]
Step 1: the synthesis of organic surfactant template C2H4
-1,2-((CH3)2N+C16H33)2 with a tartrate counterion, also
named 16-2-16 Gemini L-tartrate, was optimized in a previ-ous work.[32] First, 16-2-16 Gemini bromide was obtained
from the reaction of N,N,N’,N’-tetramethylethylenedia-mine with 1-bromohexadecane. Then, silver acetate was used to replace the bromide in 16-2-16 Gemini bromide, giving the product 16-2-16 Gemini acetate. Finally, L-tar-taric acid was chosen for the ion exchange of the acetate, to give the 16-2-16 Gemini L-tartrate. The complex self-as-sembles in water to form helices. 1 mM 16-2-16 L-tartrate aqueous solution was heated to 60oC for 15 min, then the
solution was cooled to 20oC for 2 h.
Step 2: TEOS (500μL) was added to 10 mL of 0.1 mM aque-ous solution of L-tartaric acid (pH 3.8) and prehydrolyzed at 20 °C by stirring on a roller-mixer for 7 h. Then equal volumes of prehydrolyzed TEOS and organic gels contain-ing the helices are mixed (typically, 4 mL of each) and stirred at 20°C with a roller-mixer overnight. The excess TEOS and organic template were washed away by isopro-panol and ethanol using a centrifuge.
Step 3: A high intensity ultrasonic processor (Vibra cell 75186) equipped with a 2 mm microtip with variable power was used (maximum power, 130W). A 20 kHz pulse mode was used for the dispersion and fragmentation of silica na-nohelices. 2 mg of silica nanohelices were mixed with 2 mL of a 1:1 mixture of ethanol:isopropanol and sonicated for 15 min with pulses of 1 s, separated by 1 s pauses. Samples were cooled in an ice bath during the sonication process in order to avoid solvent evaporation and an increase of the sample temperature, which could influence the fragmentation process.
Finally, PEI and PAA were dissolved in ethanol to a con-centration of 20 mg/mL. The polymer solutions and silica suspensions were mixed and then sonicated for 10 min in an ultrasound bath to produce homogenous suspensions. Both PEI and PAA are linear polymers: PEI was purchased from Polysciences, Inc. with a molecular weight of 100,000g/mol. PAA was purchased from Sigma Aldrich with a molecular weight of 450,000g/mol.
Dip-coating: Dip coating experiments were performed on
an ACEdip 2.0 dip-coater from SolGelWay. The withdrawal speed, and the chamber temperature were controlled using the software ACEdip 2.0 SOLGELWAY. All experiments
were conducted using a chamber temperature of 25°C. Bo-ron-doped prime CZ silicon wafers with (100) orientation were obtained from Sil’tronix. The wafers were cleaned, rinsed with absolute ethanol and wiped dry with a Kim-wipe paper, before use as the substrate for helix self-assem-bly.
Calculation of the order parameter, S: The distribution of
the acute angles (θ) between the principal axis and each nanohelix orientation was determined using the binary im-ages extracted from the SEM imim-ages (Supporting Infor-mation 5). The Orientation-J pluggin developed for ImageJ corresponding to the structure tensor in a local neighbor-hood was used.[52,53] A 2D nematic order parameter S can
be calculated from this angular distribution:
where θ is the angle between the helices and the primary orientation. S = 0 corresponds to a random distribution and S = 1 corresponds to a perfectly parallel alignment.
Scanning electron microscopy (SEM): Before the
prepara-tion of the SEM samples, the slides are treated with oxygen plasma for 6 min in order to evaporate the polymer layers embedding the aligned helices. To show the initial distri-bution of PAA relative to silica helices, typical SEM images of samples with and without this plasma treatment are shown in SI-8. Then, the silicon slides are fixed with double face carbon tape on a classical SEM stub and covered with a Au/Pt layer a few nm in thickness, deposited by plasma sputtering. Two FESEM have been used for the observa-tion: JSM 6700F JEOL, and SEM-FEG Hitachi SU-70.
Atomic Force Microscopy (AFM): AFM analysis of the
to-pology of the dip-coated films was performed on a Dimen-sion Icon ScanAsyst from Bruker. The thickness and width of the stick region was measured precisely using an AFM with a silicon nitride probe. The parameters for measure-ment were a PeakForce® frequency of 2 kHz and a scan tip
rate of 0.125 Hz. The probe used has a tip radius of 5.0 nm and a constant stiffness of 0.4 N/m.
Polarized Optical Microscopy: Silicon wafers with a
depos-ited pattern were observed in the reflection mode. A Nikon DXM 1200 camera and Lucia G software with an objective magnification of ×10 were used to collect optical micros-copy images.
Theoretical modelling of pitch: Because the capillary
num-ber 𝐶𝑎≪ 1, the meniscus evolution is quasi-static. Thus, at
any given instant the meniscus adopts its static shape, as shown in Figure 5a. We non-dimensionalize all lengths by the capillary length 𝑙𝑐. Thus, we define the
non-dimen-sional variables: 𝑧̃ = 𝑧/𝑙𝑐, 𝑦̃ = 𝑦/𝑙𝑐, 𝐿̃ = 𝐿/𝑙𝑐, as well as a
nondimensional time 𝑡̃ = 𝑡𝑉/𝑙𝑐. Unless otherwise noted, in
the following equations we use non-dimensional variables, even if the tildes are omitted to simplify the writing. The equation describing this shape is:[54]
𝑦 = 𝐶 + 𝑎𝑟𝑐 𝑐𝑜𝑠ℎ ( 2 𝐿−𝑧) − 2 (1 − (𝐿−𝑧)2 4 ) 1 2⁄ (4) where 𝐶 is an integration constant obtained from the boundary condition 𝑦 = 0 at 𝑧 = 0:
𝐶 = 2(1 −𝐿2
4)
1 2⁄ − 𝑎𝑟𝑐 𝑐𝑜𝑠ℎ (2
𝐿) (5)
Meniscus break-up occurs when the minimum value of 𝑦 equals the height of the particle deposit, hp (Figure 5b). The
location of the minimum value of 𝑦 corresponds to d𝑦/d𝑧 = 0 with 𝑦 defined by Equation (4). If 𝐿 < 2, the location of the minimum is 𝑧𝑚𝑖𝑛= 𝐿 − √2. The corresponding value of
𝑦 = 𝑦min is: 𝑦𝑚𝑖𝑛= 2 (1 −𝐿2 4) 1 2⁄ − 𝑎𝑟𝑐 𝑐𝑜𝑠ℎ (2 𝐿) + 𝑎𝑟𝑐 𝑐𝑜𝑠ℎ(√2) − √2 (6)
The break-up condition is 𝑦𝑚𝑖𝑛= −ℎ𝑃. We suppose that
the height of the deposit is proportional to the amount of particles deposited in the meniscus by evaporative transport. In dimensional terms,
ℎ𝑃= 𝑘 𝑐 𝑉𝑒 𝑡 (7)
where 𝑘 is a constant relating the height of the deposit with its total particle mass. Rewriting Equation(10) in non-di-mensional terms and combining it with equation (9) yields 𝑘 𝑐 𝑉𝑒 𝑉 (𝐿𝑏− 𝐿0) = − [2 (1 − 𝐿2𝑏 4) 1 2⁄ − 𝑎𝑟𝑐 𝑐𝑜𝑠ℎ (2 𝐿𝑏) + 𝑎𝑟𝑐 𝑐𝑜𝑠ℎ(√2) − √2] (8)
Equation (8) allows calculating the meniscus height at breakup, 𝐿b, as a function of 𝑉 and 𝑐. Here 𝐿0 is the initial
height of the meniscus, corresponding to hp = 0. It is given
by the equation
(1−𝐿02) 𝐿0√4−𝐿02
= 𝑡𝑎𝑛𝜃𝑐 (9)
The value of the contact angle 𝜃c is related to the
width-to-thickness ratio r of the final drop that sets the shape of the nanohelix deposit. The relationship is:
𝑟 =1−𝑐𝑜𝑠(𝜃𝑐⁄ )2
𝑠𝑖𝑛(𝜃𝑐⁄ )2 ≈ 𝜃𝑐 (10)
By fitting the experimental data in Figure 7(b), we deduce 𝜃𝑐 = 1°, for which Equation (9) yields 𝐿0 = 1.40, which is the
value used to obtain the theoretical prediction in Figure 7(a).
Supporting Information.
SI-1: Silica helix surface charge. SI-2: Dispersion of the silica nanohelices in the presence of polymer additives. SI-3: Detailed image treatment and approximations for the density
deposition in the slip and the stick regions. SI-4: Detailed image treatment of the order parameter calculation. SI-5: Dip coating deposition of 30 nm diameter SiO2 spherical particles.
SI-6: SEM images of silica helix at 30 000 μm/s, to understand the bands formed in the advection regime. SI-7: Helix rotation in a Jeffery orbit during advection.
* e.pouget@cbmn.u-bordeaux.fr; Glenna.drisko@ic-mcb.cnrs.fr
J.G. produced all materials. S.S. and D.M. performed electron microscopy characterization. J.H. performed AFM characteri-zation. Y.B. and D.G.-R. developed theoretical models. J.G., R.O., D. G.-R., G.L.D. and E.P. co-wrote the article. R.O. and E.P. financed the research. The manuscript was written through contributions of all authors. All authors have given approval to the final version of the manuscript.
JG is supported by the Chinese Scholarship Council. JG, SS and GLD are supported by the LabEx AMADEus (ANR-10-LABX-42) in the framework of IdEx Bordeaux (ANR-10-IDEX-03-02), i.e. the Investissements d’Avenir program of the French government managed by the Agence Nationale de la Recherche.
Any additional relevant notes should be placed here.
The authors thank Matthias Pauly for the development of Im-age J plugins. FEGSEM instrumentation was facilitated by the PLACAMAT in Bordeaux and the Institut des Matériaux de Paris Centre (IMPC FR2482) and was cofunded by Sorbonne Université, CNRS and by the C'Nano projects of the Région Ile-de-France. The authors are grateful to Jacques Leng for fruitful discussions.
[1] Glotzer, S.C.; Some Assembly Required. Science 2004, 306,
419-420
[2] Glotzer, S.C.; Solomon, M.J.; Anisotropy of building blocks and their assembly into complex structures. Nature Materials
2007, 6, 557-562
[3] Velev, O.D.; Gupta, S.; Materials Fabricated by Micro- and Nanoparticles Assembly – The Challenging Path from Science to Engineering. Adv. Mater. 2009, 21, 1897–1905
[4] Chung, W. J.; Oh, J. W.; Kwak, K. W.; Lee, B. Y.; Meyer, J.; et al.; Biomimetic self-templating supramolecular structures. Nature
2011, 478, 364
[5] Xu, L.; W., Ma; L., Wang; C., Xu; H., Kuang; N. A., Kotov ; Nanoparticle assemblies: dimensional transformation of nano-materials and scalability. Chem. Soc. Rev. 2013, 42,3114--3126
[6] Paul, D.R. ; Robeson, L.M. ; Polymer nanotechnology : Na-nocomposites. Polymer 2008, 49 3187–3204
[7] Kumar, S.K.; Krishnamoorti , R.; Nanocomposites: Struc-ture, Phase Behavior, and Properties. Annual Review of Chemical
and Biomolecular Engineering 2010, 1, 37-58
[9] Sekar, S. ; Lemaire, V. ; Hu, H. ; Decher, G. ; Pauly, M. ; An-isotropic optical and conductive properties of oriented 1D-nano-particle thin films made by spray-assisted self-assembly. Faraday
Discussions 2016, 191, 373-389
[10] Hu, H.; Pauly, M.; Felix, O.; Decher, G.; Spray-assisted alignment of Layer-by-Layer assembled silver nanowires: a gen-eral approach for the preparation of highly anisotropic nano-com-posite films. Nanoscale 2017, 9 (3), 1307-1314
[11] Angly, J.; Iazzolino, A.; Slamon, J.-B.; Leng, J.; Chandran, S. P.; et al.; Microfluidic-Induced Growth and Shape-Up of Three-Dimensional Extended Arrays of Densely Packed Nanoparticles.
ACS Nano 2013, 7, 6465
[12] Li, P.; Li, Y.; Zhou, Z.-K., Tang, S. ; Yu, X.-F. ; et al.; Evapo-rative Self-Assembly of Gold Nanorods into Macroscopic 3D Plas-monic Superlattice Arrays. Adv. Mater. 2016, 28, 2511–2517
[13 Han, W.; Lin, Z.; Learning from “Coffee Rings”: Ordered Structures Enabled by Controlled Evaporative Self-Assembly.
An-gew. Chem. Int. Ed. 2012, 51, 1534–1546
[14] Huang, J.; Fan, R.; Connor, S.; Yang, P.; One-Step Pattern-ing of Aligned Nanowire Arrays by ProgrammedDip CoatPattern-ing.
An-gew. Chem. Int. Ed. 2007, 46, 2414–2417
[15] Dugyala, V. R. ; Basavaraj, M. G. ; Self-assembly of nano-ellypsoids into ordered structures via vertical deposition. RSC
Adv. 2015,5, 60079 –60084
[16] Feng, J.; Xia, H.; You, F.; Mao, H.; Ma, X.; et al.; Alignment of Ag nanowires on glass sheet by dip-coating technique. J. Alloys
and Compounds 2018, 735, 607-612
[17] Kim, K. T.; Park, C.; Kim, C.; Winnik, M. A.; Manners, I.; Self-assembly of dendron-helical polypeptide copolymers: or-ganogels and lyotropic liquid crystals. Chem. Commun. 2006,
1372-1374
[18] Dierking, I.; Al-Zangana, S.; Lyotropic Liquid Crystal Phases from Anisotropic Nanomaterials. Nanomaterials 2017,
7(10) 305
[19] Anderson, V.J.; Lekkerkerker, H. N. W.; Insights into phase transition kinetics from colloid science, Nature 2002, 416, 811-815
[20] Srikantharajah, R.; Schindler, T.; Landwehr, I.; Romeis, S.; Unruh, T.; Peukert, W.; From evaporation-induced self—assem-bly to shear-induced alignment. Nanoscale 2016, 8, 19882-19893
[21] Wargacki S. P.; Pate B.; Vaia, R.A.; Fabrication of 2D Or-dered Films of Tobacco Mosaic Virus (TMV): Processing Mor-phology Correlations for Convective Assembly. Langmuir 2008,
24, 5439–5444
[22] Kuncicky, D. M.; Naik, R. R.; Velev, O. D.; Rapid Deposition and Long-Range Alignment of Nanocoatings and Arrays of Elec-trically Conductive Wires from Tobacco Mosaic Virus. Small
2006, 2, 1462
[23] Lu, Y.; Ganguli, R.; Drewien, C. A.; Anderson M. T.; Brinker, C. J.; et al.; Continuous formation of supported cubic and hexag-onal mesoporous films by sol–gel dip-coating. Nature 1997, 389,
364–368
[24] Jokinen, M.; Pätsi, M.; Rahiala, H.; Peltola, T.; Ritala, M.; Rosenholm, J. B. Influence of sol and surface properties on in vitro bioactivity of sol-gel-derived TiO2 and TiO2-SiO2 films deposited by dip coating method. Journal of Biomedical Materials Research
1998,42,295-302
[25] Schunk, P. R.; Hurd, A. J.; Brinker, C. J.. Free-meniscus coating processes. In Liquid film coating (pp. 673-708), 1997, Springer, Dordrecht
[26] Dimitrov, A. S.; Nagayama, K.. Continuous Convective As-sembling of Fine Particles into Two-Dimensional Arrays on Solid Surfaces Langmuir 1996, 12, 1303
[27] Denkov, N. D.; Velev, O. D.; Kralchevsky, P. A.; Ivanov, I. B.; Yoshimura, H.; Nagayama, K.. Mechanism of formation of two-dimensional crystals from latex particles on substrates. Langmuir
1992, 8, 3183
[28] Prevo, B.; Velev, O.; Materials Deposition in Evaporating Menisci—Fundamentals and Engineering Applications of the Convective Assembly Process. In Evaporative Self-Assembly Of Ordered Complex Structures (pp. 109-155), 2012, World Scientific
[29] Huang, J.; Fan, R.; Connor, S.; Yang, P.. .One-Step Pattern-ing of Aligned Nanowire Arrays by Programmed Dip CoatPattern-ing.
An-gew. Chem. Int. Ed. 2007, 46, 2414
[30] Farcau, C.; Moreira, H.; Viallet, B.; Grisolia, J.; Ressier, L.; Tunable conductive nanoparticle wire arrays fabricated by con-vective self-assembly on nonpatterned substrates. ACS Nano
2010, 4(12), 7275-7282
[31] Shimoda, H.; Oh, S. J.; Geng, H. Z.; Walker, R. J.; Zhang, X. B.; McNeil, L. E.; Zhou, O.; Self-assembly of carbon nanotubes.
Adv. Mater. 2002, 14(12), 899-901
[32] Oda, R; Huc, I.; Schmutz, M.; Candau, S. J.; MacKintoshet, F. C.. Tuning bilayer twist using chiral counterions. Nature 1999,
399, 566-569
[33] Delclos, T.; Aimé, C.; Pouget, E.; Brizard, A.; Huc, I.; Del-ville, M.-H.; Oda, R., Individualized silica nanohelices and nano-tubes: Tuning inorganic nanostructures using lipidic self-assem-blies. Nano Lett. 2008, 8, 1929-1935
[34] Okazaki Y.; Buffeteau, T.; Siudyban, E.; Talaga, D.; Ryu, N.; Yagi, R.; Pouget, E.; Takafuji, M.; Ihara, H.; Oda, R.. Direct Obser-vation of Siloxane Chirality on Twisted and Helical Nanometric Amorphous Silica, NanoLett. 2016, 16(10), 6411-6415
[35] Okazaki, Y.; Cheng, J.; Dedovets, D.; Kemper, G.; Delville, M.-H.; Durrieu, M.-C.; Ihara, H.; Takafuji, M.; Pouget, E.; Oda, R., Chiral colloids: Homogeneous suspension of individualized SiO2 helical and twisted nanoribbons. ACS Nano 2014, 8, 6863-6872
[36] Faustini, M.; Louis, B. ; Albouy, P. A. ; Kuemmel, M. ; Grosso, D., Preparation of Sol−Gel Films by Dip-Coating in Ex-treme Conditions. J. Phys. Chem. C 2010, 114, 7637-7645
[37] Roland, S.; Gamys, C. G.; Grorenaud, J.; Boissé, S.; Pellerin, C., Prud’homme, R. E. ; Bazuin, C. G.. Solvent Influence on Thick-ness, Composition, and Morphology Variation with Dip-Coating Rate in Supramolecular PS-b-P4VP Thin Films. Macromolecules
2015, 48, 4823-4834
[38] Hofmann H. E.; Evaporation rates of organic liquids. Ind.
Eng. Chem. 1932, 24(2): 135-140
[39] Le Berre M., Chen Y., Baigl D.. From convective assembly to landau-levich deposition of multilayered phospholipid films of controlled thickness. Langmuir 2009, 25(5):2554–2557
[40] Srikantharajah R., Schindler T., Landwer I., Romeis S., Un-ruh T., Peukert W.. From evaporation-induced self-assembly to shear-induced alignment. Nanoscale 2016, 8:19882
[41] Watanabe S., Inukai K., Mizuta S., Miyahara M. T., Mecha-nism for stripe pattern formation on hydrophilic surfaces by using convective self-assembly.
Langmuir 2009, 25, 7287
[42] Colosqui C.E.; Morris J. F.; Stone H.. Hydrodynamically driven colloidal assembly in dip coating. Phys. Rev. Lett. 2013, 110, 188302
[43] Jeffery J. B.. The motion of ellipsoidal particles immersed in a viscous fluid, Proc. Roy. Soc. A 1922, 102, 161-179
[44] Watanabe S.; Inukai K.; Mizuta S.; Miyahara M. T.. Mech-anism for stripe pattern formation on hydrophylic surfaces by us-ing convective self-assembly. Langmuir 2009, 25: 7287-7295
[45] Kaplan N.C.; Wu N.; Mandre S.; Aizenberg J.; Mahadevan L.. Dynamics of evaporative colloidal patterning. Phys. Fluids
2015, 27: 092105
[46] Leahy B. D., Koch D. L., Cohen I., Controlling the align-ment of rodlike colloidal particles with time-dependent shear flows. J. Rheol. 2017, 61, 979
[47] Ghosh, M. ; Fan, F. ; Stebe, K. J.; Spontaneous pattern for-mation by dip coating of colloidal suspensions on homogeneous surfaces. Langmuir 2007, 23, 2180-2183
[48] Becerril, H. A. ; Roberts, M. E. ; Liu, Z. ; Locklin, J. ; Bao, Z.; High-Performance Organic Thin-Film Transistors through Solu-tion-Sheared Deposition of Small-Molecule Organic Semiconduc-tor. Adv. Mater. 2008, 20, 2588-2594
[49] Huang J.; Kim F.; Tao A. R.; Connor S.; YangP.. Spontane-ous formation of nanoparticle stripe patterns through dewetting.
Nat. Mater. 2005, 4: 896-900
[50] Cazabat AM M.; Heslot F.; Troian S. M.; Carles P.. Finger-ing instability of thin spreadFinger-ing films driven by temperature gra-dients. Nature 1990, 346: 824-826
[51] Deblais A.; Harich R.; Colin A.; Kellay H.. Taming contact line instability for pattern formation. Nat. Commun. 2016 7, 12458 [52] Blell, R.; Lin, X.; Lindström, T.; Ankerfors, M.; Pauly, M.; Felix, O.; Decher, G.. Generating in-Plane Orientational Order in Multilayer Films Prepared by Spray-Assisted Layer-by-Layer As-sembly. ACS Nano, 2017, 11, 84-94.
[53] Hu, H.; Pauly, M.; Felix, O.; Decher, G.. Spray-assisted alignment of Layer-by-Layer assembled silver nanowires: a
general approach for the preparation of highly anisotropic nano-composite films. Nanoscale, 2017, 9, 1307-21314.
[54] P.-G. de Gennes, F. Brochard-Wyart, D. Quéré, Capillarity and wetting phenomena. Drops, bubbles, pearls, waves. Springer,
2003.
[55] X. Lan, T. Liu, Z. Wang, A. O. Govorov, H. Yan, Y. Liu, DNA-Guided Plasmonic Helix with Switchqble Chirality. J. Am.
Chem. Soc., 2018, 140, 11763-11770.
[56] Cheng, J.; Le Saux, G.; Gao, J.; Buffeteau, T.; Battie, Y.; Barois, P.; Ponsinet, V.; Delville, M.-H.; Ersen, O.; Pouget, E.; Oda, R. GoldHelix : Gold Nanoparticles forming 3D helical superstruc-tures with controlled morphology and strong chiropitcal prop-erty. ACS Nano, 2017, 11, 3806-3818.