A Note on Monitoring Daily Economic Activity Via Electronic Transaction Data
12
0
0
Texte intégral
(2) CIRANO Le CIRANO est un organisme sans but lucratif constitué en vertu de la Loi des compagnies du Québec. Le financement de son infrastructure et de ses activités de recherche provient des cotisations de ses organisations-membres, d’une subvention d’infrastructure du Ministère du Développement économique et régional et de la Recherche, de même que des subventions et mandats obtenus par ses équipes de recherche. CIRANO is a private non-profit organization incorporated under the Québec Companies Act. Its infrastructure and research activities are funded through fees paid by member organizations, an infrastructure grant from the Ministère du Développement économique et régional et de la Recherche, and grants and research mandates obtained by its research teams. Les partenaires du CIRANO Partenaire majeur Ministère du Développement économique, de l’Innovation et de l’Exportation Partenaires corporatifs Banque de développement du Canada Banque du Canada Banque Laurentienne du Canada Banque Nationale du Canada Banque Royale du Canada Banque Scotia Bell Canada BMO Groupe financier Caisse de dépôt et placement du Québec DMR Fédération des caisses Desjardins du Québec Gaz de France Gaz Métro Hydro-Québec Industrie Canada Investissements PSP Ministère des Finances du Québec Power Corporation du Canada Raymond Chabot Grant Thornton Rio Tinto Alcan State Street Global Advisors Transat A.T. Ville de Montréal Partenaires universitaires École Polytechnique de Montréal HEC Montréal McGill University Université Concordia Université de Montréal Université de Sherbrooke Université du Québec Université du Québec à Montréal Université Laval Le CIRANO collabore avec de nombreux centres et chaires de recherche universitaires dont on peut consulter la liste sur son site web. Les cahiers de la série scientifique (CS) visent à rendre accessibles des résultats de recherche effectuée au CIRANO afin de susciter échanges et commentaires. Ces cahiers sont écrits dans le style des publications scientifiques. Les idées et les opinions émises sont sous l’unique responsabilité des auteurs et ne représentent pas nécessairement les positions du CIRANO ou de ses partenaires. This paper presents research carried out at CIRANO and aims at encouraging discussion and comment. The observations and viewpoints expressed are the sole responsibility of the authors. They do not necessarily represent positions of CIRANO or its partners.. ISSN 1198-8177. Partenaire financier.
(3) A Note on Monitoring Daily Economic Activity * Via Electronic Transaction Data John W. Galbraith†, Greg Tkacz‡ Résumé / Abstract Les économistes se sont traditionnellement appuyés sur les données mensuelles ou trimestrielles publiées par les agences centrales de statistiques pour suivre la situation macroéconomique. Cependant, les avancées technologiques qui ont été réalisées au cours des dernières années ont entraîné de nouvelles sources de données à haute fréquence, et ces dernières pourraient potentiellement donner lieu à une information plus exacte et plus opportune sur l’état actuel de l’activité économique. Dans le document actuel, nous explorons l’utilité des transactions électroniques comme indicateurs en temps réel de l’activité économique. Pour ce faire, nous recourons aux données canadiennes sur les cartes de débit et utilisons, à titre d’exemples, deux événements économiques susceptibles d’être importants. Plus particulièrement, nous sommes en mesure d’analyser la structure des dépenses lors des attaques terroristes du 11 septembre et de la panne d’électricité d’août 2003 et de noter des différences qualitatives dans les répercussions de ces événements, lesquelles ne pourraient être observées en recourant aux mesures globales. Mots clés : cartes de débit, transactions électroniques, suivi Economists have traditionally relied on monthly or quarterly data supplied by central statistical agencies for macroeconomic monitoring. However, technological advances of the past several years have resulted in new high-frequency data sources that could potentially provide more accurate and timely information on the current level of economic activity. In this paper we explore the usefulness of electronic transactions as real-time indicators of economic activity, using Canadian debit card data, and using two potentially important economic events as examples. In particular we are able to analyze expenditure patterns around the September 11 terrorist attacks and the August 2003 electrical blackout, and are able to note qualitative differences in the effects of these events which could not be observed through aggregate measures. Keywords: debit cards, electronic transactions, monitoring. Codes JEL : E17, E27, E66. *. We thank the Interac Organization, and in particular Eric Chue and Geoff Robinson, for supplying us with the data on debit card transactions, and Bryan Campbell and Steve Murphy who provided vintage macroeconomic data through CIRANO (Centre Interuniversitaire de recherche en analyse des organisations). Workshop participants at the Bank of Canada, Canadian Economics Association, the CIRANO workshop on Data Revision in Macroeconomic Forecasting, The 2008 World Congress on National Accounts and Economics Performance Measures for Nations, Statistics Canada, Carleton and McGill universities offered valuable comments and suggestions, and we thank especially Jason Allen, Jean-Marie Dufour, Bob Fay, Sharon Kozicki, and Varya Taylor. Stephen Doxey and Timothy Grieder provided fine research assistance. The views expressed by Tkacz in this paper are exclusively his own and should not be attributed to the Bank of Canada. † John W. Galbraith, Department of Economics, McGill University, 855 Sherbrooke St. West, Montreal, Quebec H3A 2T7, Canada. Email: John.Galbraith@cirano.qc.ca. ‡ Research Department McGill University Bank of Canada, 855 Sherbrooke St. West 234 Wellington St., Montreal, Quebec, Canada Ottawa, Ontario, Canada, H3A 2T7 K1A 0G9..
(4) 1. Introduction Although some indicators of aggregate economic activity are available monthly, the key measures such as gross domestic product are produced at a quarterly frequency. As a result, the short-term impacts of even quite large economic events are undetectable, being obscured by aggregation over time and geographical regions. For example, Hurricane Katrina was the most costly storm in U.S. history, causing damage estimated at over $80 billion and stopping economic activity in the region of New Orleans for an extended period. Nonetheless, its impact is essentially unobservable in U.S. GDP measures; Katrina made landfall in Louisiana on August 29, 2005, but GDP data continued their steady upward progression following this period without obvious interruption.1 In this note we suggest a preliminary step toward to alleviating this observational problem, using electronic transaction data. Technological advances of the last several years have resulted in numerous forms of electronically-recorded data that have not yet been fully exploited by economic analysts. Check-out scanners in stores are probably the best known source of “new” economic data. A limitation of check-out data for macroeconomists, however, is that they are largely proprietary and so nationwide aggregations are seldom found, although limited aggregation of such data is often performed by external firms for the analysis of a specific product or industry. For this reason, scanner data are most often used in economics in the context of empirical industrial organization studies, e.g. Shankar and Bolton (2004). In macroeconomics, scanner data use has largely been limited to the assessment of overall price movements, e.g. Burstein, Eichenbaum and Rebelo (2005), Hausman and Leitbag (2004) and Silver and Heravi (2001, 2005).We know of no study that has considered scanner data as an indicator of current economic activity, likely because of the aggregation problem mentioned above. In the present study we are interested in illustrating the potential usefulness of such electronically recorded transactions data for very short term macroeconomic event studies. A distinct but related recent literature uses mixed frequencies (usually monthly and quarterly) of economic data to provide high-frequency (even daily) monitoring of the macroeconomy, incorporating new estimates of measured quantities on the day at which they become available; see in particular Evans (2005) and Aruoba et al. (2009). Such studies produce daily sequences of estimates of economic indicators, but in general use measurements taken at a lower frequency; they are intended to incorporate efficiently new information arriving at different dates and frequencies, but not in general to trace the impacts of very transitory events which will show up to a very limited degree in monthly data. By contrast, the present study does not attempt full GDP measurement at the daily frequency, but instead traces highly transitory events through data which are more limited in scope, but are actually measured daily with high accuracy. 1. The values of U.S. real GDP, in billions of chained year-2000 dollars, seasonally adjusted at annual rates and rounded to the nearest integer, are 10946, 11050, 11086, 11217, 11291 for the quarters dated 01.04.2005 through 01.04.2006. 1.
(5) We would want any potential data source of this type to be broadly defined, thereby capturing economic activity across sectors; to be compiled by a single source, for timeliness; and to be measured accurately, with known transaction date (and, ideally, time of day). One such data source is electronic debit card purchases. Debit cards are a relatively new means of payment whereby a consumer can pay for a purchase by having funds directly withdrawn from his or her bank account. There are a number of benefits that we can identify with these data: a purchase made using a debit card results in an immediate rise in personal consumption expenditures, which is the largest component of GDP; debit card transactions are recorded instantaneously and electronically, thereby minimizing errors; at least in the case of Canada, a single entity (the Interac Organization) aggregates all transactions, so that reliable consumption statistics are available on a daily (and in principle higher) frequency. Note that we wish to distinguish actual purchases made with debit cards from cash withdrawals; the latter may be treated differently, since the funds withdrawn can be used for consumption at a later date. This note uses such debit card data to measure the short-term impact in Canada of two well-known events, at a daily frequency which would be unattainable using monthly or quarterly official data: in particular, we examine the September 11 terrorist attacks and the August 2003 electrical blackout. The ex-post ‘monitoring’ that we produce would have been possible at the time of the events with a one-day time lag, and so presents both a reasonable qualitative indication of the impacts of these events, and an indication of information that would have been available to policy makers at the time. 2. Debit card data One reason that Canadian debit card data provide a useful example of the value of electronic transactions data lies in the fact that Canadians are among the most intensive users of this means of payment, already averaging nearly 82 transactions per person, or about one every four days, by 2003. Pilot projects for debit card terminals were launched in Canada in 1991, and adoption of the technology has grown steadily ever since.2 With 86 per cent of Canadians owning a debit card, it has become the preferred means of payment for many individuals since 2000. In 2004, 47 per cent of transactions were conducted with debit cards, compared with 29 per cent with cash, 20 per cent with credit cards and fewer than 4 per cent with cheques. By contrast, in the United States the general adoption of this new technology has been slower. Gerdes et al. (2005) note that the number transactions using electronic means of payment (which includes both credit and debit card transactions) only exceeded the number of cheque payments for the first time in 2003. Furthermore, for that year in the United States the number of debit card transactions (15.6 billion) lagged 2. Debit card transactions per inhabitant in 2003 were 81.7 in Canada, 74.6 in Sweden, 71.2 in the Netherlands, 70.6 in France, 63.4 in the U.S., and 56.7 in the UK. (Source: Interac Organization) 2.
(6) credit card transactions (19 billion), although this is no longer the case (Borzekowski et al. 2008). Humphrey, Pulley and Vesala (2000) outline some reasons for the fact that adoption of electronic payments technology has been somewhat slower in the United States than elsewhere. Borzekowski et al. study consumer use of debit cards in the U.S. in detail, relating their use to demographic factors and pricing of card transactions, and in particular are able to estimate the response of debit card use to transaction fees. In Canada, where over 2.8 billion debit card transactions were made in 2004, the nominal dollar value of debit card purchases amounted to $124 billion that year. With GDP of $1.29 trillion, debit card purchases represented 10 per cent of the economy’s expenditures. Since debit card expenditures are almost exclusively assigned to households, we further note that these purchases represented 17 per cent of total household expenditures ($721 billion). In short, debit card purchases can allow us to measure accurately, and at a very high frequency, significant components of consumption and GDP. As well, changes in other components of GDP, with the possible exception of government expenditures, will tend to be positively correlated with changes in debit purchases. In Figure 1 we plot total debit card transactions, aggregated to a monthly frequency, as compiled by the Interac Organization.3 Two features immediately emerge from this series: (i) transactions exhibit a strong seasonal pattern, with relative peaks occurring in the second and fourth quarters, and troughs in the first and third quarters; and (ii) transactions have shown very rapid growth, far exceeding that of the overall economy, increasing from about 1.5 million in December 1992 to well over 200 million by the end of 2007. Since our measurements of the state of the economy are typically based on seasonally adjusted data, we also show in Figure 1 a seasonally adjusted debit card series created using X11-ARIMA, the same procedure used to adjust the National Accounts data. The resulting seasonally adjusted series is divided by the same constant used for raw transactions. The second feature just noted is largely attributable to growth in the adoption of the new technology. The real economy grew by about 50% between 1992 and 2007, and debit card transactions grew by around 15,000%.. 3. In order to preserve the confidentiality of these numbers, the data are divided by a constant, which is not a simple power of 10. The numbers on the vertical axis are therefore not meaningful, but relative sizes are preserved. 3.
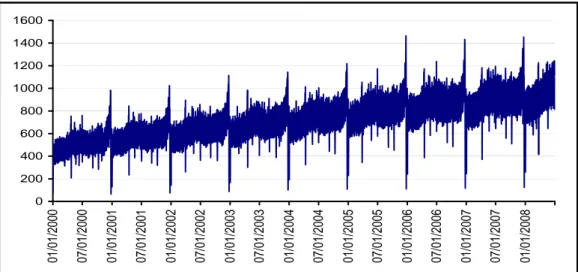
(7) Figure 1 Re-scaled number of monthly debit card transactions Raw and seasonally adjusted, Dec 1992–Dec 2007 300000 250000 200000 150000 100000 50000 0. 2 3 4 5 6 7 8 9 0 1 2 3 4 5 6 7 c-9 ec-9 ec-9 ec-9 ec-9 ec-9 ec-9 ec-9 ec-0 ec-0 ec-0 ec-0 ec-0 ec-0 ec-0 ec-0 De D D D D D D D D D D D D D D D Total. SA. Figure 2 shows a corresponding series of daily transactions. While details are obscured by the number of data points in this case, there are very strong day-of-week and holiday effects which are visible in the figure.. Figure 2 Re-scaled number of daily debit card transactions Unadjusted, 1 Jan 2000–30 June 2008 1600 1400 1200 1000 800 600 400 200. 4. 01/01/2008. 07/01/2007. 01/01/2007. 07/01/2006. 01/01/2006. 07/01/2005. 01/01/2005. 07/01/2004. 01/01/2004. 07/01/2003. 01/01/2003. 07/01/2002. 01/01/2002. 07/01/2001. 01/01/2001. 07/01/2000. 01/01/2000. 0.
(8) These data are available immediately after the close of the business day. As a result, the ex post event studies described in the next section could in principle have been carried on as real-time monitoring of economic events. 3. High-frequency analysis of selected shocks This note considers using these data to track the economic impacts of highly transitory events. Judging these impacts requires a data source that is recorded precisely, at high frequency, and where the date of the economic activity being measured is known. Our aim is to discern whether any impact of particular extreme events can be observed in the few days surrounding the events. To this end we need to account for predictable effects on transactions, in particular the day-of-the-week and holiday effects noted above with respect to Figure 2, so that we can identify genuinely unusual features. The examples used here are two especially significant events arising in the post-2000 data. 3.1 September 11 terrorist attacks The terrorist attacks of September 11 2001 had, of course, little direct impact in Canada apart from the diversion of some flights because of closed U.S. airspace. However, the magnitude and visibility of the attacks suggest a possible disruption of activity well outside directly affected areas: from approximately 9:30 in the morning, news of the events spread rapidly and attracted viewers to news sources to an almost unprecedented degree. September 11 2001 was a Tuesday, eight days after Labour Day. Considerable variation in the daily transaction total is visible in the vicinity of Labour Day, as Figure 3 indicates. Moreover, regular peaks in transactions occur on Fridays and troughs on Sundays. The transactions on 3 September 2001 were slightly over 3 million, well below the typical Monday average for that quarter of over 4 million. To measure the extent of the drop in transactions on September 11 relative to a forecast value, we standardize the observed transactions around this date to remove predictable effects, as Zt = σ ˆ −1 (Dt − D), where Dt is the value of debit card transacP4 tions at time t, D = 13 i=2 Dt−7i , and the σ ˆ is the standard error of the observations used. Note that since transactions regularly vary according to the day of the week, we are subtracting the mean of observed transactions for the particular day of the week. Furthermore, since a holiday observation (i.e. Labour Day) occurs in the week before 9/11, we compute this mean using the data from 2, 3 and 4 weeks prior (i.e. 14, 21 and 28 days before), rather than using the one-week-earlier data. This standardization is performed for both 2000 and 2001. Of course, variations on this standardization procedure are possible, but any sensible method must control for holiday and day-of-the-week effects. In Figure 3 we plot the standardized values for the equivalent periods in 2000 and 2001. In making the comparison, the equivalent period in 2000 is defined by Labour day: time t in the graphs is September 11 in the 2001 data, which was the 8th day after 5.
(9) Labour Day; hence time t in the 2000 data is eight days after Labour Day as well (note that this is the same day of the week in each case, as Labour Day is always a Monday).. Figure 3 Standardized transaction values in the vicinity of Labour Day + 8 days (date t), 2001 and 2000. 2 1 0 -1 -2 -3 -4. 8 t-1. 6 t-1. 4 t-1. 2 t-1. 0 t-1. t-8. t-6 2000. t-4. t-2. t. t+2. t+4. t+6. 2001. We observe that the series are very similar for each year. They peak prior to Labour Day (t-8), drop by an equivalent amount on Labour Day, and then follow a similar pattern thereafter. On 9/11 we see that transactions in 2001 were only slightly below their (relative) equivalent 2000 levels. In fact, a similar gap exists around four days prior to Labour Day (t-12), where consumers in 2001 were relatively less active than in 2000. The small relative gap was closed by t+2, indicating that any anomalous drop in debit card transactions on September 11 was back to its equivalent 2000 levels on September 14. However, this gap is itself well within normal variation. The difference between the standardized values for 2000 and 2001 in Figure 3 at times t, t+1 and t+2 would translate into a point estimate of net loss of 461,000 debit card transactions, or about 10% of a single day’s number of transactions in 2001Q3. Nonetheless, the difference between the two years’ standardized values is well within one standard error, and indeed the September 11 2001 value is only slightly more than one standard error below the mean. That is, the estimated direct impact of the terrorist attacks in terms of lost or postponed consumption in Canada was relatively small in absolute terms, and well within the range of normal variation. While the September 11 attacks no doubt had very substantial effects on economic activity which would be observable in data specific to New York State or, of course, New York City, we can discern little impact in Canadian data despite the mass distraction from economic 6.
(10) activity that might have been anticipated. 3.2 The blackout of August, 2003 Around 4:00 pm on Thursday August 14, 2003, a power failure affected nearly 50 million households throughout most of Ontario and several U.S. states. Power was gradually restored over the next 48 hours, but the effect of the failure lingered for over a week as businesses and government were urged not to resume normal operations in an effort to conserve energy and reduce stress on the fragile power grid; for example, many government workers in Ottawa did not return to work until 25 August. This section analyses the short-term impact of this blackout. Holidays around this period in 2003 were observed on 4 August (Civic Holiday) and 1 September (Labour Day), where reductions in transactions are seen in each case. Even in the raw transaction data (not recorded here), an unusual change in the series is evident on the first day of the blackout, 14 August. Transactions on this and subsequent days were below the usual values that we typically observe on Thursdays (August 14) and Fridays (August 15). For comparison in analyzing the impact of the blackout, in Figure 4 we plot standardized transactions, computed as described above, relative to the third quarter of 2002 in which there were no major shocks. As in the previous section, we match dates in a comparison year to compare with the same days of the week and major holidays. Time t in this figure represents the 10th day after the Civic Holiday. In 2003 this corresponded with 14 August; in 2002, t was 15 August. Since the Civic Holiday is always a Monday, the days of the week correspond as well.. Figure 4 Standardized transaction values in the vicinity of the August Civic Holiday + 10 days (date t), 2003 and 2002 3 2 1 0 -1 -2 -3. 2002. 7. 2003. t+ 12. t+ 10. t+ 8. t+ 6. t+ 4. t+ 2. t. t-2. t-4. t-6. t-8. t-1 0. t-1 2. t-1 4. -4.
(11) We observe that the series are very similar for each year; transactions drop sharply on the Civic Holiday, and then follow a similar pattern thereafter. However, on the day of the blackout in 2003 we see that transactions show another sharp drop relative to their equivalent 2002 levels; standardized transactions on the day of the blackout were similar to those observed on the Civic Holiday. We also observe that the relative gap was largely closed by t+2, indicating that following the drop on 14 August and 15 August, debit card transactions returned to their (relative) equivalent 2002 levels on Saturday, 16 August. Nonetheless, 2003 transactions did remain below their 2002 levels through 19 August, likely reflecting the fact that normal business activities did not fully resume in some areas for about one week following the blackout. The difference (of over two standard errors) between the standardized values for 2002 and 2003 in Figure 4 at times t and t+1 translates into a net loss of about 1.9 million debit card transactions, or about 28% of a single day’s transactions for a typical Thursday or Friday in August of 2003. Of course, in the absence of electricity some transactions would have been conducted using cash instead of debit cards. However, we surmise that such a substitution of payments methods would have only occurred for a small number of transactions, since many businesses were forced to close during the power outage, and unless households were holding cash at the time of the blackout, cash was difficult to obtain since ATMs were also not functioning. Furthermore, we observe that since the blackout occurred at 4pm on a Thursday and lasted for most of Friday in many places, it disturbed particularly busy consumption days, which may have contributed to a relatively large impact on consumption. The availability of even higher-frequency data (e.g. hourly basis) would allow us to measure the impact of the blackout on an even finer basis. 4. Conclusion This note investigates the usefulness of a type of electronically recorded transaction data for very short term macroeconomic monitoring, which is permitted by the daily recording of observations. Although the debit transaction data that we use are limited in their time span, they are available daily from the beginning of 2000, allowing us to investigate two important historical events: our examples trace the very short term impacts on consumption around September 11 2001, and around the August 2003 electrical blackout. Since no national accounts data are available at this frequency, economists have traditionally had difficulty analyzing the direct impacts of such events, but with electronic transaction data we are able to monitor an indication of consumption behaviour through these periods. We find that the decreased consumption in Canada around September 11 was well within the range of normal variation; for the electrical blackout we find a clear drop in consumption as measured by debit transactions. In either case we note that the debit card data allow study of such events in a form not previously possible. One could in principle further refine our estimates of the economic impacts of these shocks by relying on still higher-frequency (e.g. hourly) transactions data, and 8.
(12) by using dis-aggregated regional data. Similarly, given that larger purchases are often made using credit cards, it would be useful to combine the debit card transactions with credit card transactions in order to provide a richer high-frequency picture of household expenditure habits. In any event, it is apparent that expansion of our data resources to include electronic transaction data offers considerable potential for increasing our understanding of the short-term impacts of external shocks to the economy.. References Aruoba, S.B., F.X. Diebold and C. Scotti (2009) “Real-time Measurement of Business Conditions.” Forthcoming, Journal of Business and Economic Statistics . Borzekowski, R., E.K. Kiser and S. Ahmed (2008) “Consumers’ Use of Debit Cards: Patterns, Preferences, and Price Response.” Journal of Money, Credit and Banking 40, 149-172. Burstein, A., M. Eichenbaum and S. Rebelo (2005) “Large Devaluations and the Real Exchange Rate.” Journal of Political Economy 113, 742-784. Chevalier, J.A., A. K. Kashyap and P.E. Rossi (2003) “Why Don’t Prices Rise During Periods of Peak Demand? Evidence from Scanner Data.” American Economic Review 93, 15-37. Demers, F. (2006) “National Accounts Statistics in Canada: How Important Are the Revisions and Can We Improve our Quarterly Assessment?” Working paper. Evans, M.D.D. (2005) “Where Are We Now? Real-time Estimates of the Macroeconomy.” International Journal of Central Banking 1(2), 127-175. Gerdes, G. R., J. K. Walton, M. X. Liu, D. W. Parke (2005) “Trends in the Use of Payment Instruments in the United States.” Federal Reserve Bulletin 91 (Spring), 180-201. Hausman, J. and E. Leibtag (2004) “CPI Bias from Supercentres: Does the BLS Know that Wal-Mart Exists?” NBER Working Paper 10712. Humphrey, D. B., L. B. Pulley and J. K. Vessala (2000) “The Check’s in the Mail: Why the United States Lags in the Adoption of Cost-Saving Electronic Payments.” Journal of Financial Services Research 17, 17-39. Shankar, V. and R. N. Bolton (2004) “An Empirical Analysis of Determinants of Retailer Pricing Strategy.” Marketing Science 23, 28-49. Silver, M. and S. Heravi (2001) “Scanner Data and the Measurement of Inflation.” Economic Journal 111, F383-F404. Silver, M. and S. Heravi (2005) “A Failure in the Measurement of Inflation: Results from a Hedonic and Matched Experiment Using Scanner Data.” Journal of Business and Economic Statistics 23, 269-281. 9.
(13)
Figure
Documents relatifs
This activity transforms the desired UX business impact and the understanding of users’ and system’s world into concrete, measurable UX design targets.. Further, it is useful
Commanders of high performing teams have in shift 4 a stronger inhibition that a New Message is followed by a Show Information or that a Show Information is fol- lowed by a
The structure and recommendations for the deployment of a hardware and software stand for testing algorithms for detecting financial fraud on the basis of data mining analysis as
Keywords: community, daily life, people’s movement, poor neighborhoods, social protest, South Africa... South Africa has, since the late 1990s, witnessed an almost
By comparing the observed spectra with the calculated spectra, the following information can be obtained: (a) the number of single attosecond emissions that contribute to the
One of the advantages claimed for globalisation is that it increases business competition and that consequently, it raises economic efficiency which in turn could increase global
transport truck forgot to break on the Ruby Line, the doctors never put all the bones in my back in their rightful place. For years, I could feel something was wrong. It only
Regarding the main travel mode of their trips over a five working days period Velov annual members use Velov for only 22% of their trips: this is a first indication that Velov
