Five Indefinitely Repeated Games in the Laboratory
33
0
0
Texte intégral
(2) CIRANO Le CIRANO est un organisme sans but lucratif constitué en vertu de la Loi des compagnies du Québec. Le financement de son infrastructure et de ses activités de recherche provient des cotisations de ses organisations-membres, d’une subvention d’infrastructure du Ministère du Développement économique et régional et de la Recherche, de même que des subventions et mandats obtenus par ses équipes de recherche. CIRANO is a private non-profit organization incorporated under the Québec Companies Act. Its infrastructure and research activities are funded through fees paid by member organizations, an infrastructure grant from the Ministère du Développement économique et régional et de la Recherche, and grants and research mandates obtained by its research teams. Les partenaires du CIRANO Partenaire majeur Ministère du Développement économique, de l’Innovation et de l’Exportation Partenaires corporatifs Alcan inc. Banque de développement du Canada Banque du Canada Banque Laurentienne du Canada Banque Nationale du Canada Banque Royale du Canada Banque Scotia Bell Canada BMO Groupe financier Bourse de Montréal Caisse de dépôt et placement du Québec DMR Conseil Fédération des caisses Desjardins du Québec Gaz de France Gaz Métro Hydro-Québec Industrie Canada Investissements PSP Ministère des Finances du Québec Raymond Chabot Grant Thornton State Street Global Advisors Transat A.T. Ville de Montréal Partenaires universitaires École Polytechnique de Montréal HEC Montréal McGill University Université Concordia Université de Montréal Université de Sherbrooke Université du Québec Université du Québec à Montréal Université Laval Le CIRANO collabore avec de nombreux centres et chaires de recherche universitaires dont on peut consulter la liste sur son site web. Les cahiers de la série scientifique (CS) visent à rendre accessibles des résultats de recherche effectuée au CIRANO afin de susciter échanges et commentaires. Ces cahiers sont écrits dans le style des publications scientifiques. Les idées et les opinions émises sont sous l’unique responsabilité des auteurs et ne représentent pas nécessairement les positions du CIRANO ou de ses partenaires. This paper presents research carried out at CIRANO and aims at encouraging discussion and comment. The observations and viewpoints expressed are the sole responsibility of the authors. They do not necessarily represent positions of CIRANO or its partners.. ISSN 1198-8177. Partenaire financier.
(3) *. Five Indefinitely Repeated Games in the Laboratory Jim Engle-Warnick †. Résumé / Abstract Une étude expérimentale a été menée afin de tester les décisions prises lors de cinq jeux répétés où le nombre de répétitions est inconnu : un jeu de type hawk-dove, un jeu de type chicken, un jeu de confiance, un jeu de coordination et un jeu à somme constante. Les historiques des différents jeux sont comparés afin d’analyser les prises de décisions des participants dans chaque jeu. Mots clés : économie expérimentale, jeux répétés. I experimentally test play in five indefinitely repeated games: a hawk-dove game, a game of chicken, a trust game, a coordination game, and a constant-sum game. I compare the different game histories that affect decision making in each of the games. Keywords: experimental economics, repeated games. *. I thank Sara Constantino and Julie Héroux for research assistance. I thank the Social Science and Humanities Research Council, the Centre for Interuniversity Research and Analysis on Organizations (CIRANO) for funding, and the Bell University Laboratory in Electronic Commerce and Experimental Economy for use of the experimental laboratory. † Department of Economics, 855 Sherbrooke St. W., McGill University, Montreal, Québec, H3A 2T7, Canada, email: [email protected], tel.: (514) 398-1559; fax: (514) 398-4938..
(4) 1. Introduction. This paper is an experimental study of five different indefinitely repeated games. The games are a hawk-dove game (which also has the form of the prisoner’s dilemma) with a dominant strategy in the one-shot game, a chicken game with two pure and one mixed strategy equilibrium, a coordination game with two pure strategy and one mixed strategy equilibrium, a trust game that can be solved by iterated dominance, and a constant sum game with a unique mixed strategy equilibrium. In the experiments, subjects are randomly paired to play an instance of a repeated game, which is called a supergame. I implement the discount factor using a constant and independent continuation probability of 0.8 after each round within a supergame, thus the expected length of a supergame is five rounds. I drew four sequences of 20 supergame lengths before the sessions, and used the same four sequences for each of the five games I tested.1 In all the relevant games, the discount factor admits cooperative equilibria in the infinitely repeated game, even when none exist in the one-shot game. I find that behavior varies as one would expect it to theoretically across these games. I find heterogeneity in sessions both within and across the different games. I find evidence for behavior consistent with tit-for-tat in all but the constant sum game. I find evidence for grim in the trust and coordination games. The time t-1 decisions affects behavior in all games but constant sum, which is surprising because serial correlation is typically found in repeated constant sum games. Past studies of indefinitely repeated games in the lab have shown how players learn to trust each other over time (Engle-Warnick and Slonim, 2006b), revealed the repeatedgame strategies that describe the actions of the players (Engle-Warnick and Slonim, 2006a), provided formal tests of repeated-game equilibria by varying the discount rate (Dal Bo 1. Engle-Warnick and Slonim (2006b) show that the realization of the supergame lengths can effect behavior..
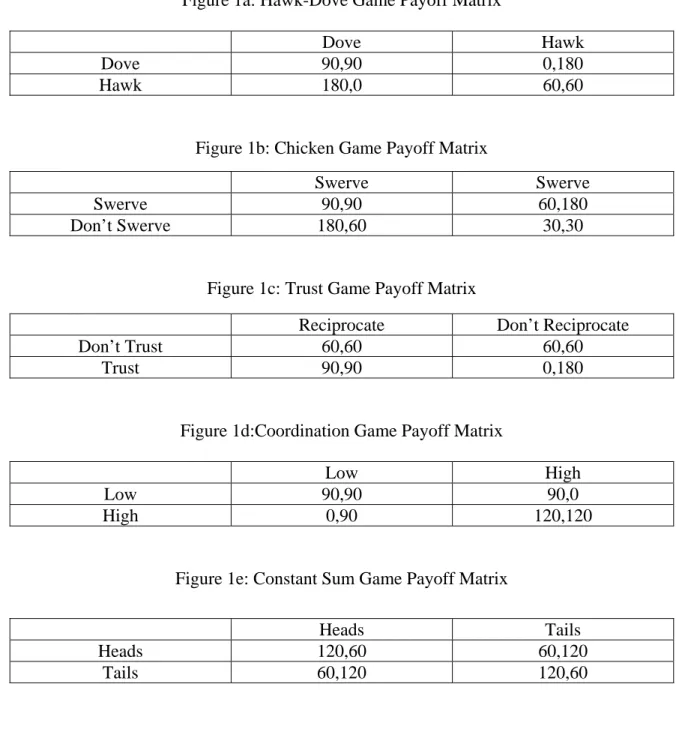
(5) andFrechette, 2007), tested the effect of the termination rule on cooperation (Normann and Wallace, 2006), or tested theories of contagion in population games (Duffy and Ochs, 2006). Selten and Stoeker (1986) show how subjects learn to backward induct in a finitely repeated game. By contrast, in this study I hold the discount rate constant and tests for differences in behavior that we might expect to see across the five different games. The next section of the paper details the experimental design and procedures. The following section presents the experimental results. The final section concludes.. 2. Experimental Design and Procedures. 2.1. Experimental Design. Figure 1 presents the payoff matrices for each of the five stage games. All five games are matrix games, with row and column player simultaneously choosing their stage game actions. For the experiments, the payoffs are in Canadian pennies. Figure 1a shows the payoff table for the Hawk-Dove game. If both players play “Dove”, they evenly split an amount of a resource equal to a total payoff of 180. If they both play “Hawk” strategy, they evenly split the 180 less a cost of 60 (i.e., (180-60)/2 for each player). And if one player plays “Hawk” while the other plays “Dove”, the Hawk takes the entire 180 for herself while the Dove earns 0. The equilibrium of the one-shot game is for both players to play Hawk. Figure 1b shows the payoff table for the Chicken game. In this game there are two strategies, “Swerve” and “Don’t Swerve”. In contrast with the Hawk-Dove game, the idea was to make the mutual Don’t Swerve decision more costly than the mutual Hawk decision; thus if neither player swerves they each earn 30. If both players swerve, then the payoffs are the same as when both players select “Dove” in the Hawk-Dove game: 90. If one swerves and the other does not, the swerver earns the payoff of 60 for surviving the game but being 2.
(6) embarrassed for swerving, while the player who does not swerve gets the maximum payoff of 180. Figure 1c shows the payoff table for the Trust game. This is a standard trust game but with strategies chosen simultaneously. The row player is the trustor and the column player the trustee. the row player can end the game by choosing “Not Trust” causing both players to earn 60; this is the equilibrium outcome for the one-shot game. The row player can choose “Trust”, in which case the column player chooses between taking the gains from trust for herself or splitting them evenly. I included this game because it the payoff table is asymmetric. I designed each of these three games to have an identical minimum discount factor in the repeated game to support a cooperative outcome in equilibrium in the infinitely repeated game. For example, in the Hawk-Dove game, for both player to select ”Dove” in equilibrium, it is necessary to specify a punishment of “Hawk” forever if a deviation is ever detected, then the minimum discount factor required to sustain this outcome in equilibrium is determined by the following inequality: 90 δ ≥ 180 + 60 , 1−δ (1 − δ) and in the Chicken Game, for “Swerve”, “Swerve” to be played repeatedly in equilibrium, “Don’t Swerve” must be triggered forever if a deviation is detected, and the minimum discount factor is determined by: 90 δ ≥ 180 + 60 , 1−δ (1 − δ) and finally, in the Trust Game, for “Trust”, “Reciprocate” to be played repeatedly in equilibrium, “Don’t Trust” must be triggered forever if a deviation is detected, and minimum discount factor is determined by: δ 90 ≥ 180 + 60 . 1−δ (1 − δ) 3.
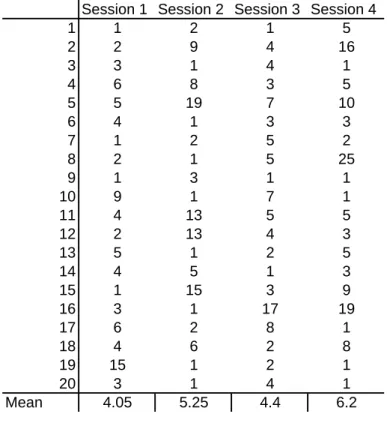
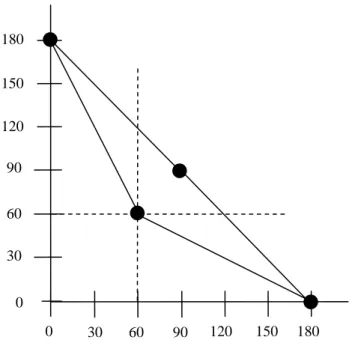
(7) All three inequalities are identical, leading to identical incentives for full cooperative play in the infinitely repeated game, and a minimum discount factor of 0.75 to sustain the equilibrium. The design discount factor of 0.80 is just above this minimum threshold. Figure 1d shows the payoff table for the Coordination game. There are two equilibria of the one-shot game: one where the players each play “Low” and earn 90, and one where they each play “High” and earn 120. The risk in this game is that if the other player is not rational, and does not choose the strategy for the payoff dominant equilibrium, then one earns nothing in this game. Figure 1e shows the payoff table for the Constant Sum game. The mixed strategy equilibrium of the one-shot game calls for the players randomizing over their stage-game strategies “Tails” and “Heads” with probability one-half. I included this game as a control because repeated-game strategies should be less salient in this game. Figures 2a - 2e show the convex hull of average per period payoffs possible in each of the five games. For the constant-sum game, the only possible average payoffs lie on the line between the two possible outcomes. For all other games, payoffs within the surfaces are feasible, and by design, since the full cooperative outcome is always possible in equilibrium with the harshest possible punishment as a threat, anything individually rational for both players is possible in equilibrium. The cut-off for the individually rational payoff is denoted by the dashed line in each figure.. 2.2. Experimental Procedures. I conducted four sessions of each game. In each session the subjects played twenty supergames. The continuation probability within a supergame was a constant and independent 0.8. I drew the supergame lengths in advance of the session using a random number generator. I used a different sequence of supergame lengths in each of the four sessions, but across the different games I used the same four sequences of supergame lengths. Table 1 summarizes 4.
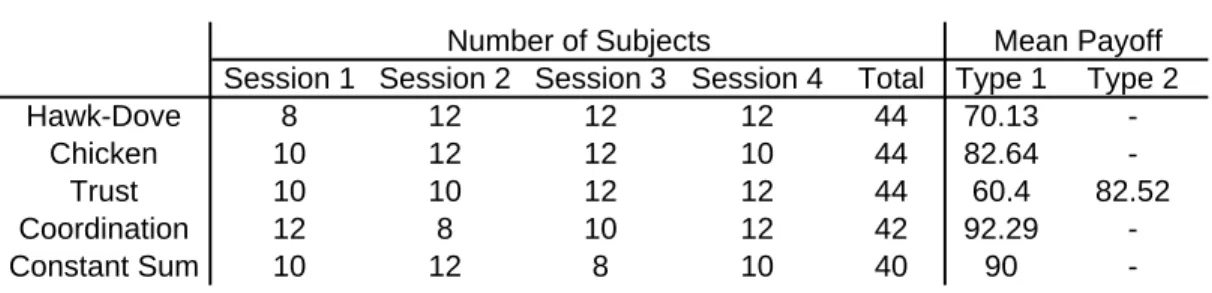
(8) the characteristics of each of these four sequences. It shows that the average within-session supergame lengths ranged from 4.04 to 6.2 rounds, and that the shortest maximum length in a session was 15 rounds, while the longest maximum length was 25 rounds. I randomly and anonymously re-paired the subjects for each supergame. Because the trust game is asymmetric, consisting of two types of players, it was necessary to split the population in half and pair the subjects across both halves. For comparison’s sake, I followed the same procedure in the symmetric games as well. Subjects were told the outcome of only their games, and the full history of their play was always available in a window with a scroll bar. I conducted the sessions using the software z-tree (Fischbacher, 1999). Table 2 details the number of subjects in each session for each game, and the mean payoff per round earned by the subjects. The table reveals that there was a minimum of 8 subjects and a maximum of 12 subjects across the sessions. For the treatments there was a minimum of 40 total subjects (Matching Pennies) and a maximum of 44 subjects (Chicken, Hawk-Dove, and Trust), with a total of 214 subjects in all. Average stage-game profits for the five different games ranged from 60.40 cents for trustors in the trust game (which is labeled ”type 1” in the table) to 92.29 cents in the coordination game. I paid the subjects for a randomly-chosen five supergames in order to control for wealth effects in an experiment that required a relatively large number of decisions (the expected number of decisions was 100).. 3 3.1. Experimental Results Hawk-Dove. Figure 3 shows the proportion of time subjects chose the action “Hawk”, in each period, in each supergame. The horizontal axis is labeled by supergame, from 1 to 20. For each supergame, the proportion of times subjects selected ”Hawk” is show for the first four rounds. 5.
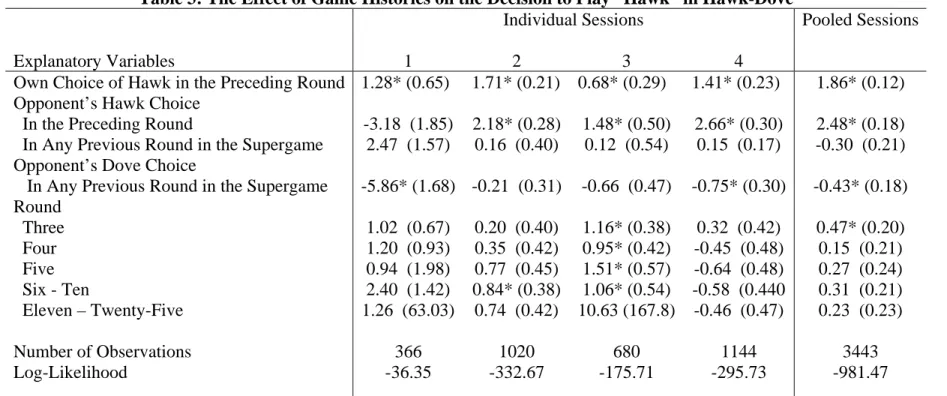
(9) The proportions were computed within each session, and then averaged across the four sessions. I limited the number of rounds to four because of the different supergame lengths in the different sessions; the more rounds, the less data available to average over. For example, in the first supergame, in the first round, subjects chose “Hawk” with a proportion of 0.5; in the second and third rounds of this supergame the proportion of “Hawk” play increased to about 0.65; and in the fourth round this proportion decreased to below 0.6. There are a few notable consistencies evident in this graph. First, across supergames, the overall proportion of “Hawk” play increases over time. Second, while this proportion increases, it appears to cycle, increasing to about the seventh or eight supergame, then decreasing to around the fourteenth supergame, and steadily increasing until the end of the session. Third, within supergames, this proportion increases more often than it decreases. Table 3 shows results from a regression to determine whether past game histories influence the decision to choose “Hawk”. The idea is to test for conditioning behavior consistent with repeated-game strategies that might be present in the data. The table reports results from a fixed-effects logit model. The dependendent variable is “Hawk”, and the regressions are run both with individual sessions (the first four columns), and with pooled sessions (the fifth column). For the regressions, we create an indicator variable in the data that takes the value of one whenever a particular game history occurs within a supergame. These sets of indicator variables correspond to the following histories: 1. The player’s own decision in the previous supergame round. 2. The opponent played “Hawk” in the immediately preceeding supergame round. 3. The opponent played “Hawk” in any previous supergame round. 4. The opponent played “Dove” in any previous supergame round.. 6.
(10) To control for time trends within supergames, I also included indicator variables for rounds 3, 4, 5, 6-10, and 11-25. I grouped round numbers greater than five into two groups because of the relatively fewer observations I have in the data for the longer supergames. Taking the game histories in turn, variable 1, the player’s own decision in the previous round controls for a kind of behavioral inertia from one period to the next. Variable 2, a response of “Hawk” for the opponent choosing “Hawk” would give evidence for the “tit-fortat” strategy, made famous in part due to its success in the tournament reported by Axelrod (1984). Variable 3, a response of “Hawk” for an opponent’s choice of “Hawk” in any previous round in the supergame would be evidence for “grim”, which makes cooperative repeatedgame equilibria possible in the games I study in this experiment. Variable 4, responding with “Dove” to “Dove” at any previous round in the supergame would be evidence for positive reciprocity (Fehr and Gachter, 2000), where a player responds to a nice action with a nice action. Conditioning on the round within a supergame is not theoretically relevant, nevertheless I control for subjects’ responses to round numbers for at least two reasons. First, EngleWarnick and Slonim (1986a) found that players of one type appeared to condition their behavior on round numbers in a two-stage indefinitely repeated trust game. Second, Selten and Stoeker (1986) found evidence in repeated finite supergame of learning backward induction strategies. I include the controls to test whether behavior is consistent with theoretical predictions of indefinitely repeated games. Looking first at the individual session regressions in Table 3, the subjects’ own “Hawk” decision in the previous period is always significant and postively correlated with “Hawk” in the current period. In three out of the four sessions, an opponent’s “Hawk” in the previous period increases the probability of “Hawk” in the current period of the supergame. In two of the four sessions, one and four, an opponent’s “Dove” any time previously in the supergame decreases the probability of “Hawk”. And in session 3, the probability of “Hawk” increases. 7.
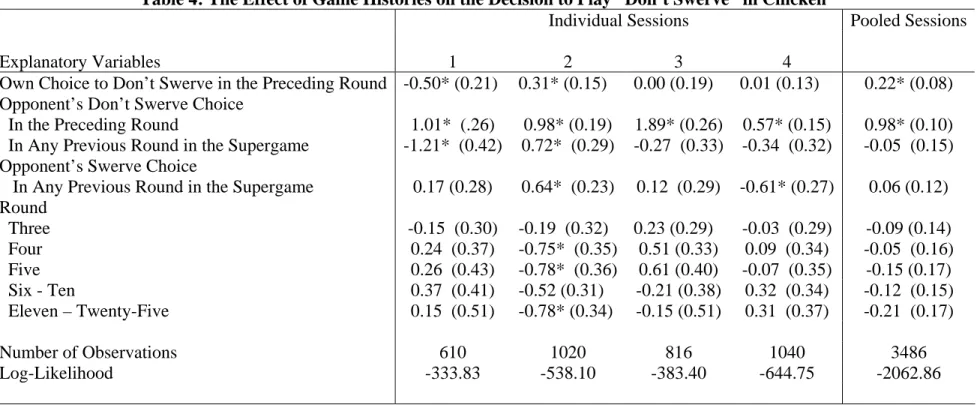
(11) as the supergame becomes longer. Thus in all sessions, “Hawk” is more likely to follow one’s own “Hawk”, “Hawk” is more likely to follow the opponent’s “Hawk” (tit-for-tat), and in two sessions “Dove” is more likely if the opponent ever played “Dove” (positive reciprocity). This behavior all survives the pooled regression as well. In one session, “Hawk” became increasingly likely as the supergame wore on. This seemed to be a feature only of that single session.. 3.2. Chicken. Figure 4 shows the proportion of times subjects chose ”Don’t Swerve” in the chicken game. This figure reveals a similar dynamic as the Hawk-Dove game. First, overall, the proportion of “Don’t Swerve” decisions increases with time. Second, there is cycling apparent again, though a bit less pronounced, with peaks at around supergames five and eighteen, and troughs at supergame one and eleven. Third, unlike in the Hawk-Dove game, the proportion of choices to not swerve decreases as often as it increases within supergames. Table 4 presents results from the same fixed-effects logit regressions as in the HawkDove game. In the regressions, the dependent variable is “Don’t Swerve”. The independent variables are the same as before. Looking first at the individual session regressions in Table 4, the only significant explanatory game history across all sessions is the opponent’s choice to play “Don’t Swerve” in the preceding round; this history increases the probability of choosing “Don’t Swerve” in all four sessions. As for the remaining game histories, one’s own choice in the preceding round, the opponent’s choice to play “Don’t Swerve” at any time previously in the supergame, and the opponent’s choice to play “Swerve” at any time previously in the supergame all enter the regression significantly in two of the four sessions, and all of them with opposite signs in each session. In one session, session 2, the probability of playing “Don’t Swerve” increases within a supergame. 8.
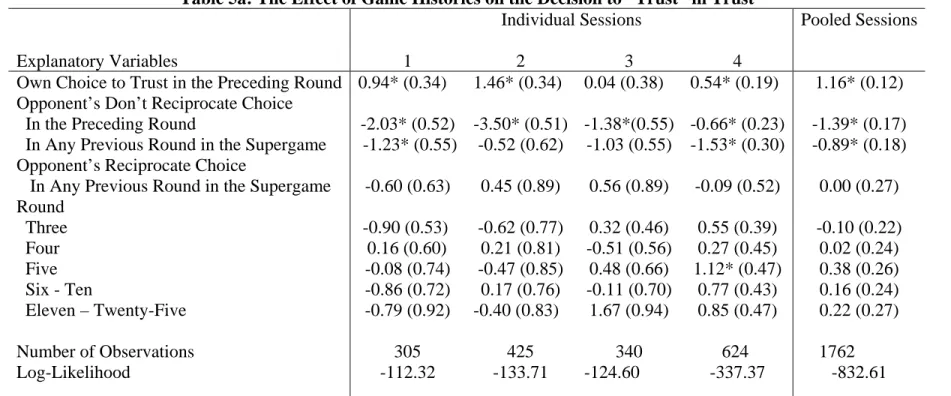
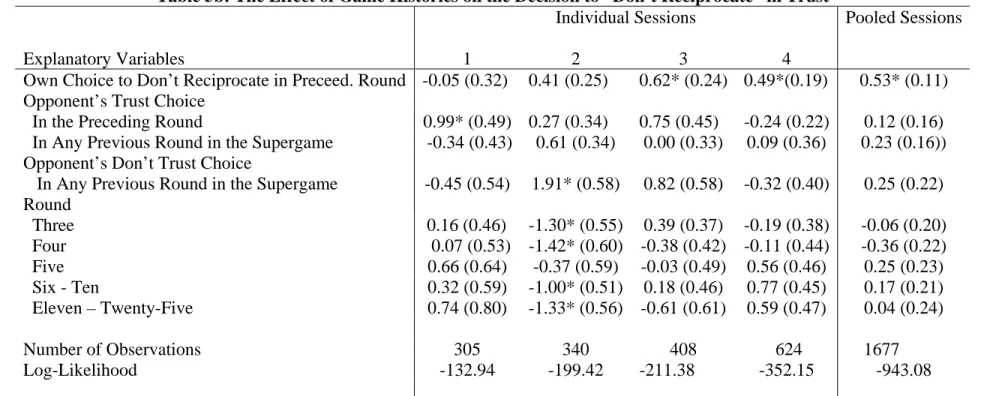
(12) Thus “Don’t Serve” for “Don’t Swerve” provides evidence for tit-for-tat behavior, with other game histories predicting in some sessions and not in others, and with different effects on the probability to choose “Don’t Swerve”. Again, in one session, I pick up a trend to become less cooperative as the supergame goes along. One’s own choice to play “Don’t Swerve” and the opponent’s choice to play “Don’t Swerve” in the previous round are also significant in the pooled regression.. 3.3. Trust. Figure 5a shows the proportion of times Trustors chose “Trust”, and Figure 5b shows the proportion of time Trustees chose “Do Not Reciprocate” in the trust game. Figure 5a reveals a slight upturn in trust until around supergame ten, followed by a slight downturn. This dynamic is mirrored by a slight upturn in not reciprocating followed by a downturn in Figure 5b. As Engle-Warnick and Slonim (2006b) found, trust declined within supergames but reset when the new supergame started. Table 5 presents results from fixed-effects logit regressions in the trust game. The table is divided into the two types of players in the game: trustors and trustees. Looking first at Table 5a, i.e., results from the trustors, one’s own decision to trust in the previous round increases the probability of trust, and the opponent’s decision not to reciprocate in the previous round decreases the probability of trust. In two sessions, sessions one and four, a failure to reciprocate at any time previously in the supergame increases the probability of “Don’t Trust”. In no session do I pick up any time trend within supergames. All three of these explanatory variables help to explain the decision to “Trust” in the pooled regression. Turning next to Table 5b, results for the trustees, I report fewer game histories that effect decisions, where the dependent variable is the decision to “Don’t Reciprocate”. In two of the four sessions, one’s own decision not to reciprocate in the previous round increases the 9.
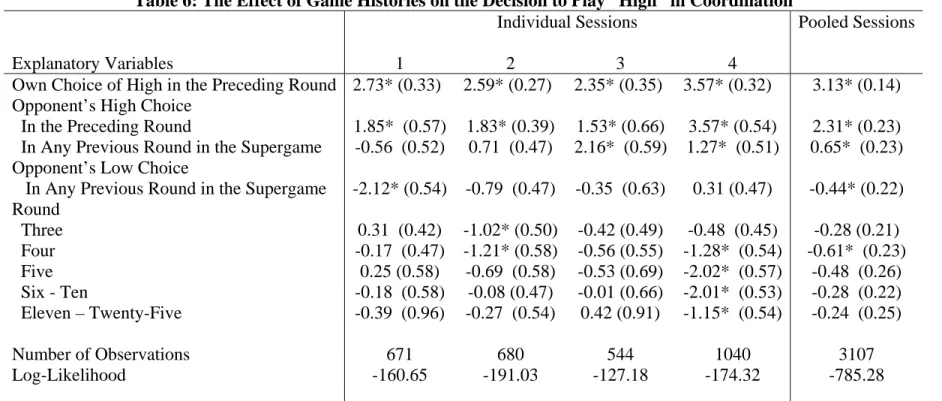
(13) probability of making the same decision in the current round. In only one session each do the opponent’s choice to trust in the previous round and decision to not trust in any previous round enter significantly into the regression, and the former variable has the opposite sign one would expect. In one session, session 2, I find the probability of “Do not Reciprocate” decreasing over time within the supergame. Thus I find evidence for tit-for-tat and grim behavior from the trustors (but not positive reciprocity), and little evidence for this type of strategic behavior from the trustees.. 3.4. Coordination. Figure 6 shows the proportion of times subjects chose the “High” action in the coordination game. This figure again reveals similar dynamics as in the Hawk-Dove and Chicken game. First, overall, the proportion of “High” choices increases over time. Second, there is apparent cycling with an initial dip at supergame three, a peak around supergame ten, a small dip at supergame twelve, and another peak at fourteen. Third, the proportion of ”High” choices tends to decrease within supergames, as subjects eventually opt for the safe choice guaranteeing a period payoff of ninety. Table 6 presents results from fixed-effects logit regressions for the coordination game. The dependent variable is the action “High”, and the independent variables are the same as before. Looking first at the individual sessions, both one’s own decision to play “High” and the opponent’s decisions to play “High” in the previous round of a supergame increase the probability of playing “High” the current round in all four sessions. In two of the four sessions, the opponent’s choice to play “High” at any time previously in the session increases the probability of “High”. In one session, “Low” from the opponent at any time previously in the supergame decreases the probability of “High”. And in one session, session 4, “High” is decreasing with time within a supergame. 10.
(14) Thus the probability of playing “High” is always positively associated with one’s own choice and with the opponent’s choice to play “High” in the previous round, the latter of which is evidence for tit-for-tat. In two of the four sessions I collect evidence for ‘positive reciprocity behavior, and in one session time within a supergame matters. In one session I find evidence for grim. In the pooled regression, one’s own decision, tit-for-tat, grim, and positive reciprocity all enter into the regression with the expected coefficient signs.. 3.5. Constant Sum. Figure 7 shows the proportion of time subjects chose the “Tails” action in the constant sum game. The figure reveals that this proportion changes within supergames, does not increase or decrease systematically within supergames, and is centered around the proportion of 0.5. Minimum and maximum proportions are also centered roughly between 0.25 and 0.75. Table 7 presents results from fixed-effects logit regressions for the matching pennies game. The dependent variable is the action “Tails”, and dependant variables are the same as before. The figure reveals that these regressions do not fit the data at all. None of the dependent variables help to explain the dependent variable. Thus in the repeated matching pennies game, as one would expect, I find no evidence for repeated-game strategies that condition on the history of the game. Furthermore, i find no evidence for serial correlation of play, controlling for the other game histories. This second finding contrasts with the findings of Brown and Rosenthal (1990), who re-examined the results in O’Neil (1987) and found that subjects’ behavior was predictable in zero sum games. These findings have been robust to subsequent studies. For example, Hopkins and Engle-Warnick (2006) presented an experimental design in which economic incentives should have improved subjects’ ability to randomize, but they did not. And Walker and Wooders (2001) found that experienced tennis players, though they did better, still did not randomize the location of their serves. 11.
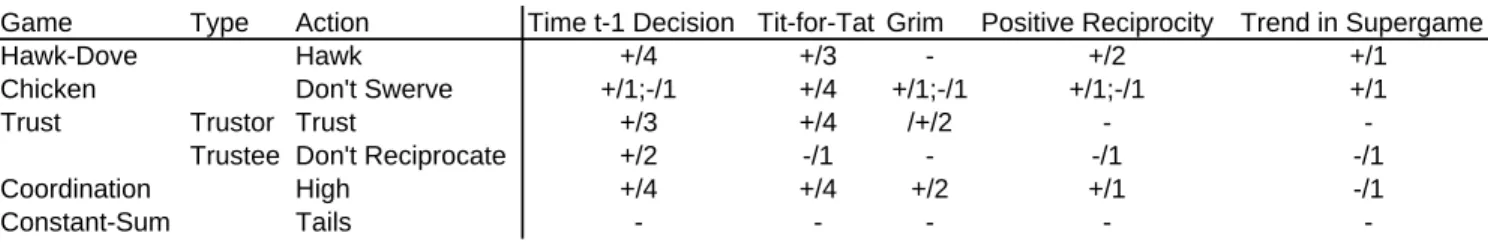
(15) 4. Discussion. Table 8 summarizes the result from the regressions for both the individual sessions (Table 8a) and the pooled sessions (Table 8b). Each cell of Table 8a presents whether a coefficient that predicts a strategic behavior is significant, whether it is positively or negatively associated with the behavior, and how many sessions in which this occurred. For example, the cell corresponding to Hawk-Dove and Tit-for-Tat contains the entry “+/3”. This communicates the fact that in three sessions the explanatory variable for this behavior was statistically significant in the direction predicted. A negative sign indicates a sign opposite the prediction, and two entries separated by a colon indicate opposite predictions for different sessions. From the table it is evident the sessions were heterogeneous both within and across the five treatments. However, there are strong regularities within sessions such as the explanatory power of the time t-1 decision and tit-for-tat in Hawk-Dove, tit-for-tat in Chicken, time t-1 decision and tit-for-tat with Trustors in Trust, and time t-1 decision and tit-for-tat in Coordination. With regard to lack of predictive power, Trustees are not well-predicted by any of the game histories and Constant-Sum behavior is not predicted at all. Although the latter finding may be considered unsurprising, it actually is surprising because there have been many studies documenting serial correlation in decisions in constant sum games. In this study, i find none. The pooled results reach much the same conclusions. Tit-for-tat is the strategy of choice in all games but Constant Sum for all players except Trustees. Trustors and players in Coordination show evidence for grim. Positive reciprocity appears to occur in Hawk-Dove and Coordination. Subjects appear to be using every game history they can to coordinate in the Coordination game, as evidenced by all the statistically significant signs in the direction of coordinating on the high outcome. And subjects in matching pennies are playing randomly through the lens of the regression.. 12.
(16) 5. Conclusion. I experimentally tested behavior in five indefinitely repeated games. I used the different games to provide evidence of different strategic behavior in the different environments. While other studies focus on the stopping rule or the continuation probability. I allow differences across the games to help explain subjects’ strategic behavior in repeated games. I found heterogeneity in sessions both within and across the different games. I found evidence for behavior consistent with tit-for-tat in all but the Constant Sum game. I found evidence for grim in the Trust and Coordination games. The time t-1 decisions affects behavior in all games but Constant Sum, which is surprising because serial correlation is typically found in repeated constant sum games. And subjects used all the histories I investigated to coordinate on the better outcome. In some individual sessions, cooperation of some type declines within the supergame while controlling for the other game histories, and in one (Chicken) it increases. Also only in Chicken, the sign of the effect of game histories is different in different sessions. This purpose of this study was to use comparisons between different games to better understand subjects’ strategic behavior in indefinitely repeated games. A robust finding among all the games except constant sum was tit-for-tat behavior. This finding merits further study, in light of Axelrod’s (1984) tournament, and in light of the fact that this strategy does not support a cooperative equilibrium in any of these games.. 13.
(17) References Axelrod, R. (1984), The Evolution of Cooperation, Robert Axelrod. Brown, J. and Rosenthal, R. (1990), “Testing the Minimax Hypothesis: A Reexamination of O’Neil’s game experiment, ” Econometrica, 58:1065-1081. Dal Bo, P. and G. Frechette (2007), “The Evolution of Cooperation in Infinitely Repeated Games”, New York University Department of Economics working paper. Duffy, J. and J. Ochs (2006), “Cooperative Behavior and the Frequency of Social Interaction”, University of Pittsburgh, working paper. Engle-Warnick, J. and E. Hopkins (2006a), “A Simple Test of Learning Theory”, CIRANO working paper. Engle-Warnick, J. and R. Slonim (2006b), “Learning to Trust in Indefinitely Repeated Games”, Games and Economic Behavior, 54:95-114, 2006. Engle-Warnick, J. and R. Slonim (2006), “Inferring Repeated-Game Strategies from Actions: Evidence from Trust Games”, Economic Theory, 28:603-632, 2006. Fehr, E. and S. Gachter (2000), “Fairness and Retaliation: The Economics of Reciprocity”, Journal of Economic Perspectives, 14:159-181. Fischbacher, U. (1999), “z-Tree - Zurich Toolbox for Readymade Economic Experiments Experimenter’s Manual”, Working Paper Nr. 21, Institute for Empirical Research in Economics, University of Zurich. Normann, H. and B. Wallace (2006), “The Impact of the Termination Rule on Cooperation in a Prisoner’s Dilemma Experiment ,” University of London Royal Holloway Department of Economics, working paper. O’Neil, B. (1987), “Nonmetric Test of the Minimax Theory of Two-Person Zerosum Games”, Proceedings of the National Academy of Sciences, 84:210609. Selten, R. and R. Stoeker (1986), “End Behavior in Sequences of Finite Prisoner’s Dilemma Supergames”, Journal of Economic Behavior and Organization, 7:1:47-70. Walker, M. and Wooders, J. (2001), “Minimax Play at Wimbledon”, American Economic Review, 70:651-659.. 14.
(18) Table 1: Number of Rounds in the Supergames 1 2 3 4 5 6 7 8 9 10 11 12 13 14 15 16 17 18 19 20 Mean. Session 1 Session 2 Session 3 Session 4 1 2 1 5 2 9 4 16 3 1 4 1 6 8 3 5 5 19 7 10 4 1 3 3 1 2 5 2 2 1 5 25 1 3 1 1 9 1 7 1 4 13 5 5 2 13 4 3 5 1 2 5 4 5 1 3 1 15 3 9 3 1 17 19 6 2 8 1 4 6 2 8 15 1 2 1 3 1 4 1 4.05 5.25 4.4 6.2.
(19) Table 2: Number of Subjects and Mean Payoffs Number of Subjects Session 1 Session 2 Session 3 Session 4 Hawk-Dove 8 12 12 12 Chicken 10 12 12 10 Trust 10 10 12 12 Coordination 12 8 10 12 Constant Sum 10 12 8 10. Total 44 44 44 42 40. Mean Payoff Type 1 Type 2 70.13 82.64 60.4 82.52 92.29 90 -.
(20) Table 3: The Effect of Game Histories on the Decision to Play “Hawk” in Hawk-Dove Individual Sessions Pooled Sessions Explanatory Variables 1 Own Choice of Hawk in the Preceding Round 1.28* (0.65) Opponent’s Hawk Choice In the Preceding Round -3.18 (1.85) In Any Previous Round in the Supergame 2.47 (1.57) Opponent’s Dove Choice In Any Previous Round in the Supergame -5.86* (1.68) Round Three 1.02 (0.67) Four 1.20 (0.93) Five 0.94 (1.98) Six - Ten 2.40 (1.42) Eleven – Twenty-Five 1.26 (63.03) Number of Observations Log-Likelihood. 366 -36.35. 2 3 1.71* (0.21) 0.68* (0.29). 4 1.41* (0.23). 1.86* (0.12). 2.18* (0.28) 0.16 (0.40). 1.48* (0.50) 0.12 (0.54). 2.66* (0.30) 0.15 (0.17). 2.48* (0.18) -0.30 (0.21). -0.21 (0.31). -0.66 (0.47). -0.75* (0.30). -0.43* (0.18). 0.20 (0.40) 1.16* (0.38) 0.32 (0.42) 0.35 (0.42) 0.95* (0.42) -0.45 (0.48) 0.77 (0.45) 1.51* (0.57) -0.64 (0.48) 0.84* (0.38) 1.06* (0.54) -0.58 (0.440 0.74 (0.42) 10.63 (167.8) -0.46 (0.47). 0.47* (0.20) 0.15 (0.21) 0.27 (0.24) 0.31 (0.21) 0.23 (0.23). 1020 -332.67. 680 -175.71. 1144 -295.73. 3443 -981.47. Notes: 1: Significance levels: * indicates at 5% level. Standard errors in parenthesis 2: Opponent’s choice explanatory variables are coded as indicator variables for the following cases. (1) The opponent played Hawk in the previous round. (2) The opponent played Hawk in a previous round of the same supergame. (3) The opponent played Dove in a previous round of the same supergame 3. Parameter estimates for fixed subject effects and missing observations are not shown, and Round 1 observations are not included. 4. Standard errors for significance testing are clustered on sessions..
(21) Table 4: The Effect of Game Histories on the Decision to Play “Don’t Swerve” in Chicken Individual Sessions Explanatory Variables 1 Own Choice to Don’t Swerve in the Preceding Round -0.50* (0.21) Opponent’s Don’t Swerve Choice In the Preceding Round 1.01* (.26) In Any Previous Round in the Supergame -1.21* (0.42) Opponent’s Swerve Choice In Any Previous Round in the Supergame 0.17 (0.28) Round Three -0.15 (0.30) Four 0.24 (0.37) Five 0.26 (0.43) Six - Ten 0.37 (0.41) Eleven – Twenty-Five 0.15 (0.51) Number of Observations Log-Likelihood. 610 -333.83. Pooled Sessions. 2 0.31* (0.15). 3 0.00 (0.19). 4 0.01 (0.13). 0.22* (0.08). 0.98* (0.19) 0.72* (0.29). 1.89* (0.26) -0.27 (0.33). 0.57* (0.15) -0.34 (0.32). 0.98* (0.10) -0.05 (0.15). 0.64* (0.23). 0.12 (0.29). -0.61* (0.27). 0.06 (0.12). -0.03 0.09 -0.07 0.32 0.31. -0.09 (0.14) -0.05 (0.16) -0.15 (0.17) -0.12 (0.15) -0.21 (0.17). -0.19 (0.32) 0.23 (0.29) -0.75* (0.35) 0.51 (0.33) -0.78* (0.36) 0.61 (0.40) -0.52 (0.31) -0.21 (0.38) -0.78* (0.34) -0.15 (0.51) 1020 -538.10. 816 -383.40. (0.29) (0.34) (0.35) (0.34) (0.37). 1040 -644.75. 3486 -2062.86. Notes: 1: Significance levels: * indicates at 5% level. Standard errors in parenthesis 2: Opponent’s choice explanatory variables are coded as indicator variables for the following cases. (1) The opponent played Don’t Swerve in the previous round. (2) The opponent played Don’t Swerve in a previous round of the same supergame. (3) The opponent played Swerve in a previous round of the same supergame 3. Parameter estimates for fixed subject effects and missing observations are not shown, and Round 1 observations are not included. 4. Standard errors for significance testing are clustered on sessions..
(22) Table 5a: The Effect of Game Histories on the Decision to “Trust” in Trust Individual Sessions Explanatory Variables 1 2 3 4 Own Choice to Trust in the Preceding Round 0.94* (0.34) 1.46* (0.34) 0.04 (0.38) 0.54* (0.19) Opponent’s Don’t Reciprocate Choice In the Preceding Round -2.03* (0.52) -3.50* (0.51) -1.38*(0.55) -0.66* (0.23) In Any Previous Round in the Supergame -1.23* (0.55) -0.52 (0.62) -1.03 (0.55) -1.53* (0.30) Opponent’s Reciprocate Choice In Any Previous Round in the Supergame -0.60 (0.63) 0.45 (0.89) 0.56 (0.89) -0.09 (0.52) Round Three -0.90 (0.53) -0.62 (0.77) 0.32 (0.46) 0.55 (0.39) Four 0.16 (0.60) 0.21 (0.81) -0.51 (0.56) 0.27 (0.45) Five -0.08 (0.74) -0.47 (0.85) 0.48 (0.66) 1.12* (0.47) Six - Ten -0.86 (0.72) 0.17 (0.76) -0.11 (0.70) 0.77 (0.43) Eleven – Twenty-Five -0.79 (0.92) -0.40 (0.83) 1.67 (0.94) 0.85 (0.47) Number of Observations Log-Likelihood. 305 -112.32. 425 -133.71. 340 -124.60. 624 -337.37. Pooled Sessions. 1.16* (0.12) -1.39* (0.17) -0.89* (0.18) 0.00 (0.27) -0.10 (0.22) 0.02 (0.24) 0.38 (0.26) 0.16 (0.24) 0.22 (0.27) 1762 -832.61. Notes: 1: Significance levels: * indicates at 5% level. Standard errors in parenthesis 2: Opponent’s choice explanatory variables are coded as indicator variables for the following cases. (1) The opponent played Don’t Reciprocate in the previous round. (2) The opponent played Don’t Reciprocate in a previous round of the same supergame. (3) The opponent played Reciprocate in a previous round of the same supergame 3. Parameter estimates for fixed subject effects and missing observations are not shown, and Round 1 observations are not included. 4. Standard errors for significance testing are clustered on sessions..
(23) Table 5b: The Effect of Game Histories on the Decision to “Don’t Reciprocate” in Trust Individual Sessions Pooled Sessions Explanatory Variables 1 2 3 Own Choice to Don’t Reciprocate in Preceed. Round -0.05 (0.32) 0.41 (0.25) 0.62* (0.24) Opponent’s Trust Choice In the Preceding Round 0.99* (0.49) 0.27 (0.34) 0.75 (0.45) In Any Previous Round in the Supergame -0.34 (0.43) 0.61 (0.34) 0.00 (0.33) Opponent’s Don’t Trust Choice In Any Previous Round in the Supergame -0.45 (0.54) 1.91* (0.58) 0.82 (0.58) Round Three 0.16 (0.46) -1.30* (0.55) 0.39 (0.37) Four 0.07 (0.53) -1.42* (0.60) -0.38 (0.42) Five 0.66 (0.64) -0.37 (0.59) -0.03 (0.49) Six - Ten 0.32 (0.59) -1.00* (0.51) 0.18 (0.46) Eleven – Twenty-Five 0.74 (0.80) -1.33* (0.56) -0.61 (0.61) Number of Observations Log-Likelihood. 305 -132.94. 340 -199.42. 408 -211.38. 4 0.49*(0.19). 0.53* (0.11). -0.24 (0.22) 0.09 (0.36). 0.12 (0.16) 0.23 (0.16)). -0.32 (0.40). 0.25 (0.22). -0.19 (0.38) -0.11 (0.44) 0.56 (0.46) 0.77 (0.45) 0.59 (0.47). -0.06 (0.20) -0.36 (0.22) 0.25 (0.23) 0.17 (0.21) 0.04 (0.24). 624 -352.15. 1677 -943.08. Notes: 1: Significance levels: * indicates at 5% level. Standard errors in parenthesis 2: Opponent’s choice explanatory variables are coded as indicator variables for the following cases. (1) The opponent played Trust in the previous round. (2) The opponent played Trust in a previous round of the same supergame. (3) The opponent played Don’t Trust in a previous round of the same supergame 3. Parameter estimates for fixed subject effects and missing observations are not shown, and Round 1 observations are not included. 4. Standard errors for significance testing are clustered on sessions..
(24) Table 6: The Effect of Game Histories on the Decision to Play “High” in Coordination Individual Sessions Pooled Sessions Explanatory Variables 1 2 3 Own Choice of High in the Preceding Round 2.73* (0.33) 2.59* (0.27) 2.35* (0.35) Opponent’s High Choice In the Preceding Round 1.85* (0.57) 1.83* (0.39) 1.53* (0.66) In Any Previous Round in the Supergame -0.56 (0.52) 0.71 (0.47) 2.16* (0.59) Opponent’s Low Choice In Any Previous Round in the Supergame -2.12* (0.54) -0.79 (0.47) -0.35 (0.63) Round Three 0.31 (0.42) -1.02* (0.50) -0.42 (0.49) Four -0.17 (0.47) -1.21* (0.58) -0.56 (0.55) Five 0.25 (0.58) -0.69 (0.58) -0.53 (0.69) Six - Ten -0.18 (0.58) -0.08 (0.47) -0.01 (0.66) Eleven – Twenty-Five -0.39 (0.96) -0.27 (0.54) 0.42 (0.91) Number of Observations Log-Likelihood. 671 -160.65. 680 -191.03. 544 -127.18. 4 3.57* (0.32). 3.13* (0.14). 3.57* (0.54) 1.27* (0.51). 2.31* (0.23) 0.65* (0.23). 0.31 (0.47). -0.44* (0.22). -0.48 (0.45) -1.28* (0.54) -2.02* (0.57) -2.01* (0.53) -1.15* (0.54). -0.28 (0.21) -0.61* (0.23) -0.48 (0.26) -0.28 (0.22) -0.24 (0.25). 1040 -174.32. 3107 -785.28. Notes: 1: Significance levels: * indicates at 5% level. Standard errors in parenthesis 2: Opponent’s choice explanatory variables are coded as indicator variables for the following cases. (1) The opponent played High in the previous round. (2) The opponent played High in a previous round of the same supergame. (3) The opponent played Low in a previous round of the same supergame 3. Parameter estimates for fixed subject effects and missing observations are not shown, and Round 1 observations are not included. 4. Standard errors for significance testing are clustered on sessions..
(25) Table 7: The Effect of Game Histories on the Decision to Play “Tails” in Constant Sum Individual Sessions Pooled Sessions Explanatory Variables Own Choice of Tails in the Preceding Round Opponent’s Tails Choice In the Preceding Round In Any Previous Round in the Supergame Opponent’s Heads Choice In Any Previous Round in the Supergame Round Three Four Five Six - Ten Eleven – Twenty-Five Number of Observations Log-Likelihood. 1 2 -0.34 (0.19) 0.17 (0.13). 3 0.15 (0.18). 4 -0.16 (0.13). 0.05 (0.07). 0.05 (0.22) -0.01 (0.15) -0.42 (0.24) 0.12 (0.15) 0.03 (0.35) -0.02 (0.33) 0.19 (0.34) -0.04 (0.29). 0.03 (0.09) 0.09 (0.15). -0.60 (0.35). 0.11 (0.34). -0.55 (0.33). 0.10 (0.27). -0.15 (0.15). -0.07 (0.31) 0.34 (0.39) -0.17 (0.45) 0.62 (0.45) 0.92 (0.54). 0.12 (0.31) -0.48 (0.37) -0.25 (0.40) -0.22 (0.36) -0.13 (0.38). 0.01 (0.30) 0.00 (0.36) 0.09 (0.43) 0.50 (0.44) 0.12 (0.55). -0.11 (0.27) 0.16 (0.33) -0.26 (0.35) 0.20 (0.34) -0.19 (0.35). -0.01 (0.14) 0.06 (0.17) -0.16 (0.19) 0.19 (0.17) 0.08 (0.19). 610 -375.80. 1020 -659.82. 544 -337.95. 1040 -668.09. 3214 -2136.17. Notes: 1: Significance levels: * indicates at 5% level. Standard errors in parenthesis 2: Opponent’s choice explanatory variables are coded as indicator variables for the following cases. (1) The opponent played Tails in the previous round. (2) The opponent played Tails in a previous round of the same supergame. (3) The opponent played Heads in a previous round of the same supergame 3. Parameter estimates for fixed subject effects and missing observations are not shown, and Round 1 observations are not included. 4. Standard errors for significance testing are clustered on sessions..
(26) Table 8a: Summary of Strategic Behavior in Individual Sessions Game Hawk-Dove Chicken Trust. Type. Action Time t-1 Decision Tit-for-Tat Grim Positive Reciprocity Hawk +/4 +/3 +/2 Don't Swerve +/1;-/1 +/4 +/1;-/1 +/1;-/1 Trustor Trust +/3 +/4 /+/2 Trustee Don't Reciprocate +/2 -/1 -/1 Coordination High +/4 +/4 +/2 +/1 Constant-Sum Tails -. Trend in Supergame +/1 +/1 -/1 -/1 -. Notes: Statistically significant coefficients reported as positive or negative depending on the predicted affect by each strategy, followed by a slash, followed by the number of sessions in which the coefficient was significant with that sign. For example: +/3 means the coefficient on the explanatory variable was in the predicted direction in three sessions. In the case of conflicting signs across sessions, the reports are separated with a semi-colon.. Table 8b: Summary of Strategic Behavior Pooled Across Sessions Game Hawk-Dove Chicken Trust. Type. Action Time t-1 Decision Tit-for-Tat Grim Hawk + + Don't Swerve + + Trustor Trust + + + Trustee Don't Reciprocate + Coordination High + + + Constant-Sum Tails -. Positive Reciprocity + + -. Trend in Supergame -.
(27) Figure 1a: Hawk-Dove Game Payoff Matrix. Dove Hawk. Dove 90,90 180,0. Hawk 0,180 60,60. Figure 1b: Chicken Game Payoff Matrix Swerve Don’t Swerve. Swerve 90,90 180,60. Swerve 60,180 30,30. Figure 1c: Trust Game Payoff Matrix Don’t Trust Trust. Reciprocate 60,60 90,90. Don’t Reciprocate 60,60 0,180. Figure 1d:Coordination Game Payoff Matrix. Low High. Low 90,90 0,90. High 90,0 120,120. Figure 1e: Constant Sum Game Payoff Matrix. Heads Tails. Heads 120,60 60,120. Tails 60,120 120,60.
(28) Figure 2a: Hawk-Dove Game Payoff Space. 180 150 120 90 60 30 0 0. 30. 60. 90. 120. 150. 180. Figure 2b: Chicken Game Payoff Space 180 150 120 90 60 30 0 0. 30. 60. 90. 120. 150. 180.
(29) Figure 2c: Trust Game Payoff Space. 180 150 120 Trustee. 90 60 30 0 0. 30. 60. 90. 120. 150. 180. Trustor. Figure 2d: Coordination Game Payoff Space. 180 150 120 90 60 30 0 0. 30. 60. 90. 120. 150. 180. Figure Xd: Hawk-Dove Game Payoff Space.
(30) Figure 2e: Constant Sum Game Payoff Space. 180 150 120 90 60 30 0 0. 30. 60. 90. 120. 150. 180.
(31) Figure 3: Proportion of "Hawk" Choices in the First Four Rounds of Each Hawk-Dove Supergame Hawk-Dove Game. Proportion of "Hawk" Choices. 1. 0.9. 0.8. 0.7. 0.6. 0.5 1. 2. 3. 4. 5. 6. 7. 8. 9. 10. 11. 12. 13. 14. 15. 16. 17. 18. 19. 20. Supergame. Figure 4: Proportion of "Don't Swerve" Choices in the First Four Rounds of Each Chicken Supergame. Chicken. Proportion of "Don't Swerve" Choices. 0.9 0.8 0.7 0.6 0.5 0.4 0.3 0.2 1. 1. 2. 3. 4. 4. 5. 6. 7. 7. 8. 9 10 11 11 12 13 14 14 15 16 17 17 18 19 20 20 Supergame.
(32) Figure 5a: Proportion of "Trust" Choices in the First Four Rounds of Each Trust Supergame. Trustor. Proportion of "Trust" Decisions. 0.8 0.7 0.6 0.5 0.4 0.3 0.2 0.1 0 1. 1. 2. 3. 4. 4. 5. 6. 7. 7. 8. 9 10 11 11 12 13 14 14 15 16 17 17 18 19 20 20 Supergame. Figure 5b: Proportion of "Do Not Reciprocate" Choices in the First Four Rounds of Each Trust Supergame. Trustee. Proportion of "Do Not Reciprocate" Actions. 0.8 0.7 0.6 0.5 0.4 0.3 0.2 0.1 0 1. 1. 2. 3. 4. 4. 5. 6. 7. 7. 8. 9 10 11 11 12 13 14 14 15 16 17 17 18 19 20 20 Supergame.
(33) Figure 6: Proportion of "High" Choices in the First Four Rounds of Each Coordination Supergame. Coordination. Proportion of "High" Decisions. 0.9 0.8 0.7 0.6 0.5 0.4 0.3. 19. 20. 19. 20. 18. 17. 16. 15. 14. 13. 12. 11. 9. 10. 8. 7. 6. 5. 4. 3. 2. 1. 0.2. Supergame. Figure 7: Proportion of "Tails" Choices in the First Four Rounds of Each Constant-Sum Supergame. Constant Sum. 0.7. 0.6. 0.5. 0.4. 0.3. Supergame. 18. 17. 16. 15. 14. 13. 12. 11. 9. 10. 8. 7. 6. 5. 4. 3. 2. 0.2 1. Proportion of "Tails" Decisions. 0.8.
(34)
Figure
+7
Documents relatifs
One of the main objectives of the DigCurV project was to address the availability of educational curricula and vocational training for digital curators in the library, archive, museum
The most important outcomes from the study are: a) even with this small sample, participants made use of almost all the available intentions and they seem to have.. been sufficient
Given that economic decision-making in free-to-play games is a complex phenomenon to study, it is suggested that diverse methodology should be employed. We present as one
Florent Malrieu, corresponding author, e-mail: florent.malrieu(AT)univ-rennes1.fr UMR 6625 CNRS Institut de Recherche Math´ ematique de Rennes (IRMAR) Universit´ e de Rennes I,
ii) In the case of a vanishing magnetic field, the Lifshitz asymptotics for random Schr¨o- dinger operator with repulsive random alloy-type potentials has been known since long ago
If such phenomenon would be critical for the band tailing in kesterite, ones would predict a lower distortion width or Urbach energy for the fully Cu-Zn disordered material than for
L’archive ouverte pluridisciplinaire HAL, est destinée au dépôt et à la diffusion de documents scientifiques de niveau recherche, publiés ou non, émanant des
L’archive ouverte pluridisciplinaire HAL, est destinée au dépôt et à la diffusion de documents scientifiques de niveau recherche, publiés ou non, émanant des
