https://doi.org/10.5194/bg-15-1273-2018 © Author(s) 2018. This work is distributed under the Creative Commons Attribution 4.0 License.
The pyrogeography of eastern boreal Canada from 1901 to 2012
simulated with the LPJ-LMfire model
Emeline Chaste1,2, Martin P. Girardin1,3, Jed O. Kaplan4,5,6, Jeanne Portier1, Yves Bergeron1,7, and Christelle Hély2,7 1Département des Sciences Biologiques, Université du Québec à Montréal and Centre for Forest Research,
Case postale 8888, Succursale Centre-ville, Montréal, QC H3C 3P8, Canada
2EPHE, PSL Research University, ISEM, University of Montpellier, CNRS, IRD, CIRAD, INRAP, UMR 5554, 34095 Montpellier, France
3Natural Resources Canada, Canadian Forest Service, Laurentian Forestry Centre, 1055 du PEPS, P.O. Box 10380, Stn. Sainte-Foy, Québec, QC G1V 4C7, Canada
4ARVE Research SARL, 1009 Pully, Switzerland
5Max Planck Institute for the Science of Human History, 07743 Jena, Germany
6Environmental Change Institute, School of Geography and the Environment, University of Oxford, Oxford, OX1 3QY, UK 7Forest Research Institute, Université du Québec en Abitibi-Témiscamingue, 445 boul. de l’Université,
Rouyn-Noranda, QC J9X 5E4, Canada
Correspondence: Emeline Chaste (emeline.chaste@canada.ca) Received: 11 August 2017 – Discussion started: 20 September 2017
Revised: 22 January 2018 – Accepted: 23 January 2018 – Published: 5 March 2018
Abstract. Wildland fires are the main natural disturbance shaping forest structure and composition in eastern boreal Canada. On average, more than 700 000 ha of forest burns annually and causes as much as CAD 2.9 million worth of damage. Although we know that occurrence of fires depends upon the coincidence of favourable conditions for fire igni-tion, propagaigni-tion, and fuel availability, the interplay between these three drivers in shaping spatiotemporal patterns of fires in eastern Canada remains to be evaluated. The goal of this study was to reconstruct the spatiotemporal patterns of fire activity during the last century in eastern Canada’s boreal for-est as a function of changes in lightning ignition, climate, and vegetation. We addressed this objective using the dynamic global vegetation model LPJ-LMfire, which we parametrized for four plant functional types (PFTs) that correspond to the prevalent tree genera in eastern boreal Canada (Picea, Abies, Pinus, Populus). LPJ-LMfire was run with a monthly time step from 1901 to 2012 on a 10 km2resolution grid covering the boreal forest from Manitoba to Newfoundland. Outputs of LPJ-LMfire were analyzed in terms of fire frequency, net primary productivity (NPP), and aboveground biomass. The predictive skills of LPJ-LMfire were examined by comparing our simulations of annual burn rates and biomass with
inde-pendent data sets. The simulation adequately reproduced the latitudinal gradient in fire frequency in Manitoba and the lon-gitudinal gradient from Manitoba towards southern Ontario, as well as the temporal patterns present in independent fire histories. However, the simulation led to the underestimation and overestimation of fire frequency at both the northern and southern limits of the boreal forest in Québec. The general pattern of simulated total tree biomass also agreed well with observations, with the notable exception of overestimated biomass at the northern treeline, mainly for PFT Picea. In these northern areas, the predictive ability of LPJ-LMfire is likely being affected by the low density of weather sta-tions, which leads to underestimation of the strength of fire– weather interactions and, therefore, vegetation consumption during extreme fire years. Agreement between the spatiotem-poral patterns of fire frequency and the observed data across a vast portion of the study area confirmed that fire therein is strongly ignition limited. A drier climate coupled with an increase in lightning frequency during the second half of the 20th century notably led to an increase in fire activity. Finally, our simulations highlighted the importance of both climate and fire in vegetation: despite an overarching CO2 -induced enhancement of NPP in LPJ-LMfire, forest biomass
was relatively stable because of the compensatory effects of increasing fire activity.
1 Introduction
Wildland fires are the main natural disturbance shaping forest structure and composition in eastern boreal Canada (Berg-eron et al., 1998, 2014). On average, more than 0.7 Mha burns annually across Manitoba, Ontario, Québec, and the Maritime Provinces, which causes as much as CAD 2.9 mil-lion worth of damage and property losses (Canadian Council of Forest Ministers, 2017). About 97 % of these burned ar-eas are generated by a small proportion (3 %) of large fires (fires > 200 ha in area; Stocks et al., 2003). For example, a fire burned 583 000 ha within a few days in 2013 near the aborig-inal community of Eastmain (province of Québec), which is the equivalent of 31 % of the total area burned during that year in Québec (Erni et al., 2017). Studies of the spatial dis-tribution of wildland fires in the past have highlighted that the frequency and size of fires in Canada have continuously increased over the last 50 years or so in response to the on-going global warming (e.g., Kasischke and Turetsky, 2006; Hessl, 2011; Girardin and Terrier, 2015). Concerns are now being raised about the increasing frequency and severity of extreme climatic events with further warming, which could lead to an increasing concentration of numerous large fires in time and space (Wang et al., 2015). Given these observations and projections, there is growing concern about the capacity of the boreal forest to recover from disturbances (Bond et al., 2004; IPCC, 2013; Kurz et al., 2013; Rogers et al., 2013).
Wildland fire regimes are described by several attributes including the frequency, size, intensity, seasonality, type, and severity of fires (Keeley, 2009). The spatiotemporal vari-ability in a fire regime depends upon the coincidence of favourable conditions for fire ignition, fire propagation, and fuel availability, which are controlled by ignition agents, weather and climate, and vegetation (Flannigan et al., 2009; Moritz et al., 2010). Almost half of the fires that occur in eastern boreal Canada are ignited by lightning and repre-sent 81 % of the total area burned (Canadian Forest Service, 2016), while the remaining fires originate from human activ-ities. The capacity of a fire to grow into a large fire is de-termined by many factors, which include weather and fuel. High temperature, low precipitation, high wind velocity, and low atmospheric humidity can increase the growth of these fires (Flannigan et al., 2000). The intensity, severity, and size of fires are further influenced by species composition within the landscape, with needleleaf species being more fire prone than broadleaf species owing to their high flammability (Hély et al., 2001). Physical variables such as slope, surficial de-posits, and soil moisture can also have significant effects on the rate at which fires spread by influencing fuel mois-ture or creating natural fire breaks (Hély et al., 2001;
Man-suy et al., 2011; Hantson et al., 2016). Climate change sce-narios for Canada indicate an increase in both temperature and precipitation in the coming decades. However, the in-crease in precipitation should not compensate for the inin-crease in temperature (IPCC, 2013), and a greater moisture deficit is expected compared to the current state. Warmer springs and winters that lead to an earlier start of the fire season are anticipated, together with an increase in the frequency of extreme drought years due to more frequent and persis-tent high-pressure blocking systems (Girardin and Mudelsee, 2008). These phenomena are expected to lead to an increase in the frequency and size of fires in eastern boreal Canada in response to the on-going global warming (Ali et al., 2012). Effects of these changes in seasonal onset and dryness are such that the average size of spring wildfires could be mul-tiplied by a factor of 3 for each additional 1◦C of warming (Ali et al., 2012; Girardin et al., 2013a; Price et al., 2013). An increase in area burned would affect both forest manage-ment plans and fire suppression strategies. It could also have subsequent feedback on the global carbon cycle, given that the substantial quantities of carbon currently being stored in these landscapes could be re-emitted back into the atmo-sphere (Pan et al., 2011).
A number of uncertainties persist concerning future fire projections, and biases still exist regarding our current un-derstanding of the natural variability in fire regimes. Climate has been rapidly changing in recent decades with the expan-sion of human activities. All of these changes have altered interactions between fire regimes and their various forms of control (Bergeron et al., 2004b). Most fire history studies are based upon observations collected over relatively short time intervals (< 100 years), and reliable observations are often unavailable for many boreal regions prior to the late 1960s (Podur et al., 2002). Moreover, forest management and active fire suppression since the 1970s have contributed to modify-ing fire patterns and vegetation attributes in Canada (Gau-thier et al., 2014). Therefore, it is difficult to determine the contribution of climate alone to fire activity in studies us-ing observations collected since the second half of the 20th century. Furthermore, fire history studies rarely consider the feedback of fire on vegetation, mostly because historical data about vegetation composition are lacking (Danneyrolles et al., 2016). This is particularly true in the case of studies deal-ing with reconstructions of fire activity usdeal-ing dendrochrono-logical evidence (e.g., Girardin et al., 2006) or adjusted em-pirical data sets (Van Wagner et al., 1987). This problem may be circumvented by investigating past fire regimes over long periods of time through the analysis of charcoal and pollen in soil layers or lacustrine deposits (Payette et al., 2008; Ali et al., 2009). However, these paleoecological methods are costly and time-consuming and do not make it possible to capture the overall spatial variability in fire regimes at an-nual – to decadal – scale resolutions. Faced with these gaps, increasing our knowledge of the spatiotemporal patterns of
past fires is necessary to perform better predictions in the fu-ture.
Simulations using dynamic global vegetation models (DGVMs) make it possible to estimate the spatiotemporal distribution of fires relative to climate and vegetation (Yue et al., 2016; Hantson et al., 2016). Indeed, these models sim-ulate shifts in potential vegetation composition and related fire activity in response to changes in climate or environ-mental constraints (Smith et al., 2001). Experiments can be conducted on fine to broad spatial scales and validated on relatively short to medium timescales. Validation can be per-formed in regions where human activities are sufficiently low to allow comparisons with natural potential vegetation, by comparing simulation results with high-resolution satel-lite products, such as MODIS, on global scales (Tang et al., 2010). DGVM simulations may also be validated on decadal to millennial timescales by comparing them with histori-cal records of vegetation or fire activity that have been re-constructed using indicators derived from pollen and char-coal, amongst others, which are deposited in lacustrine sedi-ments (Molinari et al., 2013). One of these models, the Lund-Potsdam-Jena (LPJ) model, has been the subject of numerous refinements over time, especially concerning simulations of fire patterns (Thonicke et al., 2010; Pfeiffer et al., 2013), and it has been validated in many regions worldwide, excluding eastern boreal Canada (e.g., Prentice et al., 2011; Pfeiffer et al., 2013; Yue et al., 2016; Knorr et al., 2016).
Here, we used the LPJ-LMfire model that was developed by Pfeiffer et al. (2013) to perform a simulation experi-ment that targeted the boreal forest of eastern Canada and covered the last century, with customized parameterization to capture prevalent tree genera in eastern boreal Canada. The DGVM explicitly simulates fire ignition from lightning; hence, it is particularly adapted to the largely ignition-limited fire regimes in our study region. The objectives of this study were (1) to calibrate the LPJ-LMfire model for boreal forests in eastern Canada; (2) to assess the predictive skills of the model with independent data sets from eastern Canada’s bo-real forests; (3) to reconstruct fire activity, net primary pro-ductivity (NPP), and aboveground biomass during the last century; and (4) to determine how the spatiotemporal pattern of these three components has evolved in relation to changes in climate variables.
2 Model, experimental set-up, and methods 2.1 Study area
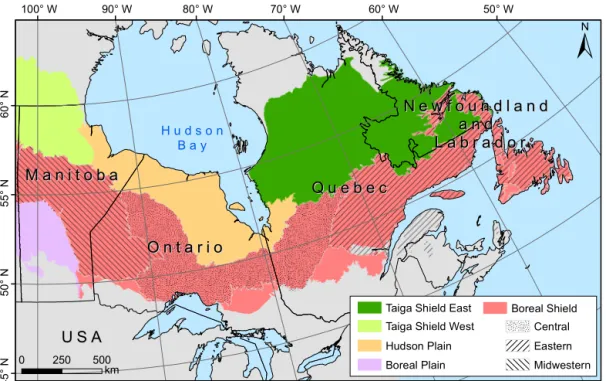
The study area encompasses eastern Canada’s boreal for-est (Brandt, 2009) from Manitoba to Newfoundland, which ranges from 102.86 to 52.64◦W and from 46.61 to 64.71◦N (Fig. 1). The most common needleleaf tree species present in this region are black spruce (Picea mariana (Mill.) B.S.P.), white spruce (Picea glauca (Moench) Voss), balsam fir
(Abies balsamea (L.) Mill.), jack pine (Pinus banksiana Lamb.), white pine (Pinus strobus L.), red pine (Pinus resinosa Ait.), eastern larch (Larix laricina (Du Roi) K. Koch), and eastern white cedar (Thuja occidentalis L.). The main broadleaf tree species are trembling aspen (Populus tremuloides Michx.) and white or paper birch (Betula pa-pyriferaMarsh.) (Ecological Stratification Working Group, 1996; Brandt, 2009; Shorohova et al., 2011). The study area is divided from south to north into four ecozones (Fig. 1; Ecological Stratification Working Group, 1996). (1) The Boreal Shield (BS) ecozone is characterized by rocky and rugged landscapes influenced by a continental climate (long and cold winters; short and warm summers) and by the cold air masses flowing out from Hudson Bay. Landscapes are dominated by needleleaf tree species in the western-most areas, and co-dominated by needleleaf and deciduous tree species in temperate eastern areas. (2) The Boreal Plain (BP) ecozone corresponds to drier areas that are charac-terized by glacial deposits of variable thickness on flat or slightly rolling terrain. Forests are dominated by mixed bo-real species, mainly represented by black spruce, trembling aspen, and jack pine. (3) The Hudson Plain (HP) ecozone is characterized by a sparser vegetation, which is dominated by Sphagnum and shrubs. Poor drainage conditions constrain southern trees to establish at drier, higher elevations. (4) The Taiga Shield (TS) ecozone, which is split into Eastern (TSE) and Western (TSW) parts, is characterized by colder climate conditions. The landscape becomes more open along a lati-tudinal gradient from south to north. In all regions, the dom-inant tree species are black spruce and jack pine. Within the study area, high-intensity crown fires are the most common type of fire events (Flannigan et al., 2016). Fire regimes are heterogeneous, but generally follow a declining trend along a southwest–northeast gradient (Boulanger et al., 2012). Dur-ing the period of 1961–1990, the highest burn rates occurred in the western part of the BS ecozone (> 1 % yr−1), while they were the lowest in the TSE ecozone (< 0.2 % yr−1) (Boulanger et al., 2014). Annual burn rates in the BP ecozone and in the eastern part of the BS ecozone varied from 0.2 to 0.5 % yr−1, whereas they varied from 0.5 to 1.0 % yr−1in the HP ecozone (Boulanger et al., 2014).
2.2 LPJ-LMfire model
Simulations of the terrestrial ecosystem were carried out us-ing the dynamic global vegetation model LPJ-LMfire, which includes updates of both LPJ and the SPread and InTen-sity of FIRE (SPITFIRE) wildfire module (Thonicke et al., 2010). The model has been extensively evaluated for boreal forests (Pfeiffer et al., 2013). LPJ-LMfire is designed to sim-ulate regional ecosystem dynamics, structure, and composi-tion, with vegetation and fire events as responses to changes in climate and carbon dioxide (CO2) concentration (Sitch et al., 2003). LPJ-LMfire describes the state of an ecosys-tem in terms of annual carbon stocks (living biomass,
lit-T able 1. Climate and other data sets used to dri v e LPJ-LMfire. V ariables (units) Period Data sets References Monthly mean temperature (◦ C) and monthly mean diurnal temperature range (◦ C) Monthly mean precipitati on (mm) and number of days per month with precipitation 1901–2012 Model “climatic monthly”, softw are BioSIM En vironment Canada (2013) Monthly mean of wind speed (m s− 1 ) 1969–2010 Climate data Monthly mean of total cloud co v er percentage 1901–2012 20th century reanalysis Compo et al. (2011) Monthly mean con v ectible av ailable potential ener gy (J kg − 1 ) Lightning flashes (number day − 1 km − 2 ) 1999–2010 Canadian lightning detection netw ork Orville et al. (2011) En vironmental constraints Soil particle size distrib ution and v olume fraction of coarse fragments (%) – ISRIC – W orld Soil Information Hengl et al. (2014) Ele v ation (m) and slope (◦ ) – Canada 3-D Natural Resources Canada (2007) W ater fraction – National Hydro Netw ork (NHN) Natural Resources Canada (2010) Atmospheric CO 2 concentrations (ppm) – Composite CO 2 time series K eeling et al. (2009), Pfeif fer et al. (2013)
50° W 60° W 70° W 80° W 90° W 100° W 55 ° N 60 ° N 50 ° N 45 ° N
±
0 250 500 km H u d s o n B a y Q u e b e c Q u e b e c O n t a r i o O n t a r i o M a n i t o b a M a n i t o b a N e w f o u n d l a n d N e w f o u n d l a n d a n d a n d L a b r a d o r L a b r a d o r U S A U S A CentralEastern Midwestern Taiga Shield WestBoreal Plain
Taiga Shield East Boreal Shield Hudson Plain
Figure 1. Map of eastern Canada’s boreal forest from Manitoba to Newfoundland showing ecozones in colour. The Boreal Shield ecozone is divided into three ecoregions: Eastern Canadian forests, Central Canadian Boreal Shield forests, and Midwestern Canadian Shield forests.
ter, and soil), NPP, net biome productivity, evapotranspira-tion, heterotrophic respiraevapotranspira-tion, soil moisture fracevapotranspira-tion, and forest structure and vertical profile (cover fraction, individ-ual density, crown area, leaf area index). In the present study, changes in the vegetation state are described in terms of NPP and total carbon stocks in living aboveground biomass. In LPJ-LMfire, vegetation is defined by up to nine plant functional types (PFTs). Each PFT represents one or several species sharing the same physiology and dynamics, governed by a short list of vital attributes, and constrained by biocli-matic limits (Sitch et al., 2003). Vegetation dynamics are up-dated annually based on the simulation of daily and annual processes. Daily processes are defined in terms of photosyn-thesis, stomatal regulation, soil hydrology, autotrophic respi-ration, leaf and root phenology, and decomposition. Annual processes are defined in terms of several sources of mortality, seedling establishment, reproduction, allocation, and tissue turnover (Smith et al., 2001; Sitch et al., 2003). The com-putational core of SPITFIRE is based upon Rothermel-type surface fire behaviour models (Rothermel, 1972; Andrews et al., 2008) and is designed to simulate processes of natural fires and their impacts on vegetation mortality and fire emis-sions (Thonicke et al., 2010). The LMfire module simulates lightning ignitions based upon a daily time step and uses fuel bulk density and fuel moisture to calculate the fire’s rate of spread, intensity, and fire-related mortality. It allows fires to burn over multiple days and simulates fire extinction from changes in weather and fuel (Pfeiffer et al., 2013). As in the original version of SPITFIRE and nearly all other large-scale
fire models, LMfire does not simulate the cell-to-cell spread of fire (Hantson et al., 2016; Pfeiffer et al., 2013; Rabin et al., 2017).
2.3 Simulation protocol
LPJ-LMfire was run monthly from 1901 to 2012 on 10 × 10 km equal-area grids covering eastern boreal Canada from Manitoba to Newfoundland. Driver data sets were pre-pared in netCDF format and are described in Table 1. Cli-mate data were compiled at a monthly time step, while at-mospheric CO2concentrations were compiled at an annual time step (see Sect. 2.4). A 1120-year spin-up period was prescribed to equilibrate vegetation and carbon pools with climate at the beginning of the study period (Smith et al., 2001) and to ensure that forest biomass and fire disturbances were in stable condition (Tang et al., 2010). This spin-up run was made using linearly detrended 1901–2012 climate data and repeated 10 times.
2.4 Environmental input data sets 2.4.1 Climate
Monthly means of temperature, diurnal temperature range, precipitation, number of days with precipitation, and wind speed were extracted for the 1901–2012 period from Envi-ronment Canada’s historical climate database (EnviEnvi-ronment Canada, 2013) using BioSIM software (v.10.3.2; .Régnière et al., 2014). Gridded climate data were prepared in BioSIM by
interpolating weather data from the four weather stations that were closest to each 10 × 10 km grid, adjusted for elevation and location differentials with regional gradients, and aver-aged using inverse distance weighting (1/d2, where d is dis-tance). Missing wind speed values between 1901 and 1968 and those for 2010–2012 were set to the monthly 1969–2010 averages.
Monthly means of total cloud cover percentage for the entire atmosphere and convective available potential energy (CAPE) were interpolated on our grid from the NOAA-CIRES 20th Century Reanalysis v2 data set at a ∼ 2.0◦ lat-itude and 1.75◦ longitude resolution (Compo et al., 2011). For a given grid cell, the annual monthly CAPE anomaly was calculated as the difference between the annual value and the monthly normal for CAPE, which was computed between 1961 and 1990.
2.4.2 Lightning
The Canadian Lightning Detection Network (CLDN) data set, covering the 1999–2010 period (Orville et al., 2011), was used to reconstruct the monthly cloud-to-ground light-ning strike density (number day−1km−2) between 1901 and 2012. Given the strong correlation between lightning strikes and the product of CAPE and precipitation (e.g., Peterson et al., 2010; Romps et al., 2014), we computed daily lightning strike density using CAPE data and distributed the lightning strikes over the daily fraction of monthly rainy days (Pfeif-fer et al., 2013). Across Canada and within our study area, July was the month with the maximum number of lightning strikes between 1999 and 2010 (Fig. S1a) and, in turn, in-terannual lightning strike variability (hereafter, referred to as min-to-mean and max-to-mean ratios) ranged from 0.1 to 7.5 times the July mean (Fig. S1b). This interannual variability in lightning strikes was preserved in our reconstruction by applying these two ratios to the normalized CAPE anomalies (values ranging between −1 and +1), which were then added to the 1999–2010 flash climatology (Pfeiffer et al., 2013; see Supplement S1 for further details).
2.4.3 Soils
The volume fraction of coarse fragments together with the 0–100 cm deep soil texture fractions of sand and clay were interpolated on the 10 × 10 km grids from the 1 km resolu-tion ISRIC – World Soil Informaresolu-tion data set (Hengl et al., 2014). For topography, we interpolated the 30 arcsec gridded digital elevation model (DEM) of Canada (Natural Resources Canada, 2007). We calculated slopes in degrees at 30 arcsec with the DEM map using ArcGIS 10.4.1 and interpolated the data to our 10 × 10 km grids. To calculate the percentage of land (i.e., removing lakes and water course areas) in each grid cell, we rasterized the water fraction of the National Hydro Network (NHN) data set at 100 m resolution (Natural Re-sources Canada, 2010). We calculated the water fraction at
a 10 km resolution from 100 m resolution grid cells that had a percentage of water fraction > 50 %. The land fraction was defined as the inverse of the water fraction. Roads, power lines, dams, mines, and other human-made structures, and areas of bare rock, were not considered in this study. 2.4.4 Atmospheric CO2concentration
Monthly mean atmospheric CO2concentrations covering the periods from 1901 to 1980 and from 1981 to 2012 were ob-tained from Pfeiffer et al. (2013) and the Mauna Loa data set (Keeling et al., 2009), respectively. Annual mean atmo-spheric CO2concentration varied from 296.23 ppm in 1901 to 392.48 ppm in 2012, which corresponds to an increase of 32.5 %.
2.5 PFT definitions and LPJ-LMfire model modifications
LPJ-LMfire was calibrated for four PFTs that corresponded to the predominant tree genera currently present in the bo-real forest of Canada: Picea, Abies, Pinus, and Populus. PFT-related parameters, e.g., fraction of roots in the upper soil layer or minimum and maximum temperatures of the cold-est month for cold-establishment, were assigned values from the published literature or global databases (see Table S1 in Sup-plement S2 for further details).
2.5.1 Edaphic limits to establishment
Establishment and growth of boreal tree species are influ-enced by a wide range of soil properties that are related to soil nutrient availability, which include pH, parent material, soil particle size, and water content, among others (Girardin et al., 2001; Beauregard and de Blois, 2014; Gewehr et al., 2014). Not all ecosystem processes linking these properties to tree establishment are simulated in the current version of LPJ-LMfire. Notably, the model does not simulate the devel-opment of peatlands or the process of paludification, and it does not include a complete module of biogeochemical cy-cling in soils that would emulate processes leading to acid-ification, for instance. As proposed by Beauregard and de Blois (2014), however, some edaphic variables may be in-dicative of certain soil processes at the stand level. In this study, correlations between the abundance of specific tree genera and soil clay content led to the implementation of a simple scheme to limit tree establishment in LPJ-LMfire (Fig. S2a). Edaphic limits to establishment were defined here in the same way that bioclimatic limits are used in LPJ. The correlations between the genus-specific tree cover fraction from Beaudoin et al. (2014) and clay volume fraction from Hengl et al. (2014) were analyzed at a 10 km resolution. For each PFT, the percentage of clay corresponding to the upper limit of the 90 % confidence interval (CI) of its distribution, for grid cells with at least 10 % of PFT cover, was used in the model as a threshold above which the given PFT could not
establish. The upper limit of the 90 % CI of the clay percent-age distribution was 20, 13 18, and 23 % for Picea, Abies, Pinus, and Populus, respectively (Fig. S2a and b). The 20 % threshold essentially results in the exclusion of the Picea and PopulusPFTs in the HP ecozone (Fig. S2c), while the thresh-old of 13 % leads to the additional exclusion of other PFTs, especially Pinus, in the Midwestern Canadian Shield forest ecoregion (Figs. 1 and S2c) and in the BP ecozone (Fig. S2c). 2.5.2 Post-fire recruitment
Recruitment of Pinus banksiana requires the heat of fires to release seeds from serotinous cones (Gauthier et al., 1996). This condition was implemented in the current LPJ-LMfire version specifically for the Pinus PFT by inhibiting seedling establishment during years without fire. Such fire effects on seed dispersal are also observed for Picea mariana, which has semi-serotinous cones. Given that black spruce cones can open gradually over time in the absence of fire (Messaoud et al., 2007), Picea PFT establishment was not constrained by fire occurrence, neither was that of the Abies and Populus PFTs. No other modifications were made to the Pfeiffer et al. (2013) version of LPJ-LMfire.
2.6 Model evaluation
We assessed the performance of our customized LPJ-LMfire by comparing simulation results with previously published data sets on fire and maps of genus-specific aboveground biomass for Canada’s forests.
2.6.1 Fire activity
The simulated burned area fraction was evaluated against three fire data products. First, annual burn rates for 1980– 2012 were compiled from the Natural Resources Canada fire database (M. A. Parisien, personal communication, 2016) us-ing Canada’s national fire polygons with the hexagonal cells approach from Héon et al. (2014), but extended to our study area. We used 365 hexagonal cells to cover our study area and to compute the 1980–2012 simulated mean annual burn rates with 95 % CI for each hexagonal cell. The second fire data product originated from stand-replacing fire history studies. Here, historical annual proportions of burned areas were ob-tained for 26 locations (Fig. S3) using post-fire stand initia-tion reconstrucinitia-tions based upon field and archival data that were digitized and included in GIS databases (Girardin et al., 2013b; Héon et al., 2014; Portier et al., 2016). Using a 100 km radius around each location centroid, we calcu-lated the simucalcu-lated mean annual burn rates between 1911 and 2012, together with the 95 % CI. Differences between our simulated 95 % CI estimates and these two fire data prod-ucts were considered qualitatively as “not different” if the observed annual burn rate fell within the 95 % CI of the sim-ulated mean burn rate. Note that as the period covered by the historical fire data often extended further back in time into
the 19th or 18th centuries for southern locations (Table S2), some important differences could be expected in the com-parison process. Finally, a third validation of fire simulations was made by comparing time series of total simulated an-nual burned areas in boreal forests of Manitoba, Ontario, and Québec with provincial fire statistics (point data) from the Canadian National Fire Database (CNFDB; Canadian For-est Service, 2016) covering the 1959–2012 period. Human-caused fires were excluded from these analyses. Spearman’s rank correlation (rs)was used to quantify the agreement be-tween observed and simulated data. The agreement bebe-tween simulation and observation was further evaluated in terms of fire seasonality by comparing their respective distributions of mean monthly areas that burned from 1959 to 2012. 2.6.2 Aboveground biomass
Published maps of total aboveground biomass at the genus level (Beaudoin et al., 2014) were used to evaluate model simulations. Maps that were created by Beaudoin et al. (2014) were constructed at a 250 m spatial resolu-tion using remote sensing MODIS data sets, combined with photo-plot observations of Canada’s National Forest Inven-tory (NFI), mainly in the southern areas (see non-hatched area in Fig. 4). We aggregated the 250 m data to a 10 km res-olution and applied a correction for the vegetated treed frac-tion of the landscape, as defined by Beaudoin et al. (2014). The vegetated treed fraction corresponds to the fraction of the grid cells that are covered by tree species of any size on at least 10 % of the grid cell.
Total aboveground biomass, estimated using two other methods reported by Margolis et al. (2015), was used for a second evaluation of model simulations for the five eco-zones under study. The BS ecozone was divided into three ecoregions for comparison purposes (Fig. 1); ecoregions cor-respond to the classification of ecological regions on a finer scale than ecozones. The first method of biomass estima-tion is based upon the Geoscience Lidar Altimetry System (GLAS) method, which estimates total aboveground biomass from the waveforms recorded over vegetated land using lidar instruments. The second method is based upon NFI photo-plot estimates of total aboveground biomass using allometric equations.
2.7 History of the eastern boreal forest of Canada described by LPJ-LMfire
The outputs of LPJ-LMfire for the eastern boreal forest of Canada were analyzed in terms of annual burn rates, NPP, and total aboveground biomass. Significant changes in each temporal series were highlighted by a regime shift calcula-tion developed by Rodionov (2004, 2006). A sequential ap-plication of Student’s t test on 1000 randomly chosen grid cells was used (Rodionov, 2004, 2006). To be statistically significant at P = 0.10, the difference (diff) between mean
50° W 60° W 70° W 80° W 90° W 100° W 55 ° N 60 ° N 65 ° N 50 ° N ! ! ! ! ! ! ! ! ! ! ! ! ! ! ! ! ! ! ! ! ! ! ! ! ! ! ! ! ! ! ! ! ! ! ! ! ! ! ! ! ! ! ! ! ! ! ! ! ! ! ! ! ! ! ! " " " " " " " " " " " " " " " " " " " " " " " " " " ! ! ! ! ! ! ! ! ! ! 0 250 500 1,000km
±
1980–2012 Percent Not enough fire in LPJ-LMfireToo much fire in LPJ-LMfire (a) (b) (c) (d) A t l a n t i c O c e a n H u d s o n B a y 1980–2012 1980–2012 1911–2012 vs. historical -100–-50 -50–-25 -25–0 0 0–25 25–50 50–100 > 100 < 0.1 % 0.1–0.5 % 0.5–1.0 % 1.0–2.0 % > 2.0 %
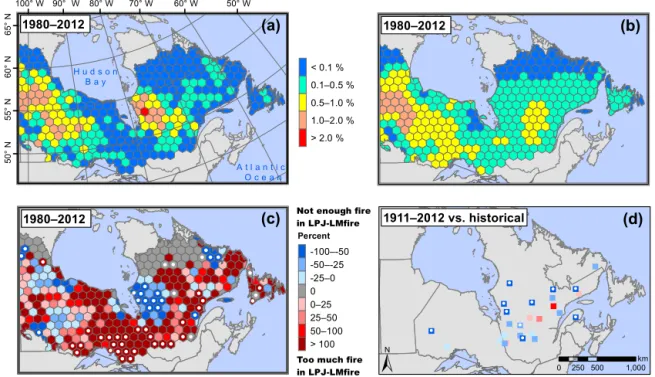
Figure 2. Observed versus LPJ-LMfire-simulated annual burn rates across eastern boreal Canada. (a) Observed annual burn rates computed for 365 hexagonal cells between 1980 and 2012 (data from Natural Resources Canada, 2017). (b) LPJ-LMfire simulated annual burn rates computed over the same period and hexagonal cells. (c) Percent age of difference between observed and simulated annual burn rates. (d) Percent age of difference between historical annual burn rates reconstructed from stand-replacing fire history studies (data from Girardin et al., 2013b; Héon et al., 2014; Portier et al., 2016) and LPJ-LMfire-simulated annual burn rates between 1911 and 2012 (see Supplement S4 for further details). White points indicate where the observed (and historical) annual burn rate lies outside the 95 % confidence interval (95 % CI) of the averaged annual burn rates in hexagonal cells simulated by LPJ-LMfire.
values of two subsequent periods that was determined ac-cording to Student’s t test should satisfy the condition diff = t
q
2σi2/ l, (1)
where t is the value from the t distribution with 2l−2 degrees of freedom at the given probability level P , l is the cut-off length of the growth phase to be determined (hereafter set to periods of 20 years), and σi2 is the average variance for running l-year intervals. The sample proportion, representing the fraction of k cells (integer ≥ 0) of a given population N (integer > 0), which was identified positively as recording a growth decline (or release), a biomass reduction (or biomass increase), and an increase in fire activity (or decrease), was computed for each sampled year from 1920 to 2007. 2.8 Sensitivity analysis to CO2fertilization
In terrestrial ecosystem models, changes in atmospheric CO2 concentration in the recent past and future often have a more important influence on vegetation than does climate change (Girardin et al., 2011). Therefore, their inclusion has a very important effect on simulated changes in productivity. Here, the effect of CO2fertilization was explored using two exper-iments. In the first experiment, “Climate + CO2”, we ran the
model with increases in CO2 concentration as presented in Sect. 2.4.4. This experiment was used throughout our evalu-ation of LPJ-LMfire simulevalu-ations. In the second experiment, “Climate-only”, we ran the model with a constant CO2 con-centration from 1901 to 2012, which was fixed at 296.23 ppm (year 1901 value). In this case, there was no response of veg-etation gross primary production (GPP) or fire to changes in CO2concentration. The effect of CO2fertilization on vege-tation was determined by the difference between simulations “Climate + CO2” and “Climate-only”. Due to the post-fire recruitment rules established in LPJ-LMfire (see Sect. 2.5.2), the effect of CO2fertilization on fire was only determined by comparing the spatial pattern of annual burn rates simulated with the “Climate + CO2” and “Climate-only” experiments.
3 Results
We report on the evaluation of process-based model perfor-mance in adequately simulated spatial patterns of fire fre-quency and fuel conditions (as indicated by the aboveground biomass of the four PFTs and total NPP) in eastern boreal Canada. We also report on changes in fire activity during the last century as simulated by LPJ-LMfire, with associated changes in vegetation features.
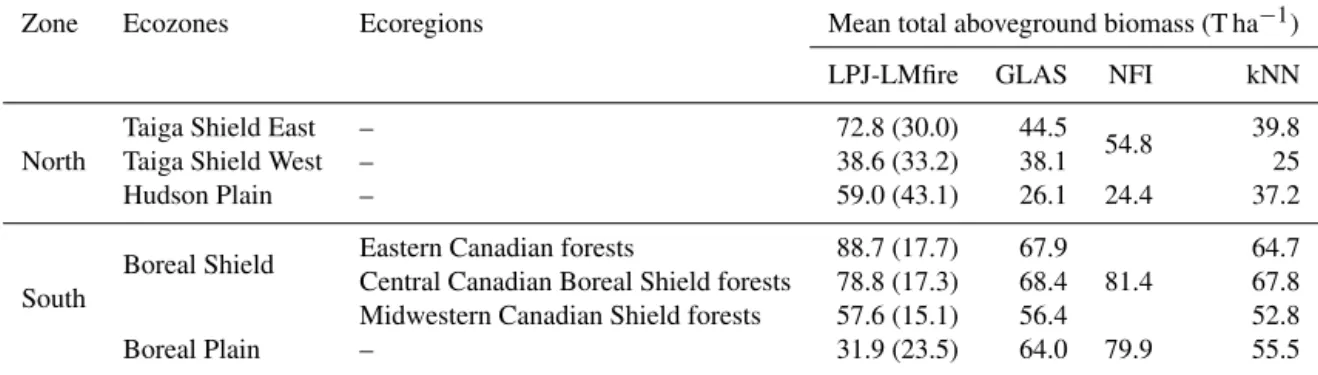
Table 2. LPJ-LMfire vs. Margolis et al. (2015) mean total aboveground biomass estimates (with standard deviations) between 2000 and 2006 across five ecozones in eastern boreal Canada. The Boreal Shield ecozone was divided into three ecoregions (ecozone subdivisions) for comparison.
Zone Ecozones Ecoregions Mean total aboveground biomass (T ha−1)
LPJ-LMfire GLAS NFI kNN
North
Taiga Shield East – 72.8 (30.0) 44.5
54.8 39.8
Taiga Shield West – 38.6 (33.2) 38.1 25
Hudson Plain – 59.0 (43.1) 26.1 24.4 37.2
South
Boreal Shield Eastern Canadian forests 88.7 (17.7) 67.9 81.4
64.7 Central Canadian Boreal Shield forests 78.8 (17.3) 68.4 67.8 Midwestern Canadian Shield forests 57.6 (15.1) 56.4 52.8
Boreal Plain – 31.9 (23.5) 64.0 79.9 55.5
3.1 Predictive skills of the LPJ-LMfire model 3.1.1 Fire activity
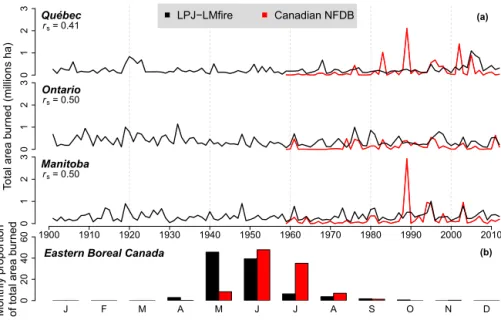
For the recent 1980–2012 period, mean and maximum sim-ulated annual burn rates were 0.36 and 1.49 % yr−1, respec-tively (Fig. 2b), while mean and maximum observed annual burn rates were 0.28 and 2.03 % yr−1(Fig. 2a). Observed and simulated burn rates were not significantly different in more than 80 % of the studied hexagonal cells (295 out of 365; Fig. 2c). Therefore, LPJ-LMfire was able to capture the am-plitude of interregional variation. Decreases in fire activity observed along both the latitudinal gradient in Manitoba and the longitudinal gradient from Manitoba to southern Ontario were well reproduced by the simulation (Fig. 2a and b). Fur-thermore, more than half of the observed historical annual burn rates fell within the 95 % CI of their corresponding sim-ulated annual burn rates (for further details, see Table S2). LPJ-LMfire overestimated annual burn rates from south of the Hudson Bay in Ontario to southwestern Québec (Fig. 2c), while it underestimated annual burn rates in the western area of the central boreal forest in Québec (Fig. 2c). Spearman’s correlation coefficients (rs)of time series of observed ver-sus simulated area burned are 0.41 for Québec and 0.50 for Ontario and Manitoba (Fig. 3a). As revealed by these coef-ficients, LPJ-LMfire was also able to emulate year-to-year variability in annual areas that were burned in Manitoba and Ontario, but less so in Québec. High fire activity years over the temporal series were also captured in the simulations, in-cluding 1961, 1968, 2003, and 2005, mostly in Manitoba and Ontario (Fig. 3a). However, three extreme fire years were not reproduced: 1983, 1989, and 2002 (Fig. 3a). Based upon the comparison of monthly percentage of total areas that were burned between 1959 and 2012 in eastern boreal Canada, the simulated fire season generally started 1 month earlier than what was observed (Fig. 3b).
3.1.2 Fuels
Overall, the general latitudinal pattern of simulated total tree biomass agreed with the pattern of observed total tree biomass (Fig. 4a). Median simulated total tree biomass (with 90 % CI) in the southern areas (non-hatched) was 77 T ha−1 (33–108 T ha−1), while median observed total tree biomass in the same areas was 73 T ha−1 (36–100 T ha−1). In the BS ecozone, percentage differences between mean total tree biomass that was simulated and that which was estimated using NFI-based and GLAS-based methods were 31 and −7.8 %, respectively, and decreased along a westward gra-dient from Québec to Manitoba (Table 2). We greatly over-estimated mean total tree biomass in the BP ecozone because these differences were −60 and −50 %. For the TS ecozone in Québec and Manitoba, which corresponds to less inten-sively sampled northern regions (hatched areas), total tree biomass was largely overestimated, mostly in Québec, due to the high genus-specific biomass of the Picea PFT (Fig. 4b). In this ecozone, relative differences with GLAS-based esti-mates ranged from 1.3 % in the west to 63.6 % in the east, whereas it was only 1.6 % in comparison with NFI-based es-timates (Table 2). Greater relative differences were observed in the HP ecozone (Table 2), where we overestimated total tree biomass for grid cells in which edaphic limits were not too restrictive and where vegetation could establish (Fig. 4a). This overestimation was mainly due to the high biomass of the Picea and Populus PFTs (Fig. 4b). Despite local-scale overestimates, the range of genus-specific biomass variabil-ity in the Abies and Populus PFTs was well captured. 3.2 Fire history simulated by LPJ-LMfire 3.2.1 Fire activity
Simulated burn rates displayed multi-decadal variation over the 20th century, mostly in Manitoba and Ontario (Fig. 5a). The high fire activity that was reported for the 1910–1930 period was followed by a decrease in fire activity until the
0
1
2
3 Québec LPJ−LMfire Canadian NFDB
rs = 0.41 (a) 0 1 2 3 Ontario rs = 0.50 1900 1910 1920 1930 1940 1950 1960 1970 1980 1990 2000 2010 0 1 2 3 Manitoba rs = 0.50 J F M A M J J A S O N D (b) 0 20 40 60 Total area b ur
ned (millions ha)
Monthly propor
tion
of total area b
ur
ned
Eastern Boreal Canada
Figure 3. (a) Observed versus simulated total annual areas burned in three provinces of eastern Canada. Observed data (1959 to 2012) are from the Canadian National Fire Database (CNFDB). Spearman’s rank correlation between data is shown (correlations are significant at P< 0.05 for Québec and P < 0.001 for the other provinces). (b) Monthly percentage of total areas burned between 1959 and 2012 in eastern boreal Canada.
1970s, and then increased to levels similar to those of the early 20th century (Fig. 5a). Since the 1970s, annual burn rates have increased in central Manitoba and western On-tario and in the south-central area of Québec (Fig. 5a). Episodes of successive years of intense fire activity have occurred in 1908–1910, 1919–1923, 1995–1998, and 2002– 2007 (Fig. S5a). A similar temporal pattern of annual burn rates between 1901 and 2012 was reported in the “Climate-only” experiment, but with lower annual burn rates (Fig. S7). The simulated fire season was not stationary: a fire sea-sonality index (FSI) was computed as the percentage of difference between spring and summer total burned areas (Fig. S5b) and varied between 0.17 and 83 %. The period extending from the end of the 1960s to end of the 1990s cor-responds to a period during which several years of high FSI were observed compared with the entire time series. A FSI greater than 50 % was calculated for 1968, 1977, 1980, and 1993 (Fig. S5b). May and June were consistently the spring months with the largest burned areas, while summer months recorded fewer and fewer burned areas over the course of the 20th century.
3.2.2 Fuels
For the “Climate + CO2” experiment, the simulated annual NPP averaged over the entire study region and the whole pe-riod was 5.4 T ha−1, with a minimum of 4.2 T ha−1in 1907 and a maximum of 7.1 T ha−1 in 2003 (Fig. 5b). Both se-quential t -test analysis and temporal time series showed that NPP has increased since the 1970s (Fig. 6a and b), mostly in southern areas of Québec and in eastern Ontario (Fig. 5b).
This constant increase in NPP since the 1970s was not ob-served in Manitoba and western Ontario, where a signifi-cant increase in annual burn rates was observed (Fig. 5a). Some regions in south-central Ontario showed a decline in NPP during the early 20th century, and the same trend has been observed in south-central Québec since the 1980s. The proportion of cells recording a decline in NPP was particu-larly noteworthy in 2004 and 2006 (Fig. 6a and b). Differ-ences in NPP between the simulated “Climate + CO2” and “Climate-only” experiments highlighted that annual simu-lated NPP, averaged over the whole area, was positively cor-related with annual atmospheric CO2 concentration (r2= 0.767, P < 0.001). Mean percentage of increase in NPP that was incurred by rising CO2 concentration for our five time periods was 2.7, 5.5, 8.9, 16.7, and 27.6 % (Fig. S6), while it was 18 % for the entire period. An even larger effect of CO2fertilization was simulated in the extreme southern and northern parts of the study region (Fig. S6c).
Mean total aboveground biomass averaged 66.4 T ha−1in eastern boreal Canada over the 1901–2012 period. Mean to-tal aboveground biomass decreased slightly from the begin-ning of the 20th century until the 1930s and then increased until 1995, after which it reached a stable level (Fig. 5c). Pe-riods of total aboveground biomass loss that were recorded at the beginning of the 20th century correspond to high fire activity, as previously mentioned (Fig. 5a). Sequential t -test analysis of total aboveground biomass time series showed that biomass increase and reduction followed the same trends that were observed for growth releases and declines, respec-tively, until the year 2000 (Fig. 6c and d). Genus-specific
< 5 5–10 10–20 20–40 40–60 60–80 80–100 > 100 (a) Total tree biomass
(b) Genus-specific biomass Picea Abies Pinus Populus 60° W 70° W 80° W 90° W 100° W 50 ° N 45 ° N 40 ° N
Observed Simulated Differences (%)
¯
0 500 1,000KM -100–-50 -50–-25 - 25–0 0 0–25 25–50 50–100 > 100 m = 73T.ha-1 Underestimation Overestimation
m = 77
m = 30 m = 50
m = 4 m = 7
m = 4 m = 15
m = 3 m = 8
Figure 4. (a) Observed, LPJ-LMfire simulated, and differences (%) in mean total aboveground biomass (T ha−1) between 2000 and 2006 across eastern boreal Canada. (b) Genus-specific aboveground biomass. The observed aboveground biomass maps across Canada were predicted and validated with photo-plot information in the southern areas (non-hatched areas) and data published by Beaudoin et al. (2014). Median (m) tree aboveground biomass values are also indicated for each map; these were calculated for the non-hatched areas at a 10 km resolution.
aboveground biomass of the Picea, Pinus, and Populus PFTs showed the same increasing trends over the past century, whereas Abies PFT aboveground biomass decreased until the year 1960, before regaining the value it had at the begin-ning of the 20th century (Fig. S8a). The strongest variation in total aboveground biomass occurred for the Picea PFT; it varied from a minimum of 27.8 T ha−1 in 1910 to a maxi-mum of 36.7 T ha−1in 2003 (Fig. S8a). Conversely, genus-specific aboveground biomass of Abies, Pinus, and Populus PFTs varied by less than 1, 2, and 3 T ha−1, respectively, over the same period (Fig. S8a). The ratio of mean genus-specific aboveground biomass in the recent 1991–2012 period, when
compared with the past period of 1911–1930, was 1.23, 1.04, 1.13, and 1.31 for the Picea, Abies, Pinus, and Populus PFTs, respectively. The highest ratios for each PFT were found in the northern areas (Fig. S8b).
4 Discussion
4.1 Agreements and disagreements in fire activity and forest growth
We used LPJ-LMfire, which was driven by gridded clima-tology, atmospheric CO2 concentration, and an estimate of
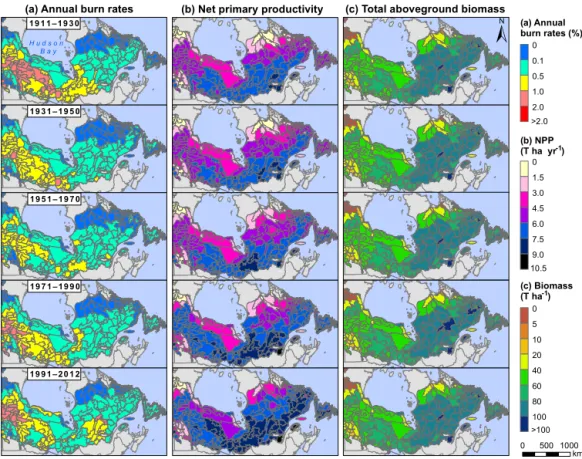
1911–1930 1931–1950 1951–1970 1971–1990 1991–2012
±
0 5001000 km H u d s o n B a y (b) NPP (T ha yr ) (c) Biomass (T ha ) (a) Annual burn rates (%)(a) Annual burn rates (b) Net primary productivity (c) Total aboveground biomass
0 5 10 20 40 60 80 100 >100 0 1.5 3.0 4.5 6.0 7.5 9.0 10.5 0 0.1 0.5 1.0 2.0 >2.0 -1 -1
Figure 5. LPJ-LMfire-simulated (a) annual burn rates (%), (b) net primary productivity (T ha−1yr−1), and (c) total aboveground biomass (T ha−1) across eastern boreal Canada for five periods between 1911 and 2012.
lightning strike density to study the pyrogeography of east-ern Canada’s boreal forest. Compared with the previous mod-elling efforts that had been conducted by Pfeiffer et al. (2013) using the original LPJ-LMfire model, the results that are re-ported here show substantial improvement in the capacity of the DGVM to simulate fire ignition in the Canadian boreal forest. The use of a high-quality lightning strike data set in-stead of the low-resolution LIS/OTD global data set that was used by Pfeiffer et al. (2013) allowed us to capture the spa-tial gradient of fire activity in a substanspa-tially better manner (Baker et al., 2016). The results confirmed that fire in the study area is strongly ignition limited, while most fire mod-els have simply assumed that fire would always occur un-der appropriate weather and fuel conditions, e.g., SIMFIRE (Hantson et al., 2016). LPJ-LMfire simulations confirmed the necessity of simulating fire in a model as the product of the probabilities that are associated with fuel, moisture and igni-tion.
Interannual variation in lightning strike density was more faithfully reproduced when weighting the mean flash clima-tology with the CAPE variable to predict lightning-induced fire ignitions and their variability (Peterson et al., 2010). However, this variation is still constrained by the short tem-poral depth of the years of record in the CLDN lightning
strike data set (Orville et al., 2002; Kochtubajda and Bur-rows, 2010). Synchronicity in major fire activity years across provinces (e.g., 1961, 2005, 2007) was consistent with sev-eral studies on fire history, suggesting that changes in forest fire activity have been observed jointly over vast areas since the 1900s (e.g., Bergeron et al., 2004b; Macias Fauria and Johnson, 2008).
Annual burn rates (recent and historical) were underes-timated in many areas of northern Québec. It appears that the simulation could not capture the expression of a climate type that is encountered in the Clay Belt of northwestern Québec, where periodic drought is known to occur. This may likely reflect some limitation that is imposed by the low den-sity of weather stations north of 49◦N. The lack of station replication can create excessively smoothed climate records, thereby reducing the possibility of correctly emulating the relationship between climate and forest fire activity during extreme drought and fire years (Girardin et al., 2006b, 2009; Xiao and Zhuang, 2007). For example, 1989 is known as a drought year, which was induced by changes in atmospheric circulation that were at the origin of numerous large fires (> 50 000 ha) in Manitoba and Québec (Fig. S4; Goetz et al., 2006; Xiao and Zhuang, 2007). Other large fires exceeding 50 000 ha were observed in northern Québec in 1983 and
Growth release Growth decline −4 −2 0 2 4 6 Ann ual propor tion (%) (a) Decadal propor tion (%) −30 −15 0 15 30 (b) Biomass increase −4 −2 0 2 4 6 Ann ual propor tion (%) Biomass reduction (c) Decadal propor tion (%) −30 −15 0 15 30 1900 1920 1940 1960 1980 2000 (d)
Figure 6. (a) Annual and (b) decadal (smoothed over 10-year sums) proportions of cells showing a significant decline or release in NPP with 90 % confidence intervals (error bars) computed using Bayes’ method. (c) Annual and (d) decadal (smoothed over 10-year sums) proportions of cells showing a significant reduction or increase in biomass total aboveground with 90 % confidence intervals (error bars) computed using the same method.
2002 (Fig. S4). However, these extreme weather conditions were not reproduced in our input data set and, consequently, the model could not simulate these very large fires. These un-derestimates may also result, in part, from the lack of light-ning strike records in these northernmost regions, which pre-vents fire ignition from being simulated there. Polarity or en-ergy of lightning was not taken into account in our simula-tions. Positive lightning strikes (transfers of positive charges to the ground) mainly occur in the north and correspond to 10 % of all lightning strikes (Morissette and Gauthier, 2008), with the remaining lightning strikes being negative. Posi-tive lightning strikes correspond to an exchange of energy between the highest part of the clouds and the soil, while negative lightning strikes are triggered in a lower part of the clouds. For this reason, positive lightning strikes are more likely to start fires because they carry higher energy owing to the greater travelling distance between the clouds and the soil (Flannigan and Wotton, 1991). As previously mentioned, the number of lightning sensors in northern regions (hatched ar-eas in Fig. 4) is also limited (Orville et al., 2011), leading to a decrease in detection efficiency at these latitudes
(Moris-sette and Gauthier, 2008). Thus, 10 % of positive lightning strikes are not appropriately captured and, consequently, the probability of fire ignition is also likely to be underestimated in these areas. Underestimation of fire activity in northern areas had consequences for the simulation results. Amongst other things, simulated tree mortality was underestimated and, hence, biomass proliferated (as can be noted in Fig. 4 with the Picea PFT).
4.2 History of fire in the eastern boreal forest of Canada described by LPJ-LMfire
Based upon the above preliminary agreement and despite some disagreements, the temporal patterns of annual burn rates that were simulated by LPJ-LMfire were strongly con-sistent with the forest fire histories that have been recon-structed in many studies (e.g., Stocks et al., 2003; Bergeron et al., 2004a; Girardin et al., 2006a). Multidecadal temporal changes in annual burn rates reflect the underlying influence of climate variability and extreme fire weather (Macias Fau-ria and Johnson, 2008; Girardin et al., 2009); these multi-decadal temporal changes were well represented in the input climate data sets. An increase in temperatures and stability in precipitation between 1916 and 1924 (Fig. S9) could be at the origin of a high frequency of fire occurrence during those years, marking a pause in the decline of fire activity that had been observed since the 1850s (Bergeron et al., 2004a). Ad-vection of humid air masses over eastern Canada between 1940 and 1970 contributed to the creation of moister condi-tions, which can lessen the capacity of a fire to spread after a lightning-induced fire ignition (Macias Fauria and John-son, 2008). Both interannual variation and unsynchronized trends in climatic variables may have brought about changes in fire activity and could have affected the fire season, as it is proposed to have occurred over millennial timescales dur-ing the Holocene (Ali et al., 2012). For example, durdur-ing the years 1977 and 1980, an increase in spring temperatures was observed, whereas spring precipitation decreased, which re-sulted in the total areas that were burned in spring being 50 % greater than in summer (Fig. S9).
Correlations between simulated and observed provincial annual burn rates were slightly higher than what has typically been encountered in past studies of fire–climate relationships over the region (e.g., Girardin et al., 2004, 2006a, 2009). For example, Girardin et al. (2009) reported that about 35 % of the variance in the annual areas that were burned in the provinces of Ontario and Québec was explained by summer moisture availability. In our modelling experiment, we ob-tained values between 41 and 50 % for these same provinces, without empirical adjustments (e.g., through regression anal-ysis). The improvements that were made here reinforce the idea that aside from “top-down” climate control on fire ac-tivity, other factors such as lightning, fuel availability, and composition can influence fire statistics (Podur et al., 2002). This highlights the necessity of reconstructing fire history in
a complex system that is related to climate and vegetation by taking into account several feedbacks (Hantson et al., 2016). LPJ-LMfire simulations provide evidence for the com-bined influence of fuel conditions and ignition sources on fire within our study area. Indeed, an increase in precipita-tion around the 1930s constrained fire activity, despite a very high lightning strike density (Fig. S9). Conversely, at the end of the century, an increase in lightning strike density and a drier climate (Fig. S9) resulted in an increase in annual burn rates. The seasons during which precipitation events and lightning ignitions occur were also found to be impor-tant. Notably, LPJ-LMfire did not simulate the core of the fire season between June and August when the highest den-sity of lightning strikes takes place (Morissette and Gauthier, 2008). This phenomenon finds an explanation in that heavy and intense rain events occurring later during the summer decrease the probability of starting fires; weather becomes less conducive to fire due to higher amounts of precipitation between July and September in comparison with April and June. That being said, our simulation was biased with regard to the onset of fire seasonality. LPJ-LMfire simulated the core of the fire season earlier than what is actually observed. LM-fire excludes LM-fire ignition when snow cover is present (Pfeif-fer et al., 2013). However, detailed investigations at the grid-cell level in our study area revealed that the fire danger in-dex, which was calculated by the LMfire module, was high as soon as all snow had melted in May and June. This in-dex estimates the probability that an ignition event will start a fire, depending upon both fuel moisture and fire weather conditions (Thonicke et al., 2010). As suggested by Pfeiffer et al. (2013), LPJ-LMfire simulates a very quick drying-out of soils in spring when the snow cover has disappeared or snowmelt has occurred prematurely. This phenomenon may be the reason why it simulated fire season onset earlier than what is observed in Canada’s eastern boreal forest.
CO2-induced enhancement of NPP (Norby et al., 2005; Huang et al., 2007) was clearly emulated in LPJ-LMfire. Our simulated 18 % growth enhancement, with a 32.5 % increase in CO2 concentration between 1901 and 2012, was higher than the 15 and 14 % growth increases that have been pro-posed by Hickler et al. (2008) and Girardin et al. (2011), respectively. LPJ-LMfire is highly sensitive to atmospheric CO2concentration and interpreting its impacts must be car-ried out with caution (Girardin et al., 2011). That being said, our results suggest that CO2-induced enhancement of forest productivity can be offset by fires and climate, which is con-sistent with the results of Hayes et al. (2011) and Kelly et al. (2016). Despite strong CO2-induced enhancement of for-est productivity in LPJ-LMfire, the total amount of above-ground biomass and forest composition did not change sig-nificantly during the course of the simulation period. The CO2-induced enhancement of NPP had a positive influence on annual burn rates by increasing the availability of fuel. Under very dry conditions, such as in 1971–1990 and 1991– 2012, an increase in fire activity led to a decrease in growth
and biomass. Drier conditions during the past few decades provided indications for an increase in growth decline events and in biomass reduction related to an increase in fire activity. A similar trend in such conditions was observed around the 1920s, but the range of these negative events during the past decades exceeds the historical range of variability recorded by the simulated forest. Fires had a non-negligible influence on the state of the boreal forest in eastern Canada, especially during the last few decades, but our results also confirm the relative influence of climate alone on the forest in northern regions. Indeed, in northern areas in Québec and Manitoba, biomass has not significantly increased, despite a very strong effect of CO2-induced enhancement (Fig. S6). We hypothe-size that with ongoing global warming, growth decline events could increase substantially, given that the positive effect of CO2concentration on the growth of forests may not be strong enough to compensate for the loss of biomass to fires and climate change (Kurz et al., 2008), which could lead to the opening up of landscapes.
4.3 Uncertainties and future perspectives
The present study demonstrated that LPJ-LMfire is gener-ally able to capture fire history and forest growth trends in the eastern boreal forest of Canada. However, several un-certainties persist. First, forest establishment and the start of growth during the spin-up phase was simulated using a de-trended version of modern climate, as is usually performed in DGVM runs (Prentice et al., 2011; Pfeiffer et al., 2013; Yue et al., 2016; Knorr et al., 2016). This initial condition as-sumes that past relationships between climate, fire, and veg-etation have been stationary through time and that variabil-ity in modern climate is representative of all variabilvariabil-ity that has been recorded over the past 1200 years (time of spin-up phase + 112 years of simulation). However, it has been in-creasingly recognized that such an assumption is invalid and that modern observations are not a good analogue for prehis-toric variability (Kelly et al., 2016; Hudiburg et al., 2017). For example, fire activity over much of the Holocene was higher in terms of frequency and fire size than the current levels across broad areas of eastern Canada (Girardin et al., 2013a; Remy et al., 2017). It is likely that not accounting for such variability may introduce biases in forest produc-tivity dynamics and levels, more specifically on soil carbon dynamics (Hudiburg et al., 2017). This may be less problem-atic when studying fire and forest dynamics over the last cen-tury because the mean age of the major part of eastern boreal forest is less than 100 years (Bergeron et al., 2002).
The non-negligible influence of forest composition on fire regimes (Hély et al., 2001) is limited in the model to the representation of three needleleaf PFTs and one broadleaf PFT. Improving LPJ-LMfire’s representation of biodiversity with further broadleaf PFT genera could counterbalance or offset overestimates of fire activity in southern areas since these species are less flammable than needleleaf species.
Similarly, improving LPJ-LMfire parametrization to account for mosses could reduce overestimation of the quantity of fuel available in northern areas. In the Clay Belt, the poor drainage conditions induced by the presence of an imperme-able clay substrate, flat topography, and a cold climate fa-cilitate the accumulation of thick layers of organic soil, an edaphic process that is referred to as paludification (Fenton et al., 2006). Once Sphagnum species increase on the for-est floor, the depth of burn varies only slightly in response to changes in weather conditions, owing to very low fluctu-ations in the degree of water saturation of the organic layer (Fenton et al., 2006).
In the present study, simulations are limited by the rel-atively low accuracy of soil attributes in databases for Canada’s boreal forest (Hengl et al., 2014). The input data set of soil attributes that was used in our simulations tended to underestimate clay and sand percentages in our study area when compared to point observations (Fig. S10). These ef-fects add up to other weaknesses in physiological constraints, such as cold climate not being sufficiently restrictive and allowing Picea to become overly abundant in the simula-tion runs. While a previous study showed that the abun-dance of Picea decreases with latitude in the tundra region and is coupled with the occurrence of dwarf shrubs in the Ericaceae and herbs (Gajewski et al., 1993), such species were not parametrized in the current version of LPJ-LMfire due to a lack of information on their physiological and bio-geographical preferences. Future research could incorporate recently developed parameterizations for boreal shrubs and non-vascular plants into LPJ-LMfire (Druel, 2017; Druel et al., 2017).
Forest stand structure and successional dynamics (age classes), together with processes leading to the formation of peatlands, are not included in the present version of LPJ-LMfire. However, all of these aspects are important determi-nants of fire ignition and propagation under a given climate (Hély et al., 2001) and can also influence the distinction be-tween crown and surface fires, which affect tree mortality dif-ferently (Hély et al., 2003; Yue et al., 2016). Moreover, LPJ-LMfire, like most DGVMs, does not consider constraints on species migrations, phenotypic plasticity, and local adapta-tion of species (Morin and Thuiller, 2009). The simulaadapta-tion results may be overly optimistic in terms of the capacity of southern species to colonize newly available areas in north-ern regions as the climate warms. As previously mentioned by Morin and Thuiller (2009), species colonization in north-ern regions could be limited by forest attributes, such as frag-mented landscapes or high competition levels from existing species, or through migrational lag (Epstein et al., 2007).
Wildland fires are the most important natural disturbances in Canada’s eastern boreal forest, but non-fire and human dis-turbances also have considerable effects (Price et al., 2013) and may influence fire activity trajectories indirectly. Inte-grating a range of forest disturbances into a DGVM could improve the accuracy of forecasting and modelling climate
change effects on Canada’s eastern boreal forest. For in-stance, insect damage (MacLean, 2016) and outbreaks of eastern spruce budworm (Choristoneura fumiferana) in par-ticular (Zhang et al., 2014; James et al., 2017) represent sig-nificant forest disturbances by the way they temporarily al-ter forest structure by affecting specific tree growth, tree sur-vival, regeneration, and succession. These disturbances can also have an important impact on fire activity by modifying fuel distribution and connectivity (James et al., 2017). Ad-ditionally, successive fires that take place over a short pe-riod before the trees have attained maturity can lead to com-plete regeneration failure (Girard et al., 2008). Such events in young, unproductive stands can also lead to modified for-est composition (Girard et al., 2008) and could exert a strong feedback on ecosystem structure by generating changes in temporal fire patterns over long timescales. Finally, the ef-fects of human activities, such as forest management and ac-tive fire suppression efforts, on the composition and distri-bution of forest fuels were not implemented in the present LPJ-LMfire simulations. Nonetheless, the strong correlation between our simulated annual burn rates and observed data suggests that active fire suppression efforts and forest man-agement since about the 1950s (Le Goff et al., 2008; Lefort et al., 2003) have not contributed much to shifting fire be-haviour trajectories in our study region, which admittedly has very low densities of both population and infrastructure in comparison with other populated areas such as in the United States (e.g., Syphard et al., 2017).
5 Conclusions
In this study, we used LPJ-LMfire to simulate fire activity from 1901 to 2012 in Canada’s eastern boreal forest, at a 10 km resolution. LPJ-LMfire was parametrized for the pdominant forest tree genera that are present in our study re-gion, i.e, Picea, Abies, Pinus, and Populus. The predictive skill of the model to simulate fire activity was determined by comparing our model simulations with published data. LPJ-LMfire was able to simulate interannual- to decadal-scale fire variability from the beginning of the 20th century. How-ever, the low density of weather stations in northern areas likely limited the model’s ability to capture some extreme fire years. Our study highlights the importance of changes in climate variables on multi-decadal and annual timescales in strongly controlling spatiotemporal patterns of fire that were simulated by LPJ-LMfire. Spatiotemporal patterns were well captured, based upon our climate data inputs. Despite an overarching CO2-induced enhancement of NPP in LPJ-LMfire, aboveground biomass was relatively stable because of the compensatory effects of increasing fire activity. This study helps reduce uncertainties in our knowledge regarding fire patterns in the recent past and confirms that fires have been a dominant driver of boreal forest in eastern Canada during the last century. We further provide a new tool to
re-fine predictions of future fire risks and effects of ongoing cli-mate change in these forests to better inform management and improve risk mitigation strategies.
Code availability. The source code of LPJ-LMfire is available at https://github.com/ARVE-Research/LPJ-LMfire/tree/v1.3 (Kaplan et al., 2018).
Supplement. The supplement related to this article is available online at: https://doi.org/10.5194/bg-15-1273-2018-supplement.
Author contributions. EC, MG, YB, and CH conceived and de-signed the study. EC performed the simulations and prepared input data sets with the help of JK. JP performed statistical calculations of annual burn rates for our simulation period according to the protocol described by Portier et al. (2016). EC, MG, JK, YB, and CH inter-preted the results. EC prepared the paper with contributions from all co-authors.
Competing interests. The authors declare that they have no conflict of interest.
Acknowledgements. This study was made possible thanks to the financial support provided by the European IRSES NEWFOREST project, the Forest Complexity Modelling (FCM) program, and the NSERC Strategic and Discovery programs. Jed Kaplan was supported by the European Research Council (COEVOLVE 313797). This research was conducted as part of the International Associated Laboratory MONTABOR (LIA France–Canada) and the International Research Group on Cold Forests. We thank Melanie Desrochers and Xiao Jing Guo for their help with mapping and computation for this project. We also thank Daniel Stubbs from Calcul Québec and Compute Canada for help with the Fortran language and server space facilities for running LPJ-LMfire. We also thank William F. J. Parsons and Isabelle Lamarre for English language editing of a previous version of the paper and the two anonymous reviewers for comments on an earlier version. Edited by: Paul Stoy
Reviewed by: two anonymous referees
References
Ali, A. A., Carcaillet, C., and Bergeron, Y.: Long-term fire fre-quency variability in the eastern Canadian boreal forest: the influ-ences of climate vs. local factors, Glob. Change Biol., 15, 1230– 1241, https://doi.org/10.1111/j.1365-2486.2009.01842.x, 2009. Ali, A. A., Blarquez, O., Girardin, M. P., Hely, C., Tinquaut, F.,
El Guellab, A., Valsecchi, V., Terrier, A., Bremond, L., Gen-ries, A., Gauthier, S., and Bergeron, Y.: Control of the multi-millennial wildfire size in boreal North America by spring
cli-matic conditions, P. Natl. Acad. Sci. USA, 109, 20966–20970, https://doi.org/10.1073/pnas.1203467109, 2012.
Andrews, P. L., Bevins, C. D., and Seli, R. C.: BehavePlus fire modeling system, version 4.0: User’s Guide, available from: https://www.fs.fed.us/rm/pubs/rmrs_gtr106.pdf (last access: 24 July 2017), 2008.
Baker, D. J., Hartley, A. J., Butchart, S. H. M., and Willis, S. G.: Choice of baseline climate data impacts projected species’ re-sponses to climate change, Glob. Change Biol., 22, 2392–2404, https://doi.org/10.1111/gcb.13273, 2016.
Beaudoin, A., Bernier, P. Y., Guindon, L., Villemaire, P., Guo, X. J., Stinson, G., Bergeron, T., Magnussen, S., and Hall, R. J.: Map-ping attributes of Canada’s forests at moderate resolution through kNN and MODIS imagery, Can. J. Forest Res., 44, 521–532, https://doi.org/10.1139/cjfr-2013-0401, 2014.
Beauregard, F. and de Blois, S.: Beyond a climate-centric view of plant distribution: edaphic variables add value to distribution models, PLoS One, 9, e92642, https://doi.org/10.1371/journal.pone.0092642, 2014.
Bergeron, Y., Richard, P. J., Carcaillet, C., Gauthier, S., Flannigan, M., and Prairie, Y.: Variability in fire frequency and forest com-position in Canada’s southeastern boreal forest: a challenge for sustainable forest management, Conserv. Ecol., 2, 1–10, 1998. Bergeron, Y., Leduc, A., Harvey, B. D., and Gauthier, S.: Natural
fire regime: A guide for sustainable management of the Canadian boreal forest, Silva Fenn., 36, 81–95, 2002.
Bergeron, Y., Gauthier, S., Flannigan, M., and Kafka, V.: Fire regimes at the transition between mixedwood and coniferous boreal forest in northwestern Quebec, Ecology, 85, 1916–1932, https://doi.org/10.1890/02-0716, 2004a.
Bergeron, Y., Flannigan, M., Gauthier, S., Leduc, A., and Lefort, P.: Past, current and future fire frequency in the Canadian boreal for-est: implications for sustainable forest management, Ambio, 33, 356–360, https://doi.org/10.1579/0044-7447-33.6.356, 2004b. Bergeron, Y., Chen, H. Y., Kenkel, N. C., Leduc, A. L., and
Macdonald, S. E.: Boreal mixedwood stand dynamics: ecolog-ical processes underlying multiple pathways, Forest. Chron., 90, 202–213, https://doi.org/10.5558/tfc2014-039, 2014.
Bond, T. C., Streets, D. G., Yarber, K. F., Nelson, S. M., Woo, J.-H., and Klimont, Z.: A technology-based global inventory of black and organic carbon emissions from combustion, J. Geophys. Res.-Atmos., 109, D14203, https://doi.org/10.1029/2003JD003697, 2004.
Boulanger, Y., Gauthier, S., Burton, P. J., and Vaillancourt, M.-A.: An alternative fire regime zonation for Canada, Int. J. Wildland Fire, 21, 1052–1064, 2012.
Boulanger, Y., Gauthier, S., and Burton, P. J.: A refinement of models projecting future Canadian fire regimes using homo-geneous fire regime zones, Can. J. Forest Res., 44, 365–376, https://doi.org/10.1139/cjfr-2013-0372, 2014.
Brandt, J. P.: The extent of the North American boreal zone, Envi-ron. Rev., 17, 101–161, https://doi.org/10.1139/A09-004, 2009. Canadian Council of Forest Ministers: National Forestry Database.
Forest Fire Statistics by Province/Territory/Agency, 1990– 2016, available from: http://nfdp.ccfm.org/data/compendium/ html/comp_31e.html, last access: 8 June 2017.
Canadian Forest Service: National Fire Database – Agency Fire Data, Natural Resources Canada, Canadian Forest Service, Northern Forestry Centre, Edmonton, Alberta, available from: