Bypassing the Financial Growth Cycle: Evidence from Capital Pool Companies
43
0
0
Texte intégral
(2) CIRANO Le CIRANO est un organisme sans but lucratif constitué en vertu de la Loi des compagnies du Québec. Le financement de son infrastructure et de ses activités de recherche provient des cotisations de ses organisations-membres, d’une subvention d’infrastructure du Ministère du Développement économique et régional et de la Recherche, de même que des subventions et mandats obtenus par ses équipes de recherche. CIRANO is a private non-profit organization incorporated under the Québec Companies Act. Its infrastructure and research activities are funded through fees paid by member organizations, an infrastructure grant from the Ministère du Développement économique et régional et de la Recherche, and grants and research mandates obtained by its research teams. Les organisations-partenaires / The Partner Organizations PARTENAIRE MAJEUR . Ministère du Développement économique et régional et de la Recherche [MDERR] PARTENAIRES . Alcan inc. . Axa Canada . Banque du Canada . Banque Laurentienne du Canada . Banque Nationale du Canada . Banque Royale du Canada . Bell Canada . BMO Groupe Financier . Bombardier . Bourse de Montréal . Caisse de dépôt et placement du Québec . Développement des ressources humaines Canada [DRHC] . Fédération des caisses Desjardins du Québec . GazMétro . Hydro-Québec . Industrie Canada . Ministère des Finances du Québec . Pratt & Whitney Canada Inc. . Raymond Chabot Grant Thornton . Ville de Montréal . École Polytechnique de Montréal . HEC Montréal . Université Concordia . Université de Montréal . Université du Québec à Montréal . Université Laval . Université McGill . Université de Sherbrooke ASSOCIE A : . Institut de Finance Mathématique de Montréal (IFM2) . Laboratoires universitaires Bell Canada . Réseau de calcul et de modélisation mathématique [RCM2] . Réseau de centres d’excellence MITACS (Les mathématiques des technologies de l’information et des systèmes complexes) Les cahiers de la série scientifique (CS) visent à rendre accessibles des résultats de recherche effectuée au CIRANO afin de susciter échanges et commentaires. Ces cahiers sont écrits dans le style des publications scientifiques. Les idées et les opinions émises sont sous l’unique responsabilité des auteurs et ne représentent pas nécessairement les positions du CIRANO ou de ses partenaires. This paper presents research carried out at CIRANO and aims at encouraging discussion and comment. The observations and viewpoints expressed are the sole responsibility of the authors. They do not necessarily represent positions of CIRANO or its partners.. ISSN 1198-8177.
(3) Bypassing the Financial Growth Cycle: Evidence from Capital Pool Companies* Cécile Carpentier†, Jean-Marc Suret‡ Résumé / Abstract Pour remédier à une discontinuité de marché supposée, les autorités canadiennes des valeurs mobilières ont mis en place le programme des sociétés de capital de démarrage. Celui-ci permet aux petites entreprises d’accéder directement au marché boursier, sans avoir recours aux étapes traditionnelles de financement de la croissance. Comparables aux Blind Pools américaines, les sociétés de capital de démarrage représentent plus de la moitié des émissions publiques initiales au Canada entre 1995 et 2001. Les hypothèses sous jacentes à ce programme, ainsi qu’à d’autres initiatives gouvernementales, sont les suivantes : 1) un nombre significatif de projets rentables ne peuvent pas être financés en utilisant les moyens de financement conventionnels, 2) les petites entreprises peuvent croître et être rentables sans les services fournis habituellement par les intermédiaires traditionnels, 3) les investisseurs individuels sont capables d’évaluer correctement le prix d’émission des petites, et généralement jeunes, entreprises. Notre analyse de près de 450 émetteurs résultants de ce programme ne permet pas de confirmer ces hypothèses. Les entreprises qui accèdent au marché boursier au moyen de ce programme sont de mauvaise qualité, ce qui est cohérent avec le paradigme de l’anti-sélection. Leur performance opérationnelle subséquente est anormalement faible, ce qui peut être relié à un manque d’outils d’incitation et de surveillance, ainsi qu’au même paradigme de l’anti-sélection. En outre, leur performance boursière est également anormalement faible, ce qui tend à montrer que les investisseurs individuels ne sont pas en mesure d’évaluer correctement le prix de ces nouvelles émissions, dans un contexte d’asymétrie informationnelle forte. En termes de politiques publiques, le développement de mécanismes de marché visant à faciliter l’accès au marché boursier d’entreprises en démarrage requiert un sérieux réexamen. Nos résultats confirment le rôle crucial joué par les intermédiaires de financement traditionnels auprès des petites entreprises. Mots clés : société de capital de démarrage, financement de la PME, émission publique initiale. *. We thank Ettore Croci, Michel Levasseur and seminar participants at the French Finance Association Conference (December 2003) and the Inaugural International Conference on Business, Banking and Finance (April 2004). J-M. Suret gratefully acknowledges financial support from the Social Sciences and Humanities Research Council of Canada (SSHRC). C. Carpentier gratefully acknowledges financial support from the Fonds Québécois de Recherche sur la Société et la Culture (FQRSC). The authors are associated with the CIRANO Research Centre (Montreal). The CIRANO web page is located at http://www.cirano.qc.ca/ † School of Accountancy, Faculty of Administrative Science, Laval University, Quebec, G1K 7P4, Canada. Tel.: +1-418-656-2131 # 6385; Fax: +1-418-656-7746; E-mail address: Cecile.Carpentier@fsa.ulaval.ca ‡ School of Accountancy, Faculty of Administrative Science, Laval University, Quebec, G1K 7P4, Canada, . Tel.: +1-418-656-2131 # 7134; Fax: +1-418-656-7746; E-mail address: Jean-Marc.Suret@fsa.ulaval.ca.
(4) To close an asserted equity gap, the Canadian regulators implemented the Capital Pool Company program, which enables small firms to directly access the stock market, thus bypassing the conventional growth cycle. Similar to American Blind Pools/Blank-Checks, Capital Pool Companies have spawned more than half of the new issues on Canadian stock markets between 1995 and 2001. Underlying this program, along with several other governmental actions, are three postulates: 1) a significant number of profitable companies cannot be financed using conventional tools, 2) small firms can grow and succeed without the full set of services usually provided by the specialized intermediaries, and 3) individual investors are able to correctly price the stocks issued by small and generally young firms. Our analysis of close to 450 issuers resulting from this program fails to confirm any of these postulates. Companies that access the stock market through this program are of low quality, which is consistent with the adverse selection paradigm. Their abnormally low subsequent operating performance can be traced to the lack of incentive and monitoring tools, along with the “lemon” principle. Moreover, their market performance is also abnormally poor, confirming that individual investors cannot correctly assess the fair value of new ventures, in a strong asymmetric information context. In terms of public policy, development of mechanisms intended to facilitate the entry of emerging companies on the stock market apparently requires serious reexamination. Our results confirm the essential role played by financial intermediaries in small business finance. Keywords: capital pool company, small business finance, initial public offering.
(5) 1. Executive summary According to Berger and Udell (1998), small businesses develop following a financial growth cycle in which financial intermediaries are crucial players. For firms needing outside equity, the initial public offering is often seen as the ultimate step in this developing process, even if numerous firms survive and grow as closed entities. During the growth cycle, the conventional funding providers (banks, sophisticated individual investors, private equity funds and investment bankers) play a crucial certification and monitoring role. Venture capitalists finance only a few of the hundreds of financing requests they receive each year. The equity gap proposition, which has been put forward in the U.S., the U.K. and Canada, asserts that this financing process is too selective and costly. Accordingly, there is an unsatisfied demand for external equity-based investment, which results in some profitable ventures’ being unrealized. To close this equity gap, Canadian policy makers have acted to increase the offer of capital available to young firms. However, regulators also attempted to use the stock market, specifically by reducing the listing requirements for small capitalization firms and introducing the Capital Pool Company program. The Capital Pool Company program is a virtual clone of the U.S. Blind Pools/Blank-Checks program. It was launched in Canada in the late 1980s. It allows for the listing of tiny firms, whose total assets are lower than CAN$1 million. Generally, these firms go public without any form of private equity. The lowering of listing requirements, the generalization of the Capital Pool Company program and the promotion of backdoor listings by the stock markets themselves have created an exceptional situation. In Canada, more than 50% of new listings during the 19952001 period are non-conventional initial public offerings. In the area of small business finance, Canadian policies foster methods that are considered very problematic in the U.S. The Capital Pool Company program relies implicitly on the following postulates: 1) a significant number of companies need external financing; they can provide a fair rate of return to external investors, but cannot be financed using conventional tools, 2) small firms can grow and succeed without the full set of services usually provided by conventional funding providers and 3) individual investors are able to correctly price the stocks issued by small and generally young. 1.
(6) firms. These postulates are not specific to the Capital Pool Company program. The first postulate, essentially the equity gap problem, is regularly cited to justify government intervention in the field of small business finance. The second assertion forms the basis of arguments in favor of lowering listing requirements. The last postulate underlies fiscal programs intended to encourage individuals to invest in initial public offerings of small companies, such as stock saving plans implemented in several Canadian provinces. Thus, the analysis of the Capital Pool Company program is a unique opportunity to assess whether these postulates are grounded in myth or reality, a question of great interest to policy makers, regulatory agencies and the private equity industry. From a theoretical standpoint, the success of financing methods such as the Capital Pool Company program can shed new light on the relevance of phenomena of asymmetric information, agency costs and contracting in the area of small business finance. To verify these postulates, we perform an in-depth analysis of the quality and performance of firms that use the Capital Pool Company program and bypass the traditional financial growth cycle. Our study shows that: 1) the Capital Pool Company program allows companies that are mostly nonviable to enter the stock market. These companies do not seem to possess the necessary elements to develop using public financial resources that, in principle, justify listing on the stock market. On average, the program seems to attract mostly low quality firms. It thus fails to confirm the equity gap postulate, but strongly confirms that adverse selection and asymmetric information problems are exacerbated in such a context. 2) On average, the vast majority of companies issuing from the Capital Pool Company program exhibit poor operating performance during the years following the listing. This is consistent with the concept that well designed contracts, incentive mechanisms and strong monitoring are essential for the growth of small businesses. However, this poor performance can be also rooted in the adverse selection problem evidenced above. This can be viewed as a confirmation of the essential role of conventional funding providers in screening and monitoring ventures. 3) The stock returns adjusted for variations in the index are strongly negative. We then observe a systematic mispricing at the issue. This confirms Fenn et al.’s (1996) observation that few investors have the requisite skill to directly invest in ventures, and is also compatible with a strong asymmetric information problem, which is inherent in the Capital Pool Company pattern. The program’s design is clearly. 2.
(7) insufficient to provide unsophisticated investors with the required information for a correct pricing of the stock at the time of the qualifying transaction. Our results also show that in terms of public policy, development of mechanisms intended to facilitate the entry of emerging companies on the stock market requires serious reexamination. The Canadian experience indicates that entry on the market at a precocious stage of development is generally not a valid option for growth financing. Bypassing the financial growth cycle by the direct listing of new ventures is therefore definitively not advisable. 2. Introduction Berger and Udell (1998, p.2) contend that small businesses develop following a financial growth cycle, in which financial intermediaries play a critical role as information producers that can assess small business quality and address information problems through the activities of screening, contracting and monitoring. For Gompers and Lerner (2001, p.155), these specialized financial intermediaries, such as venture capital organizations, can alleviate the information gaps, which allows firms to receive the financing that they cannot raise from other sources. For firms needing outside equity, the initial public offering is often seen as the ultimate step in this developing process, even if numerous firms survive and grow as closed entities. During the growth cycle, the conventional funding providers (banks, sophisticated individual investors, private equity funds and investment bankers) play a crucial certification and monitoring role. Given that venture capitalists finance only a few of the hundreds of financing demands they receive each year, and the stringent regulatory and legal requirements (MacInstoh, 1994; Riding, 1998), the equity gap proposition asserts that this financial growth path is very selective and costly for small and medium-sized enterprises. The equity gap proposition maintains that some profitable ventures are unrealized because they lack financing (MacIntosh, 1994). This equity gap problem has been put forth in the U.K. (SBS, 2003), the U.S.1 and Canada (OSC, 1996). Although controversial, the issue of an equity gap in Canada is generally accepted. For example, the Business Development Bank of Canada (2001, p.73) identifies four levels of equity gap: 1) early-stage gap, whereby investments in small, early-stage companies are not the strategic focus 1. The Small Business Investment Company (SBIC) program was created to fill the gap between the availability of venture capital and the needs of small businesses in start-up and growth situations.. 3.
(8) of most private investors; 2) dollar gap, whereby per capita venture capital investment will have to be increased (…); 3) institutional gap, whereby Canadian institutional investors are not playing an active role when compared with their American counterparts; and 4) smaller appetite for IPOs in Canada. To close this equity gap, Canadian policy makers have taken action to increase the offer of equity capital available for small and medium-sized companies. However, regulators have also attempted to use the stock market, specifically by reducing the listing requirements for small capitalization firms2 and introducing the Capital Pool Company (CPC) program. Essentially, the CPC program is a clone of the U.S. Blind Pools/Blank-Checks program. Launched in Canada in the late 1980s, it allows for the listing of tiny firms, whose total assets are lower than CAN$1 million. Indeed, according to Policy 2.4 of the TSX Venture Exchange3, the goal of the CPC program is to provide businesses with an opportunity to obtain financing earlier in their development than might be possible with an IPO. This program follows the introduction of the Blind Pools program in Alberta in 1986. Its regulation is slightly more constraining than Blind Pools: CPC promoters must specify the industry in which they plan to invest the funds, the maximum amounts and the price of CPC shares are regulated4, the CPC promoter’s shares must be held in escrow to limit the risk of abuse by promoters5 and the CPC program cannot be used when an agreement in principle6 is established between the promoters and the target private company. The lowering of listing requirements, the generalization of the CPC program and the promotion of backdoor listings by the stock markets themselves have resulted in an exceptional situation. According to Berger and Udell (1998, p.13): a combination of informational opacity and issue http://app1.sba.gov/faqs/faqindex.cfm?areaID=31 2 In 1992, the Toronto Stock Exchange increased its listing standards, yet the listing standards were reduced for the other Canadian exchanges, especially under the CPC program. The Toronto Stock Exchange lowered its standards for high technology firms in 2000 (Harris, 2004). 3 http://www.tsx.com/en/productsAndServices/listings/cdnx/resources/resourcePolicies.html. 4 In certain American states such as Colorado and Utah, shares originating from the Blind Pools program may be traded only over the counter (Dolan and Giffen, 1988, p.22). 5 The rules of escrow are intended to limit the possibilities of promoters’ very short-term gains and to ensure a better correspondence of their interest with those of subsequent investors.. 4.
(9) costs will determine the size of firm for which a public offering becomes economically attractive. On the equity side, the median firm asset size was $16.0 million for venture-backed IPOs, and $23.3 million for nonventure-backed IPOs in 1991-93 (Fenn, Liang and Prowse, 1997). A reasonable guess for the minimum asset size for entering this market would be about $10 million. In Canada, more than 50% of new listings during the 1995-2001 period were non-conventional IPOs, initially launched with gross proceeds of CAN$300,000 or less. In terms of small business finance, Canadian policies foster methods that are considered very problematic in the U.S. (Coffee and Seligman, 2003, p.524). The CPC program relies implicitly on the following postulates: 1) a significant number of companies require external financing; they can provide a fair rate of return to external investors, but are unable to be financed using conventional tools7, 2) small firms can grow and succeed without the full set of services usually provided by conventional funding providers and 3) individual investors are able to correctly price the stocks issued by small and generally young firms. These postulates are not specific to the CPC program. The first postulate, essentially the equity gap problem, is regularly cited to justify government intervention in the field of small business finance. The second postulate forms the basis of arguments in favor of easing listing requirements. The final postulate underlies fiscal programs such as the stock saving plans implemented in several Canadian provinces, whose objective is to encourage individuals to invest in initial public offerings of small companies. Thus, the analysis of the CPC program is a unique opportunity to verify these postulates, a question of great interest to policy makers, regulatory agencies and the private equity industry. From a theoretical standpoint, the success of financing methods such as the CPC program can question the relevance of phenomena of asymmetric information, agency costs, and contracting in the area of small business finance. To verify these postulates, we propose an in-depth analysis of the quality and performance of firms that use the CPC program to bypass the traditional financial growth cycle. The next section 6. An agreement in principle stipulates the main conditions on which the parties agree or plan to agree, and specifies the asset items or the company that must be acquired, the parties to the qualifying transaction, the consideration due for the significant assets or the calculation method of the consideration payable. 7 In the CPC program, the financing is provided entirely by individual investors. The government does not put money in the venture and the argument of a social rate of return may not be invoked to justify this program. This argument asserts that government grants or subsidies can be justified in some cases where a social rate of return may be added to an insufficient private rate of return (MacIntosh, 1994, p.143).. 5.
(10) describes the program. We then present our research hypotheses (Part 4), the data, the operational hypothesis and the methodology (Part 5). Part 6 contains the results of the tests regarding the quality, the operating performance and growth of companies listed on the stock market because of this program, and Part 7 presents the results regarding their stock market performance8. The final section contains concluding remarks. 3. The Capital Pool Company Program The first Junior Capital Pool program was launched in Alberta in November 1986 by the Alberta Securities Commission and the Alberta Stock Exchange. It was an adaptation of the American Blind Pools program. In 1997 the British Columbia Securities Commission and the Vancouver Stock Exchange adopted a similar program. The CPC program of the CDNX, which took effect on March 1, 2000, replaces the two previous programs following the merger of the Vancouver and Alberta Stock Exchanges in November 1999; it results from a collaboration between the Alberta, Saskatchewan, Manitoba9 and British Columbia securities commissions and the CDNX. In Ontario, the program has been in effect on the TSX Venture Exchange since June 15, 2002, and in Quebec since November 12, 2002. Figure 1 shows that the CPC program is a two-stage process. The first stage involves the completion of the IPO and the listing of the CPC on the exchange. The CPC is a listed corporation (a shell) with no assets or business plan, no operating history and no assets except cash, and is solely intended to find and acquire assets or companies as takeover targets. The second stage involves an agreement in principle relative to a transaction. Once the transaction, called a qualifying transaction (QT), is complete, the new entity must satisfy the exchange minimum listing requirements for the particular industry sector, and the resulting issuer (RI) may be listed for regular trading either in Tier 1 or Tier 210. According to TSX Policy 2.4, the RI is the issuer that was formerly a CPC, which exists upon issuance of the Final Exchange Bulletin.. 8. This study performs the first in-depth evaluation of the CPC program. The few existing studies of CPC (Dolan and Giffen, 1988; Hopkins and Robinson, 1994, Robinson, 1997, 1993) uniquely use summary indicators of success such as the number of CPCs created or the frequency of qualifying transactions, and cover the startup period of the program exclusively. 9 The Winnipeg Exchange joined the CDNX in November 2000. A similar program existed previously in Manitoba. http://www.osc.gov.on.ca/en/Regulation/Rulemaking/Policies/pol_41-601_20020412_np.pdf. 10 Since January 15, 2003, the CPC is not required to obtain shareholder approval of arm’s length QT.. 6.
(11) e an g Ini t fo tia r th lP eC ub PC lic Of pro Li s fer s pe ing tin ctu go s f th eC PC on the ex c han ge Ag r ee me nt in P ri nci Co ple mp reh ens Ma i ve ter ial n c h an e w s r Ag e ge r ee rep lease me o n rt to Me f th eti ee ng xch of s ha Li s a ng tin reh e go ol d f th ers er (if e su req ltin uir gi ed ) ssu er on t he exc h. ita l cap Fin a. l re. cei p. CP C. f se ed. the of. ing o. tio n Ra is. ora Inc orp. 18 months Source: Doyle (2002)11. The characteristics of the CPC12 are detailed in Appendix 1. The CPC has 18 months from the listing date to realize a QT. At its discretion, the exchange may extend this period to 24 months from the listing date. After that period, the exchange may suspend from trading or delist the shares of the CPC. A QT is defined as a transaction where a CPC acquires significant assets, other than cash, by way of purchase, amalgamation, merger or arrangement with another company or by other means (TSX Policy 2.4, 1.1). The financing of small firms, especially in the high technology industry, is characterized by strong asymmetric information. This situation induces moral hazard and adverse selection problems, which can be addressed by specialized intermediaries, such as venture organizations (Gompers and Lerner, 2000, p.130).. The ability to attenuate information problems and to. enhance ex post monitoring is not specific to venture capitalists, but seems common to the spectrum of private equity investors, according to Folta and Janney (2004). Cumming (2004) contends that venture capitalists are among the most sophisticated financial intermediaries that can mitigate agency problems. They take significant steps to avoid financing low quality firms (Kaplan and Stromberg, 2004) and have developed several tools for monitoring the firm 11. http://www.reseaucapital.com/Conferences/Rentree_02/Louis_Doyle_TSX.pdf. 7.
(12) (Gompers and Lerner, 2000). In the CPC pattern, the asymmetry of information between the promoters of the CPC, the investors and the owners of the target firm is extreme. The target firm is often unknown to the CPC shareholders at the inception of the pool13. This information is revealed only when the CPC shareholders have no choice but to accept the QT, due to the limited life of the pool. Shareholders of the CPC generally lack the specific ability to analyze a private investment in a small closed corporation. According to Fenn et al. (1996, p.1), few investors had the skills necessary to invest directly in this asset class, and those that did found it difficult to use their skills efficiently. The CPC shareholders cannot mitigate the asymmetric information problem by using optimal contracts or securities. There is no real process of screening, due diligence or certification14, and the shareholders delegate full responsibility to the promoters. Often these promoters do not act at arm’s length with the target entity. The program provides a direct access to public financing for companies that reveal little public information upfront, bypass the conventional funding providers, and are not actively monitored by their shareholders. The CPC program enables companies to get listed by revealing information about QT later than if they had used a traditional IPO. In such a context, the moral hazard phenomenon cannot be solved. Moral hazard theory suggests that a higher proportion of “bad” firms will use this program. The problem will be exacerbated if there is little evidence of a major market failure, as Brierley (2001) notes. In such a situation, the number of good projects that cannot be financed conventionally should be low and the CPC program should attract the worst such projects. Moreover, the screening capacity is minimal. The investors lack the ability, motivation and tools to select worthwhile projects exclusively. In addition, the conjunction of moral hazard, low screening capacity and lack of monitoring can only result in a very weak performance of the firms listed because of the program. These hypotheses are developed in the next section and tested in the following sections.. 12. We will use the acronym CPC for the various versions of the program. However, the promoters of the CPC are often the main shareholders of the operating entity. If a CPC intends to enter a specific proposed QT that is not yet an Agreement in Principle, but is at the stage where disclosure is required under applicable securities laws, disclosure must be included in the CPC prospectus (Policy 2.4 at November 23, 2000, 4.3). 14 However, when the qualifying transaction follows a reverse merger, a sponsor is retained to conduct due diligence on the private company. 13. 8.
(13) 4. Research Hypotheses 4.1 The adverse selection hypothesis A young Canadian firm’s search for outside equity can be considered a twofold process. First, it can opt for public or private funding. If it selects public funding, it then can choose either the conventional IPO15 process or the CPC path. Firms with high asymmetric information are expected to be more likely to choose private placements than public offerings (Chemmanur and Fulghieri, 1999). Following Hertzel and Smith (1993), Janney and Folta (2002) argue that a firm’s choice to forgo public equity in favor of the private equity market signals to the marketplace that the managers believe that their firm is undervalued. According to this approach, the private equity market is likely to attract firms with high potential. Several attributes of private equity placements create an excellent mechanism for high-quality firms to signal their differentiated value. For example, private investors are required to be ‘‘knowledgeable’’ by the securities exchange commissions, and generally conduct rigorous due diligence process before committing their funds—a level of rigor that is much higher than with seasoned public offerings (Varma and Szewczyk, 1993). Coupled with this information gathering process is a requirement that investors keep their capital committed to the firm for a period of up to two years. Since this time period is long enough to reveal useful information about a firm, only high-quality firms are believed to be able to attract private investors (p. 5). According to Cumming and MacIntosh (2003, p.171): Empirically, VC involvement with an entrepreneurial firm has been demonstrated to be a signal of firm quality to the public market in relation to IPOs. Venture-backed firms experiencing an IPO are subject to less underpricing than their non-venture-backed counterparts. In addition, venture-backed firms perform better postIPO than other IPO firms.. 15. The minimum requirements for listing in the TSX-Venture are quite low compared with NASDAQ requirements. Technology or industrial issuers in tier 2 of the TSX must exceed CAN$500,000 for net tangible assets, and CAN$50,000 in pre-tax earnings in the last two or three years. For R&D issuers, net tangible assets should exceed CAN$750,000, and there are no earnings requirements. New listings can be a financing choice for start-up firms and, from 1991 to 2000, 623 of the 1,023 conventional Canadian IPOs (excluding CPC) levied less than CAN$5 million. See Harris (2004) for an analysis of the lowering of listing requirements by the TSX.. 9.
(14) According to these principles, firms opting to obtain public equity early should be of lower quality. Some of those firms have no choice, because the risk return trade-off of the venture does not fit the private equity providers’ criteria. They can also choose a public issue to evade the stringent monitoring process imposed by active investors. Consequently, firms choosing public equity are probably, on average, low quality firms. Yet one cannot rule out the hypothesis that some good firms exclude private equity and opt for the IPO due to the excessive requirements of venture capitalists, or because of an equity gap. The IPO implies the production of a prospectus and the release of information, but does not imply systematic monitoring by active shareholders. However, institutional investors usually buy a large proportion of a conventional IPO and can become active blockholders. In terms of information and control, the CPC mechanism shares the characteristics of both IPO and private placements. Similar to an IPO, firms using the CPC program can sell shares to the public, albeit in a context of reduced disclosure and control. Shares are sold via the pool, without any information relative to the target firm. Under the CPC program, small firms can skip the due diligence and prospectus steps. Most of the qualifying transactions are concluded by the reverse merger method, and the required information is a comprehensive news release, included in the proxy circular. This information is disclosed when the CPC filing is completed, and when the shell investors have no choice but to accept the transaction or to delist the CPC. The resulting stakeholder is composed of a mix of individual investors who bought shares on the CPC and the stockholders of the operating entity. The bottom line is that CPC allows for equity financing without the release of comprehensive information upfront, as required in the IPO process, and without the screening, due diligence and monitoring characteristics of the private equity financing process. The adverse selection concept posits that this financing tool will attract lower quality public issues. On average, we can expect that CPC will be of inferior quality. These companies are either 1) companies with poor performance that could not attract private equity or 2) companies that could provide a fair return if financed by private equity, but whose managers follow their own objectives such as maximizing their personal wealth over a short horizon. Thus our first hypothesis is as follows: private companies that use the CPC-backdoor listing scheme are on. 10.
(15) average of lower quality than private companies that use a more traditional financing path. We empirically test the following proposition related to this hypothesis: Proposition 1: Quality, as measured by the operating performance at the time of the QT, of private companies which use the CPC program is abnormally poor. 4.2 The weak performance hypothesis The operational performance of RI should be weak, for three reasons. The first is the poor quality of firms that use this program, as explained in our first hypothesis. The second reason is the lack of correctly designed incentive contracts, that can align the interests of managers and shareholders. The third is the absence of essential services provided by venture capitalists or angels. Firms using the CPC program issue common equity. It is well established that this type of security will attract firms with low expected returns. This reinforces the adverse selection problem we described in the previous section. Moreover, to mitigate this problem of adverse selection and to better align the interests of managers and shareholders, U.S. venture capitalists rarely use forms of finance other than convertible common equity, while various mixes of incentive contracts are used in Europe and Canada (Cumming, 2004). Indeed, the CPC program lacks a crucial tool to solve the agency problem which is acute in small business finance. The level of monitoring firms require is another potential determinant of the choice of an equityselling mechanism. Several authors assert that venture capitalists play an active interventionist role in monitoring management and in firm decision-making. Dotzler (2001) uses evidence from surveys of founders and CEOs to describe the most valuable functions of venture capitalists, namely providing advice and introductions for financing, together with help in establishing and reviewing the company’s strategic focus. Overall, venture capitalists’ actions translate into a significant increase in companies’ survival rate (Birmingham et al., 2002). For example, according to the European Private Equity & Venture Capital Association16, the responses of the venture-backed companies prove that venture capital investment is crucial to the existence, 16. Survey of the Economic and Social “Impact of Venture Capital in Europe”, 2002, http://www.evca.com/images/attachments/tmpl_9_art_37_att_333.pdf. 11.
(16) feasibility and success in the seed/start-up and expansion stages. Moreover, for some authors, venture capitalists play a crucial role in the timing, pricing and monitoring of initial public offering shares of growth companies (Lerner, 1994; Brav and Gompers, 1997). As stated by Keuschnigg and Nielsen (2001, p.559): Notwithstanding the critical contribution of entrepreneurs, commercial success of a start-up company is typically enhanced by the activity of VCs who not only provide equity finance but also support the enterprise with valuable business advice and industry experience17. The poor performance of RI is probably the combined result of the adverse selection problem and the lack of monitoring and incentive tools. Available data is insufficient to disentangle these effects. In this paper, we empirically test the following proposition: Proposition 2: Operating performance of the resulting issuers is abnormally poor. 4.3 The weak stock market performance hypothesis According to the rational expectation hypothesis, the poor performance of CPC financed firms should be anticipated. The equilibrium price observed at the qualifying transaction should be low enough to ensure the investors a fair rate of return. However, the CPC program is characterized by strong asymmetric information. The QT implies two categories of shareholders. The informed shareholders own stocks of the operating entity or are the promoters of the CPC. Often, they play both roles. These informed shareholders share a common interest: setting the highest possible prices. In contrast, uninformed investors own minority positions in the CPC. They may also be the buyers of new issues realized at the time of the QT. They are generally individual investors. According to Fenn et al. (1996) they lack the skill to correctly appreciate the value of a private venture. In such a context, we can expect an abnormally high qualifying transaction price, which is likely to generate a maximal return for the informed investors. If this hypothesis is true, we should observe abnormally low market returns following the QT. We empirically test the following proposition:. 17. The “value-added proposition” is, however, mitigated by the results of several studies. Sapienza (1992) shows that the value of venture capitalists’ involvement varies greatly among ventures. Brau et al. (2004) indicates that venture capitalists’ involvement seems unrelated to the success of manufacturing firms’ going public in the U.K. More recently, Busenitz et al. (2004) find no support for the hypothesis that venture capital information adds value to their portfolio venture. Empirical support for the venture capital value added proposition is thus mixed.. 12.
(17) Proposition 3: Stock market performance of the resulting issuers is abnormally poor.. 5. Data, operational hypothesis and methodology The focus of our study is the RI. Because there are no lists and data relative to RI, we have compiled a unique database for this study. 5.1 Data Due to the lack of data for the period before the implementation of SEDAR (the Canadian equivalent of EDGAR) in 1997, we restricted the analysis period to QTs registered after January 1995, and we provide only stylized facts for the complete 1990-2001 period, to assess the impact of the program. CPC issues were gleaned from lists published by the Financial Post. Issues prior to 1995 were supplied by Michael Robinson of the University of Calgary. QTs were identified for each CPC using the TSX site, along with SEDAR, the Survey of Predecessor and Defunct Companies published by the Financial Post (Survey), and Lexis-Nexis. The Financial Post lists of new issues were used when the CPC issued shares and companies funded by a private placement, and in some cases the financial statements of companies were analyzed to trace QT data. RI stock performance was calculated using total return indices from the Datastream database of Thomson Financial, beginning from the date of the QT. The tickers required for extraction of returns originate from the CanCorp Financials database in the case of still active companies and from SEDAR for the remainder. Firms that do not appear in either of these sources were researched in the Survey. Companies not listed in Datastream were researched on lists of companies traded on the over-the-counter market18. Accounting data originated from the CanCorp Financials database. 5.2 The CPC program: stylized facts Table 1 shows the development of this program during the 1990s: 975 issues result from capital pools, as opposed to 1,063 traditional issues. 81% of the CPC issues originate from Alberta or British Columbia. The CPC program was responsible for more than half of the IPOs in Canada. 18. www.otcbb.com and www.otcjournal.com. 13.
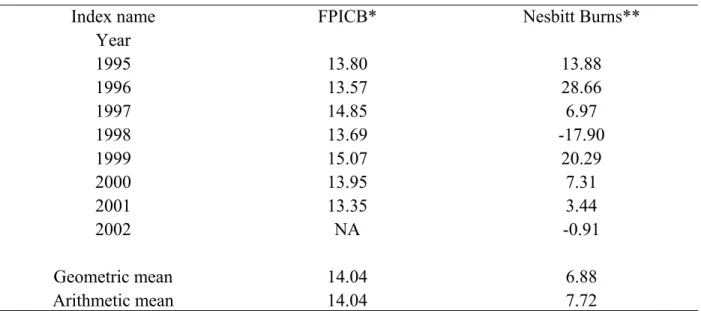
(18) between 1995 and 2001 (789 versus 690). The annual number of CPC (113) is proportionally similar to the number of firms financed by venture capital in the U.S. (1,200 to 1,500).19 Of 682 CPC issues noted between 1995 and 2000, 521 had completed a QT on December 31, 2001 (Table 2). The proportion of CPCs that conclude their transaction is sharply reduced from 90% before 1998 to 45% in 2000 and 2001, probably owing to unfavorable market conditions. Table 2 also reports the main data relative to the 475 available QT. The reported amount consists of the gross proceeds in the case of a secondary issue or private placement and the increase in capitalization in case of mergers or reverse mergers. In most cases, the increase in capitalization results only from the appreciation of the shares exchanged. The total amount raised during 475 QTs completed by December 31, 2001 stood at CAN$1.29 billion, corresponding to an average amount per QT of CAN$2.71 million. The sample contains 88 RIs with zero sales during the first fiscal year following the QT, including 51 resources companies. 69 RIs had zero sales at the end of the observation period, and 56 had zero sales at the beginning and end of the period. Given that the CPC program partly serves exploration companies and technological companies without revenues, the analysis of profitability should take this characteristic of the sample into account. 5.3 Benchmarks In the context of the CPC program, the analysis of performance is complicated considerably by the absence of benchmarks. To evaluate the quality of the private firm prior to the qualifying transaction, along with the operating performance of the RI, we used the industrial return on equity calculated in the Financial Performance Indicators for Canadian Business (FPICB) published by Statistics Canada. FPICB provides median annual return on equity ratios for each industry for small and medium-sized firms with annual revenue between CAN$5 million to CAN$25 million. Table 3 shows the arithmetic mean return for each year. To assess stock market performance, we used the Nesbitt Burns small capitalization index, whose geometric mean return is 6.9% for the study period (Table 3). 5.4 Operational hypothesis[s2] Quality of the private firm prior to the qualifying transaction. 19. Fenn and Liang (1998). Canada is generally considered to equal 10 percent of the US securities market.. 14.
(19) The quality of the private firm before the QT is evaluated in relation to the FPICB annual rates of return. For each firm, we calculate the excess ROE, which is the difference between the observed ROE using the last annual financial statement prior to the QT and the ROE of the corresponding industry, the corresponding year and for similar sized firms. For each company i, and for the year tp prior to the QT, we then calculate an excess return on equity, ROEXi,tp, expressed as: ROEXi,tp = ROEi,tp – IROEi,tp Where ROEi ,tp = NI i ,tp / SEbeg i ,tp. NIi,tp is the net income before extraordinary items of company i for year tp SEbegi, tp is the shareholders’ equity from the start of year tp IROEi,tp is the ROE of the industry of the firm i of the year tp . The excess accounting rates of return are used to test the following hypothesis related to quality of private companies prior to the qualifying transaction (proposition 1): H1: The accounting rate of return of private companies using the CPC backdoor listing scheme is equal to or greater than that of similar companies. Operating performance of the resulting issuers Operating performance of RIs is evaluated in relation to the rate of return of the FPICB annual rate of return. For each firm and each year we calculate an excess ROE, i.e. the difference between the observed ROE and the ROE of the corresponding industry, the corresponding year and for similar sized firms. For each year t and each company i, we then calculate an excess return on equity, ROEXi,t, expressed as: ROEXi,t = ROEi,t – IROEi,t Where ROEi ,t = NI i ,t / SEbeg i ,t NIi,t is the net income before extraordinary items of company i for year t SEbegi, t is the shareholders’ equity from the start of year t IROEi,t is the ROE of the industry of the firm i of the year t . We also define the average excess return on equity, ROEXi, for each company i, as:. 15.
(20) n. ROEX i =. ∑ ROEX. i ,t. t =1. n. Where n is the number of years between the QT and the end of the study period The excess accounting rates of return are used to test proposition 2 related to the operating performance of the resulting issuers: H2: The accounting rate of return of RIs is equal to or greater than that of similar companies. We calculated the distribution of the excess annual rates of return and performed a statistical test. Proposition 2 was also tested using the average rate of return of each company, calculated between the QT and the end of the study period (ROEXi). To describe distributions of average rates of return (Table 5), we used the average return on equity (AvROEi) obtained by dividing the sum of the earnings by the sum of the equity at the start of the period. This calculation method limits extreme data. Stock market performance of the resulting issuers The hypothesis related to stock market performance is tested using average excess returns, calculated after 36 or 48 months as well as between the QT and December 31, 2002. Excess returns are calculated by subtracting the returns of the small cap stock index from the monthly returns of each of the RIs. Stocks are considered independent, and we have not attempted to use complex measures to calculate long-term returns of new issues, for two main reasons. First, there are no comparable companies for pairing purposes, and second, the excess returns are such that obtaining more precise results is not useful for our analysis. The tests of proposition 3 are thus related to the distribution of cumulative excess returns: H3: Stock market performance of RIs is equal to or greater than that of the Nesbitt Burns Small Capitalization Index.. 16.
(21) 6. Quality, operating performance and growth. 6.1 Quality of private companies prior to the qualifying transaction and test of hypothesis H1 The population comprises 521 RIs. To characterize the private firms prior to the qualifying transaction, we investigate the comprehensive news released in the proxy circular, available on the Sedar database from 1997 (Table 4). We exclude 30 cases of asset acquisition and we add 27 cases of additional private firms acquired by 21 CPCs whose QTs involve more than one private firm. We obtain information regarding accounting data and ownership structure for 199 private companies prior to the qualifying transaction. We note that a venture capitalist is a shareholder of the company in only 16 cases out of 199. Table 5 shows that on average, these companies have two directors or officers owning more than 10% of shares, and that their mean total shareholding percentages is 65%. These private companies are small, with mean (median) revenues of CAN$1.28 million (CAN$0.4 million), and are not profitable, since their mean (median) net income before extraordinary items is -CAN$124,470 (-CAN$13,800). Table 6 shows that these companies perform worse than their peers. Their mean excess returns on equity is -23.66% and significantly different from 0. P value allows us to reject Hypothesis H1 in favor of the following alternative: the operating performance of private companies using the CPC-backdoor listing scheme is abnormally poor, as stated in our first proposition. On this basis, the companies using the CPC program to procure public financing seem to be of lower quality than firms of the same industry and size that use the traditional financing steps. 6.2 Operating performance of the resulting issuers: sample and estimates The population comprises 521 RIs. Several were eliminated because of their quick disappearance or lack of accounting data (Table 7). We collected the sales (revenues), net income before extraordinary items and shareholders’ equity at the end of each fiscal year following the date of the QT, and up to the 2001 fiscal year. The monitoring stopped before this date if the RI is delisted, acquired or if it became the target of a merger or an RTO, because in the latter two cases a new company is created. The assets are considered zero in the case of companies whose shares have been suspended or delisted. Equity on the acquisition date is used in the case where the. 17.
(22) company was purchased. The analysis ensues from 367 observations. This sample presents a survival bias, which must be taken into consideration during the analysis of results. 52 inactive or bankrupt issuers were not monitored, and 30 companies were transferred to the over-the-counter market or were reprivatized. The latter cases can also be combined with the failures, given that the primary objective of the program is to provide companies with access to the stock market. The growth, rates of returns and average margins for each company were calculated on various horizons, because some QTs were completed in 1995 and others in 2000. We did not have sufficient historical information to measure performance over a 3- or 4-year horizon for all RIs. We therefore report the average results in the text and present the detailed results in Appendix 2. Overall, the RIs are highly heterogeneous and the calculation of overall indicators is largely insignificant. Therefore, to facilitate the analysis, we differentiate 2 categories. The first includes companies that did not experience significant growth and whose equity is below the limit of CAN$5 million during the analysis period. We consider that a company whose equity reaches CAN$5 million can foresee entry on the TSX over the medium term, because the minimum standard for companies to attain profitability is CAN$7.5 million in net equity. The second category includes companies that experienced rapid growth following the QT and that exceeded the limit of $5 million in equity between the QT and the date of the end of the observation period. For each of the years and for each category, the average amounts of sales, net income before extraordinary items and shareholders’ equity are presented in Tables A1 to A6 in Appendix 2. Table 8 presents the average annual rates of return on equity and average margins for all observations followed by those of firms with non-zero sales for the fiscal year following the QT. Table 9 presents the results of the test of hypothesis H2. 6.3 Resulting issuers without growth RIs in this category do not present significant internal growth or an acquisition strategy; they represent 73.8% of observations for which monitoring was possible (271/367). The 82 cases for which data is not accessible, owing to suspension, delisting or reprivatization, are also included in this group. On average, for the entire period, companies in this category posted a loss equal to –53.30% of their sales (Table 8). Elimination of companies with zero sales brings this value to –39.68%. The low profitability is therefore not attributable to these companies, even if their. 18.
(23) margin is most often equal to -100%.20 The medians do not differ strongly from the means, which indicate that the results are not conditioned by a subset of issues. The net income of RI with low growth is negative for each of the years of the study period. The growth of sales is weak or negative. For example, the 57 RI of QT carried out in 1997 have average sales of CAN$1.78 million during the first fiscal year, compared with CAN$1.80 million 5 years later, but 13 issuers have disappeared, most often owing to financial difficulties (Appendix 2, Panel A of Table A3). The QTs of following years are completed by companies with superior growth but higher disappearance rates, which biases the estimates. The very low profitability of sales explains the level of ROE, which is on average –34.72% (Table 8). These losses are offset by contributions of capital, which allow relative stability of equity. For the 1996 cohort, the equity ranges from CAN$1.1 million in the first fiscal year to CAN$1.6 million in the sixth, but decreases from CAN$1.03 million to CAN$0.87 million for the 1997 cohort (Panel A of Table A2 and A3). The 1998 cohort also demonstrates a decrease in equity over the 4 years studied (Panel A, Table A4). The profitability of these issuers is therefore extremely low, despite the double bias created by difficulty in accessing data. On average, shareholder equity of RIs without growth is approximately CAN$1 million at the end of the 2001 fiscal year, except for RIs of CPC that completed their QTs in 1996. Average net income is consistently negative. 6.4 Resulting issuers with growth. 96 RI exceeded the limit of CAN$5 million in shareholders’ equity before December 31, 2001 (Panel B of tables A1 to A6 in Appendix 2). At the end of the study period, shareholders’ equity of companies in this category ranges from CAN$10 to CAN$18 million, except for the 1996 issues, where one company (Dundee Realty Corp) reached equity of CAN$462 million, which pushes the average equity of companies in the group to CAN$48 million. At the end of the study period, average sales range from CAN$12 million to CAN$30 million, depending on the cohort, with the exception here again of 1996. Overall, these companies are not profitable. The average margin for all years is –26.28%, with a median of –4.55% (Table 8). When companies without revenues are excluded, the average ROE is –6.62%, compared with an annual ROE of –7.62% for 20. The relatively limited effect of companies without revenues may be traced back to the use of value weighted ratios. These ratios are obtained by dividing the sum of the income by the sum of the proceeds. The effect of very small companies with zero revenues and very low income is therefore limited. In addition, we have calculated a margin and a ROE weighted by shareholders’ equity. The values (not reported) are slightly less negative but are comparable. The reported results cannot be traced to a relative underperformance of small issuers.. 19.
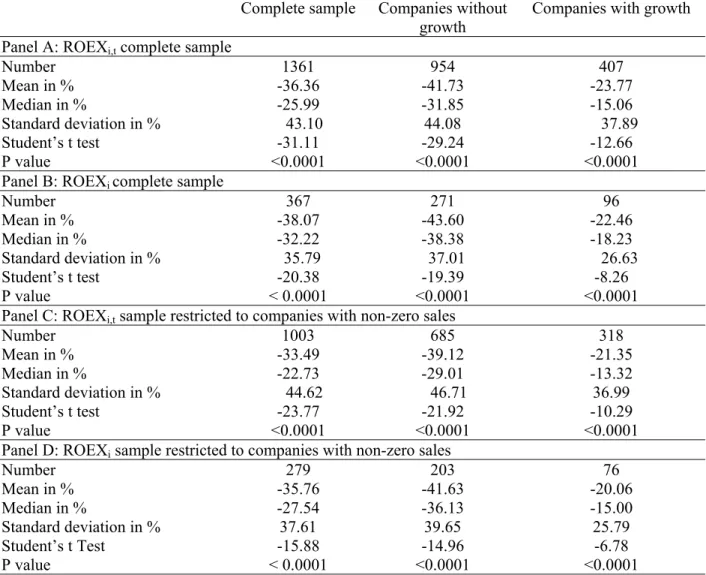
(24) all observations analyzed. This average result does not exclude a few successes that may have enabled the issuers to be listed on the TSX.21 However, as profitability is negative for more than half of the 96 companies in this category, their relatively strong growth can be explained solely by a series of market transactions, which generally involved exchanges of shares. 6.5 Test of Hypothesis H2 Table 9 reports the excess accounting returns of RIs compared with the FPICB industrial returns, along with statistical tests. On average, the pooled abnormal return is -36.36% for the complete sample (Panel A). The abnormal rate of return is -41.73% for the companies without growth and 23.77% for the companies with growth. If we calculate the cumulative abnormal returns company by company, the rate is -38.07% and is significantly different from 0. P values allow us to reject Hypothesis 2 in favor of the following alternative hypothesis: the operating performance of RIs is significantly inferior to that of similar firms. Panels C and D of Table 6 illustrate that the conclusions remain valid for companies whose sales are non-zero during the first fiscal year following the QT. The very negative operating results of RIs are therefore not attributable to resource companies or technological firms without revenues. 7. Stock market performance. Measurement of long-term performance of IPO22 poses methodological problems, notably in the case of very small issues23. We therefore use a simple indicator based on the performance of issues adjusted for variations of a benchmark index composed of small capitalization stocks. This section of the study concerns only the RIs whose stocks are traded between the date of the QT and the end of 2002. The disappearance of numerous stocks generated an inevitable survival bias, the scope of which we have attempted to limit by taking into account, whenever possible, acquisitions or delistings.. 21. These companies are analyzed in Note 27. Although the issues that take place during QTs are categorized by the Financial Post as subsequent issues, they are in fact the initial issues of operating companies acquired or integrated during these transactions, and we consider them as such. 23 See Kooli and Suret (2004) for an analysis of these problems and for a presentation of the methods used in empirical studies. Pairing with medium-sized companies that did not undertake issues is frequently employed, but is inapplicable here owing to the very small size of the companies. 22. 20.
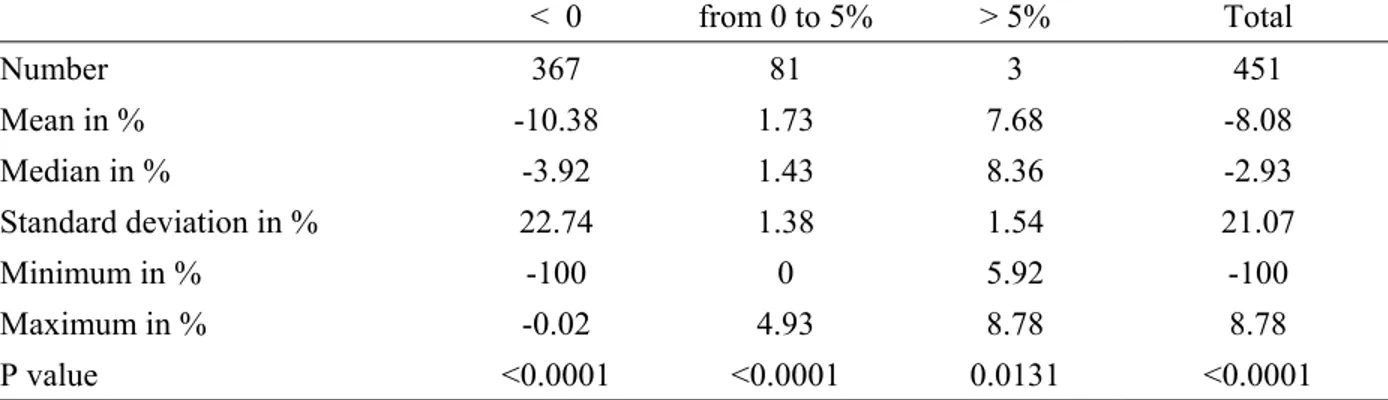
(25) 7.1 Sample and data Of the 521 companies that completed a QT before December 31, 200124, we were unable to trace the date of the QT for 37, and returns were not available for 33 other companies. The final sample therefore comprises 451 observations. The missing data is attributable to two factors. A large proportion of RIs disappear quickly and leave no trace in the various databases, including those dedicated to inactive stocks. Other companies underwent a series of market transactions that render the monitoring of their performance impossible, particularly if the company was ultimately delisted. In general, RIs for which returns are not available disappear quickly, remain very small in size, are acquired several times or are privatized. Their stock is rarely traded and their lifespan is short. These stocks are “forgotten.” However, stocks that were traded for a relatively long period and at a sufficient volume before being delisted or acquired are included in the databases. The omission of “forgotten” CPCs created a bias in favor of RIs because we omit stocks whose performance is largely mediocre. Of the 451 issues for which returns are accessible, 59 were delisted before December 31, 2002: 22 disappeared following financial difficulties, 10 are traded only over the counter, and 27 are acquired or merged; the purchase price was available in only 13 cases. To avoid exacerbating the survival bias, we applied the following rules in the case of mergers or acquisitions: when the acquisition price is available, the final return is calculated between the last closing price before the merger or acquisition price. The returns following the acquisition are those of the index, and the subsequent abnormal returns are zero. The returns are thus calculated between the date of the QT and the date of the merger. The abnormal returns following the delisting date are also zero in the case of financial difficulties or the transition to over the counter, in both cases the return for the month of delisting is -100%, and the return is calculated between the date of the QT and the delisting date. 7.2 Performance following the qualifying transaction Returns after the QT are inferior to that of the benchmark index in over 80% of the cases (Panel A, Table 10). On average, the excess average monthly return is –8.08%, which corresponds to an annual geometric mean rate of –63.62%. After three years, the excess cumulative returns of a portfolio equally weighted with the shares of all RIs is –85.04% (Panel B, Table 10). After four 24. The analysis of performance of resulting issuers was restricted to QT prior to December 31, 2001, to obtain at least 12 monthly returns.. 21.
(26) years, these returns reach -98.12% (Panel C, Table 10). This result is also valid for the subset of RIs that transfer from the TSX Venture to the TSX.25 The calculation of P values allows us to reject hypothesis H3. The stock market performance rate of RI is statistically inferior to that of the benchmark index. The mediocre stock market profitability of stocks issued during QTs should be placed in a broader perspective of medium-term performance of initial issues, and is not specific to this program. Jenkinson and Ljungqvist (2001, Table 2.2) recapitulate the studies conducted around the world, and found a generalized underperformance of -30% during the 5 years following the issue. In Canada, Kooli and Suret (2004) estimate underperformance at approximately -25% for 5 years, on a set of 450 conventional issues. Nonetheless, when the sample is limited to issues of relatively large size followed by listing on the TSX, this underperformance disappears (L’Her et al., 2003). To ascertain that the underperformance we observe is not the classical underperformance of new issues, we also constructed a Canadian IPO Index, using the monthly return of the initial public offering of common shares for 1995-200226. This index is an equally weighted average of time-weighted monthly rate of return, in order to avoid overweighting the large issues. The results (not reported) using this Canadian IPO index were similar to that of the Canadian small capitalization stocks. This indicates that the aftermarket performance of RIs is significantly lower than the aftermarket performance of new issues27. Underperformance of RIs of CPC is therefore an extreme situation: whereas the performance of conventional issues is inferior to that of the index by roughly 25% to 30% during a 3- to 5-year period, stocks issued by RIs underperform by 85% to 98% during a 3- to 4-year period. 25. The TSX Venture Exchange provided us with a list of 107 codes of stocks resulting from a CPC program that were listed on the TSX between 1995 and 2000. These codes correspond to 84 companies. The returns of 62 stocks were available on Datastream. The 22 remaining stocks are distributed as follows: 12 companies acquired or privatized too quickly for the database to keep track, 2 in financial difficulty, 4 companies suspended, and returns of 4 stocks were not accessible for unknown reasons. The average return, calculated at December 31, 2002, of 52 stocks transferred before December 31, 2001 (to yield at least 12 monthly returns), after adjustment for fluctuations of the small capitalization stock index, is –10.11% annually. This calculation takes into account the 12 stocks acquired during the period whose returns are accessible. Firm movement from the TSX Venture Exchange to the TSX therefore cannot be considered an indicator of the success of the program. 26 We excluded issues of fixed-income securities, along with issues by mutual funds, trusts and limited partnerships, issues under the Capital Pool Companies program, demutualizations, privatizations, and issues of share units, preferred shares and flow-through shares. 27 We also use as benchmarks the All Private Equity Funds index and the Venture Capital Funds index of Thomson Financial Venture Economics, which use data regarding US firms and a capitalization weighted average of timeweighted returns using periodic IRRs. The results generated by these indices are less favourable to RIs and therefore are not reported.. 22.
(27) 8. Conclusions and discussions. Our study objective was to determine whether the three postulates underlying the CPC program, regularly evoked to justify government intervention in small business finance, are grounded in myth or reality. We also evaluated the results of an innovative program proposed by regulators and stock exchanges to promote new listings of very small companies. The equity gap postulate, generally well accepted in Canada, asserts that a significant number of companies require external financing, and can provide a fair rate of return to external investors, but are unable to obtain financing via conventional tools. Our study shows that the CPC program allows companies that are mostly nonviable to enter the stock market. These companies do not possess the necessary elements to develop using public financial resources that, in principle, justify listing on the stock market. On average, the program largely attracts low quality firms. This program thus fails to confirm the equity gap postulate, but clearly demonstrates that adverse selection and asymmetric problems are exacerbated in such a context. The second postulate asserts that small firms can grow and succeed without the full set of services usually provided by conventional funding providers. We show that, on average, the vast majority of companies issuing from the CPC program exhibited poor operating performance in the years following the listing. This observation is consistent with the concept that well designed contracts, incentive mechanisms and strong monitoring are instrumental to the growth of small business. However, this poor performance may also be linked to the adverse selection problem evidenced above. Underperformance can thus be viewed as a confirmation of the crucial role of conventional funding providers in screening and monitoring ventures. The third postulate presumes that individual investors are able to correctly price the stocks issued by small and generally young firms. We find that the stock returns adjusted for variations in the index are strongly negative. The resulting systematic mispricing of the issue confirms Fenn et al.’s (1996) finding that few investors have the requisite skill to directly invest in a venture. The mispricing is also compatible with a substantial information asymmetry problem, inherent in the CPC pattern. The program’s design is clearly insufficient to provide unsophisticated investors with the information required to correctly price a stock at the time of the qualifying transaction.. 23.
(28) Moreover, our results also show that in terms of public policy, development of mechanisms intended to facilitate the entry of emerging companies on the stock market requires serious reexamination. The Canadian experience indicates that entry on the market at a precocious stage of development is generally not a valid option for growth financing. Bypassing the financial growth cycle by the direct listing of new venture is definitively not advisable. The results should be analyzed prudently for two reasons. First, the study concerns the program as it existed in the years 1995 to 2000. Major changes were made in 2002, notably regarding the maximum amount that could be raised by capital pool companies. It is therefore possible that the performance of this program has changed, in that resulting issuers may be larger. Second, one can contend that the analysis period of performance is relatively short given the nature of the investments under study. It is therefore possible that the performance of resulting issuers improves over time. However, given their operating performance, most issuers will probably disappear within the next few years.. 24.
(29) Bibliography. Berger, A.N. and G.F. Udell, 1998, The Economics of Small Business Finance: the Roles of Private Equity and Debt Markets in Financial Growth Cycle, Journal of Banking and Finance, 22(6-8):613-673. Birmingham, C., Busenitz, L. and J. Arthurs, 2002, The Staging of Venture Capital Investments and Reinvestment Decisions, http://www.babson.edu/entrep/fer/Babson2002/XIII/XIII_P1/XIII_P1.htm Brau, J. C., Brown, R. A. and J. S. Osteryoung, 2004, Do Venture Capitalists Add Value to Small Manufacturing Firms? An Empirical Analysis of Venture and Nonventure Capital-backed Initial Public Offerings, Journal of Small Business Management, 42(1):78-92. Brav, A. and P.A. Gompers, 1997, Myth or Reality? The Long-run Performance of Initial Public Offerings: Evidence from Venture and Nonventure Capital Backed Companies, Journal of Finance, 52:1791-1821. Brierley, P., 2001, The Financing of Technology-based Small Firms: a Review of the Literature, Bank of England Quarterly Bulletin, Spring, 20 pages. Business Development Bank of Canada, 2001, Supporting Small Business Innovation: Review of the Business Development Bank of Canada, Special Report prepared for Industry Canada, 125 pages. http://www.ic.gc.ca/specialreports Busenitz, L.W., J.O. Fiet, and D.D. Moesel, 2004, Reconsidering the Venture Capitalists' "Value Added" Proposition: An Interorganizational Learning Perspective, Journal of Business Venturing, 19(6):787-807. Chemmanur, T.J., and P. Fulghieri, 1999, A theory of the going-public decision, Review of Financial Studies, 12:249-279. Coffee, J.C. and J. Seligman, 2003, Securities Regulation, Foundation Press Ed., Ninth edition, New York, New York, 1647 p. Cumming, D., 2004, Capital Structure in Venture Finance, Journal of Corporate Finance, forthcoming. Cumming, D. and J.G. MacIntosh, 2003, Venture Capital Exits in Canada and the United States, University of Toronto Law Journal, 53:101-200. Dolan, A. and B. Giffen, 1988, The Alberta Junior Capital Pool: Assessing Effectiveness as a Seed Capital Instrument, Small Business Research and Policy, 6(1):19-28. Dotzler, F., 2001, What Do Venture Capitalists Really Do, and Where Do They Learn to Do It?, The Journal of Private Equity, Winter:6-12. Fenn, G.W. and N. Liang, 1998, New Resources and New Ideas: Private equity for small businesses, Journal of Banking & Finance, 22:1077-1084. Fenn, G.W., Liang, N. and S. Prowse, 1997, The Private Equity Market: An Overview, Financial Markets, Institutions, and Instruments, 6(4):1-106. Fenn, G.W., Liang, N. and S. Prowse, 1996, The Economics of Private Equity Market, Federal Reserve Bulletin, Board of Governors of the Federal Reserve System, Washington D.C., January. 25.
(30) Folta, T.B. and J.J. Janney, 2004, Strategic Benefits to Firms Issuing Private Equity Placements, Strategic Management Journal, 25(3): 223-242. Gompers, P.A. and J. Lerner, 2001, The Venture Capital Revolution, Journal of Economic Perspectives, 15(2): 145-168. Gompers, P.A. and J. Lerner, 2000, The Venture Capital Cycle, the MIT Press Ed., Cambridge, Massachusetts. Harris, D., 2004, The TSX Technology Company Listing Standards as a Response to the “Hot Issue” Market of 1995-2000, Working Paper, http://www.uwi.tt/financeconference/day2.htm Hertzel, M., and R. Smith, 1993, Market discounts and shareholder gains for placing equity privately, Journal of Finance, 48:459–485. Hopkins, D. and M. J. Robinson, 1994, Using Alberta’s Junior Capital Pool Program to Raise Start-Up Equity Capital, Working Paper, Faculty of Management, University of Calgary, August. Janney, J.J. and T.B. Folta, 2003, Signaling through private equity placements and its impact on the valuation of biotechnology firms, Journal of Business Venturing, 18(3):361-380. Jenkinson, T. and A. Ljungqvist, 2001, Going Public: The Theories And Evidence On How Companies Raise Equity Finance, 2nd Edition, Oxford University Press. Kaplan, S.N. and P. Stromberg, 2004, Characteristics, Contracts and Actions: Evidence from Venture Capitalists Analyses, Journal of Finance, forthcoming. Keuschnigg, C. and S.B. Nielsen, 2001, Public Policy for Venture Capital, International Tax and Public Finance, 8:557-572. Kooli, M. and J.-M. Suret, 2004, The Aftermarket Performance of Initial Public Offerings in Canada, Journal of Multinational Financial Management, 14(1):47-66. L’Her, J.F., Kooli, M., and J.-M. Suret, 2003, Do IPOs Underperform in the Long-Run? New Evidence from the Canadian Stock Market, CIRANO Working Paper, http://www.cirano.qc.ca/pdf/publication/2003s-16.pdf Lerner, J., 1994, Venture Capitalists and the Decision to go Public, Journal of Financial Economics, 35:293-316. Ljungqvist, A. and M. Richardson, 2003, The Cash Flow, Return and Risk Characteristics of Private Equity, NBER Working Paper, 9454. MacIntosh, J.G., 1994, Legal and Institutional Barriers to Financing Innovative Enterprise in Canada, Discussion Paper Series, 94-10, School of Policy Studies, Queen’s University. Ontario Securities Commission (OSC), 1996, Task Force on Small Business Financing, Final Report, October, http://www.osc.gov.on.ca/en/About/Publications/small_business.html Riding, A.L., 1998, Financing Entrepreneurial Firms: Legal and Regulatory Issues, Research Paper Prepared for the Task Force on the Future of the Canadian Financial Services Sector, September. Robinson, M., 1997, Mobiliser des capitaux d’investissement pour les petites et moyennes entreprises sur les marchés boursiers au Canada, P. Halpern ed., in Financing Growth in Canada, University of Calgary Press, 659-709.. 26.
(31) Robinson, M., 1993, Raising Start-Up Equity Capital: Alberta’s Junior Capital Pool Program, Working Paper, Faculty of Management, University of Calgary, December. Sapienza, H. J., 1992, When Do Venture Capitalists Add Value?, Journal of Business Venturing 7(1): 9-27. Small Business Service and HM Treasury (SBS), 2003, Bridging the Finance Gap: Next Steps in Improving Access to Growth Capital for Small Businesses, http://www.sbs.gov.uk/default.php?page=/consultations/default.php Varma, R. and S.H. Szewczyk, 1993, The Private Placement of Bank Equity, Journal of Banking and Finance, 17(6): 1111-1131.. 27.
Figure


+6


Documents relatifs
KT launched the nation’s first satellite broadcasting company, SK Telecom started a satellite DMB business, Hanaro Telecom is about to launch IP-TV service and Dacom has a
Figure 7: Effective length plot for second example wall When comparing the isothermal plots for the clear wall (see Figure 8) and the thermal bridge wall (see Figure 9),
The data analysis problem which we address here can be formulated as the robust identification of transient artifacts (glitches) in the gravitational-wave channel based on
Estudios sobre caracterización climática y generación de escenarios climáticos se han desarrollado en el marco de ini- ciativas nacionales sobre cambio climático y adaptación es
However, these results do not hold for firms that report little about their risk factor exposure; the readability of risk information does not influence the
We have presented in this study a method for developing a pair interaction model for Fe-Ni alloys, fitted at 0 K on the enthalpies of formation of ordered and disordered
Depuis la fin de la Deuxième Guerre mondiale, l’Afrique de l’Ouest a connu une croissance urbaine élevée. Comme dans la plupart des pays du « Tiers Monde »
We reasoned that direct Sox9 Sertoli target genes should display decreased signals in 90 dpp and 165 dpp AMH-Cre Sox9 flox/flox mutant samples, at least one Sox9 binding motif should
