Form-function relationships in a marine foundation species depend on scale: a shoot to global 1
perspective from a distributed ecological experiment 2
3
Running page head: Global form-function relationships in eelgrass 4
5
J.L. Ruesink*1, J.J. Stachowicz2, P.L. Reynolds2,3, C. Boström4, M. Cusson5, J. Douglass6, J. 6
Eklöf7, A. H. Engelen8, M. Hori9, K. Hovel10, K. Iken11, P.O. Moksnes12, M. Nakaoka13, M.I. 7
O’Connor14, J.L. Olsen15, E.E. Sotka16, M.A. Whalen2, J.E. Duffy3,17 8
9
1Department of Biology, University of Washington, Seattle, WA 98195, USA 10
2Department of Evolution and Ecology, University of California, Davis, CA 95616, USA 11
3Virginia Institute of Marine Science, Gloucester Point, VA 23062 USA 12
4Environmental and Marine Biology, Faculty of Science and Engineering, Åbo Akademi 13
University, Artillerigatan 6, 20520 Åbo, Finland 14
5Département des sciences fondamentales, Université du Québec à Chicoutimi, Chicoutimi, QC 15
G7H 2B1, Canada 16
6Florida Gulf Coast University, Fort Myers, FL 33965, USA 17
7Department of Ecology, Environment and Plant Sciences, Stockholm University, 106 91 18
Stockholm, Sweden 19
8Centro de Ciencias do Mar do Algarve (CCMAR), University of Algarve, 8005 139 Faro, 20
Portugal 21
9Institute of Fisheries and Environment of Inland Sea, Japan Fisheries Research and Education 22
Agency, Hiroshima 739-0452, Japan 23
10Department of Biology, San Diego State University, San Diego, CA 92182, USA 24
11College of Fisheries and Ocean Sciences, University of Alaska Fairbanks, AK 99775, USA 25
12Department of Marine Sciences, University of Gothenburg, SE-405 30 Goteborg, Sweden 26
13Akkeshi Marine Station, Field Sciences Center of Northern Biosphere, Hokkaido University, 27
Aikappu, Akkeshi, Hokkaido 088-1113, Japan 28
14Department of Zoology and Biodiversity Research Centre, University of British Columbia, 29
Vancounver, BC V6T 1Z4, Canada 30
15Groningen Institute for Evolutionary Life Sciences, University of Groningen, 9747 AG, 31
Groningen, NL 32
16Grice Marine Laboratory, College of Charleston, Charleston, SC 29412, USA 33
17Tennenbaum Marine Observatories Network, Smithsonian Institution, Washington, D.C. 34
20013, USA 35
36
*Corresponding author: ruesink@u.washington.edu 37
39
Abstract 40
Form-function relationships in plants underlie their ecosystem roles in supporting higher trophic 41
levels through primary production, detrital pathways, and habitat provision. For widespread, 42
phenotypically-variable plants, productivity may differ not only across abiotic conditions, but 43
also from distinct morphological or demographic traits. A single foundation species, eelgrass 44
(Zostera marina), typically dominates north temperate seagrass meadows, which we studied 45
across 14 sites spanning 32-61° N latitude and two ocean basins. Body size varied by nearly two 46
orders of magnitude through this range, and was largest at mid-latitudes and in the Pacific 47
Ocean. At the global scale, neither latitude, site-level environmental conditions, nor body size 48
helped predict productivity (relative growth rate 1-2% d-1 at most sites), suggesting a remarkable 49
capacity of Z. marina to achieve similar productivity in summer. Furthermore, among a suite of 50
stressors applied within sites, only ambient leaf damage reduced productivity; grazer reduction 51
and nutrient addition had no effect on eelgrass size or growth. Scale-dependence was evident in 52
different allometric relationships within and across sites for productivity and for modules (leaf 53
count) relative to size. Z. marina provides a range of ecosystem functions related to both body 54
size (habitat provision, water flow) and growth rates (food, carbon dynamics). Our observed 55
decoupling of body size and maximum production suggests that geographic variation in these 56
ecosystem functions may be independent, with a future need to resolve how local adaptation or 57
plasticity of body size might actually enable more consistent peak productivity across disparate 58
environmental conditions. 59
60
Key words: seagrass productivity, allometry, multiple stressors 61
Introduction
63
Because they underlie habitat provision and food web support, plant form and function provide 64
critical linkages from species to ecosystem processes. Plant traits differ reliably among taxa 65
(Kattge et al. 2011), yet may also be modified by the plant’s experience of its local environment. 66
Thus ecologists have framed their understanding of form and function in two ways. First, traits 67
of a particular species could differ across contexts due to variability in bottom-up limitation or 68
top-down control; these constitute external constraints (Fig. 1). Second, different allocation 69
among traits may inherently follow plant size, as plants balance size-specific demands for 70
support, transport and resource acquisition. Optimal branching patterns predict 3/4-power scaling 71
relationships of photosynthetic area with size (Niklas and Enquist 2001), a pattern that has 72
recently been extended from seed plants to kelps (large marine macrophytes; Starko and Martone 73
2016). Thus, as an internal constraint, plant productivity (relative growth rate) declines with 74
body size (Enquist et al. 1999; Fig. 1). Metabolic scaling relationships are expected to hold best 75
for adult plants growing as monocultures under optimal conditions (generally across species 76
varying by orders of magnitude in body size), whereas productivity reduced by external 77
constraints clearly applies when conditions are not optimal, and comparisons often involve a 78
single species in different contexts. Consequently, challenges emerge in any simultaneous 79
consideration of internal vs. external factors influencing form-function relationships (Brown et 80
al. 2004, Tilman et al. 2004). Here we examine plant form and function in the context of a 81
distributed experimental manipulation of resources and consumers affecting a marine 82
Angiosperm (eelgrass, Zostera marina L.). This plant typically occurs in monocultures forming 83
meadows, occupies a broad geographic range from ~30-70°N in both Atlantic and Pacific Ocean 84
basins, and spans two orders of magnitude in local adult body size. These attributes make it an 85
excellent candidate for joint consideration of trophic dynamics, resources and conditions, and 86
body size as drivers of plant productivity, while the distributed experiment enables scaling from 87
shoot (within-site) to global scales (across-site). 88
Distributed experiments provide a test of general ecological concepts across contexts, 89
where methodological approaches remain constant and therefore do not interfere with examining 90
context-dependence (Borer et al. 2014a). Recent distributed experiments have demonstrated that 91
consumers accelerate decomposition in streams (Boyero et al. 2011) and grasslands (Wall et al. 92
2008) and promote coexistence in grasslands (Borer et al. 2014b), while grassland production 93
appears generally constrained by multiple nutrient limitation (Fay et al. 2015). Latitude underlies 94
a portion of the context-dependence in results, perhaps through differences in thermal conditions 95
or length of growing season. Similarly for altitude, in neighbor-removal experiments established 96
at multiple sites along elevation gradients, competitive interactions among plants characterized 97
low-elevation results, and these interactions became more facilitative under stressful high-98
elevation conditions (Callaway et al. 2002). Notwithstanding these distributed experimental tests 99
of top-down, bottom-up, and within-trophic level control, terrestrial grassland annual production 100
at a global scale is linked strongly to the amount and seasonality of precipitation (Knapp and 101
Smith 2001, Guo et al. 2012, Gang et al. 2015). 102
This brief compilation of terrestrial grassland studies, especially those with multi-site or 103
large-scale considerations, already highlights several reasons why marine grasslands might 104
function quite differently: 1) water is never limiting within the low intertidal and subtidal zones 105
occupied by Z. marina; 2) Z. marina reaches high cover in meadows as the sole Angiosperm 106
present, rather than being one of a functionally-diverse set of plants as in terrestrial grasslands; 3) 107
annual production cannot be measured through changes in live or dead standing biomass of Z. 108
marina, due to rapid turnover of leaves – each lasting less than a growing season – followed by 109
remineralization or export; 4) Z. marina can harbor dense epiphytic cover, which is targeted for 110
consumption by mesograzers (small crustaceans and gastropods), such that eelgrass shoots 111
receive little direct herbivory (with some notable exceptions); and 5) nutrient addition often 112
favors competing microalgae – that is, eutrophication has been a global driver of the loss of 113
seagrass meadows (Orth et al. 2006). 114
Perhaps because spatial variability in water resources is irrelevant, Z. marina provides 115
exceptionally strong evidence of a latitudinal gradient in annual productivity (Olesen et al. 116
2015). These data come from the rate of leaf production by individuals (productivity), not from 117
production per area, which is affected by spatial variation in cover unrelated to latitude (Clausen 118
et al. 2014). Possible mechanisms include thermal constraints or short growing seasons that limit 119
productivity at high latitudes. This latitudinal pattern in annual production is recapitulated in 120
Spartina alterniflora (across ~17° latitude), a salt marsh grass that, like eelgrass, defines its 121
habitat type (Kirwan et al. 2009), but perhaps not in giant kelp (Macrocystis pyrifera) whose 122
growth responds to photoperiod at higher latitudes but nutrient availability at lower latitudes 123
(Graham et al. 2007). With global patterns of annual productivity in eelgrass meadows well 124
established, we focus instead on the productivity of plants under optimal conditions in summer, 125
when rates of leaf turnover are typically most rapid. Because of targeting this maximum 126
productivity, distinct predictions at the global scale emerge from internal and external constraints 127
(Fig. 1), the former predicting a decline in productivity with body size, and the latter predicting 128
that body size or productivity differs by site-level environmental conditions. Additionally, range 129
edges may include conditions that compromise peak performance, and since we are targeting a 130
single grassland species, a unimodal latitudinal pattern in form and function could emerge. 131
Layered within this global perspective, our distributed experiment modified top-down 132
and bottom-up factors in ways that could alleviate some potential constraints on productivity 133
(Fig. 1). Key responses by epiphytes have already been published from this distributed 134
experiment, showing that epiphytes increased by 30% when crustacean mesograzers were 135
reduced but did not respond to water-column fertilization (Duffy et al. 2015). As we address the 136
eelgrass response in this paper, we predict a negative effect of increased epiphyte load (due to 137
competition; Neckles et al. 1993) and a positive effect of fertilizer where eelgrass beds tend to be 138
nutrient-limited (Duarte 1990). At the same time, shoots experiencing direct damage could also 139
contribute to within-site variability in productivity as an immediate response to reduced leaf area 140
(Ruesink et al. 2012). Finally, much of the variability in shoot size within sites arises 141
ontogenetically, such that productivity may decline with body size due to accumulation of non-142
productive tissue and self-shading (Pommerening and Muszta 2016). The negative relationship 143
between productivity and body size is thus expected both across sites from metabolic scaling 144
considerations for adult plants, and within sites from ontogenetic scaling (Fig. 1C). Nevertheless, 145
as in the across-site case detailed above, distinct predictions about within-site patterns of 146
productivity can be made with respect to body size and experimentally-manipulated 147
environmental conditions. 148
We measured form and function traits of Z. marina at 14 sites spanning its wide 149
biogeographic range, where we experimentally established mesograzer deterrent and fertilizer 150
treatments in a factorial design. The above-ground morphology of Z. marina consists of several 151
leaves, all essentially rectangles of the same width, bundled together at the base by a sheath (Fig. 152
1B). This morphology lends itself to several simple metrics of plant size based on measuring the 153
length of each leaf, the sheath width and length (Echevarría-Heras et al. 2013). Leaf extension 154
derives from a leaf-punching method, tracked as these holes move away from the basal 155
meristem, and this absolute growth rate is used to calculate productivity (RGR, relative growth 156
rate) as daily leaf extension relative to the summed length of all standing leaves (Dennison 1990, 157
Herbert and Fourqurean 2009). We developed our predictions specifically for this marine plant, 158
considering its peak summer productivity in monocultures across a variety of local 159
environmental conditions and for ecotypes that differ dramatically in body size and allocation 160
(e.g., Keddy 1987, Backman 1991, Short and Short 2003, Clausen et al. 2014, Fig. 1). 161
162
1) At the global scale, summer productivity could vary with A) body size, following metabolic 163
scaling rules (internal), or B) latitude (external), declining in response to lower temperatures 164
towards the pole, or increasing if lower-latitude populations experience stressful high 165
temperatures or shorter photoperiod relative to higher-latitude sites. Overall, these countervailing 166
factors could generate a mid-range peak in productivity. 167
168
2) At the local scale, productivity is expected to decline with A) body size (internal), but 169
additionally be sensitive to B) increased epiphytes, C) limited nutrients, and D) leaf tissue loss 170 (external). 171 172
Methods
173We measured eelgrass growth at 14 sites within the Zostera Experimental Network in 2011 (Fig. 174
2A, Supplementary Material Appendix 1 Table A1). These sites are distributed throughout the 175
range of Z. marina, including both Atlantic and Pacific coastlines and from 32° to 61°N. Sites 176
were selected where perennial Z. marina spanned an alongshore distance of at least 100 m, and 177
they ranged in cover of Z. marina from 17 to 93% (mean 67%; Supplementary Material 178
Appendix 1 Table A2). More northerly sites were generally sampled later in the summer 179
coincident with anticipated peak biomass (Clausen et al. 2014; Supplementary Material 180
Appendix 1 Table A1). 181
182
Experimental design 183
At each site, an identical factorial experimental design was carried out to manipulate nutrients 184
and mesograzers over a four-week period. Both nutrients and mesograzer deterrent were applied 185
using slow-release methods in the water column, and the fully-factorial design resulted in four 186
treatment groups (n=10 plots per treatment; Duffy et al. [2015]).Plots were triangular in shape, 187
50 cm on a side, and separated by ~2 m within a continuous area of Z. marina. 188
Eelgrass shoots were marked for growth during the third week of the experiment. Near 189
the top of the leaf sheath, a puncture was made with a sharp wire or syringe in each of several 190
shoots in each of the 40 plots per site (Dennison 1990). These marks on growing leaves diverged 191
from the mark on the non-growing outer sheath as younger leaves grew from the basal meristem 192
(= new leaf extension; Fig. 1B). After 6-16 days, the shoots were collected and one to three 193
shoots per plot were measured for sheath length and width and the length of each leaf, 194
distinguishing new leaf extension from distal portions above each leaf’s mark that were 195
originally present (Fig. 1B). (At one site (San Diego), the distance between each shoot base and 196
the original mark in the leaf sheath was used as a surrogate for sheath length.) Body size was 197
determined as the sum of all leaf lengths (from meristem to distal tip), multiplied by sheath 198
width; this should index above-ground biomass since only leaves project above the sediment, and 199
they are flat and can be assumed rectangular (Echevarría-Heras et al. 2013). Allometric 200
relationships among traits were examined for maximum length (=canopy height), number of 201
leaves, sheath width, and sheath length, with this last trait serving a unique role as it remained 202
intact even when leaves were damaged or some abscised. Absolute growth rate (AGR) is daily 203
leaf extension, considering all growing leaves (Fig. 1B). Relative growth rate (RGR) is the 204
percentage of the total shoot that consists of each day’s new growth (Herbert and Fourqurean 205
2009). The duration between marking and collecting differed across sites but these differences 206
did not bias daily growth calculations (Supplementary Material Appendix 1 Table A1, A3). 207
Measurements from each shoot were further used to describe “leaf condition” along a 208
spectrum from damaged to intact. This index was based only on the original leaf material above 209
the sheath and not on new growth between marking and collecting (Fig. 1B). Once the total 210
length of original leaf material was standardized to sheath length, larger values indicated more 211
leaf material remaining above the sheath, and smaller values were associated with loss of whole 212
or distal parts of leaves. 213
Within each plot, we determined epiphyte load as in Duffy et al. (2015). Epiphytes and 214
associated material were gently scraped from one shoot per plot and chlorophyll-a (g) was 215
extracted for spectrophotometric analysis to estimate microalgal biomass. Chl-a was then divided 216
by shoot dry mass to obtain epiphyte load per unit leaf biomass. Leaf nitrogen content was 217
measured in the youngest leaf from three shoots per plot, including those measured for growth, 218
which were dried and pooled for nutrient analysis on a CHN analyzer (Thermo Fisher Scientific 219
Inc., Waltham, MA; Duffy et al. 2015). 220
221
Global variation in eelgrass size and productivity 222
Biogeographic patterns were tested for size and growth traits of Z. marina based on site-level 223
means. We included latitude as a first- and second-order predictor, as well as ocean (Atlantic 224
including Baltic Sea, or Pacific) to account for distinct evolutionary lineages of Z. marina (Olsen 225
et al. 2004). While latitude and ocean may explain global traits statistically, they do not provide 226
underlying mechanisms for variability. Limiting factors for plants span general categories of 227
light, temperature, moisture (i.e., salinity in aquatic environments), and nutrients (Fig. 1C). 228
Diversity (i.e., genotypic) promotes seagrass population growth, resistance and resilience to 229
perturbations (Procaccini et al. 2007, Hughes and Stachowicz 2011). To test for these global-230
scale predictors, we took a model comparison approach to evaluate shoot size (sheath length) and 231
RGR in relation to all possible subsets of nine abiotic and biotic variables that were both 232
available at all sites and appeared in the published literature as potentially influential (Fig. 1C). 233
These nine predictors were: minimum water depth, tidal amplitude, photoperiod, epiphyte load, 234
total macrophyte cover, salinity, water temperature, % nitrogen in unfertilized leaf tissue, and Z. 235
marina genotypic richness (Supplementary Material Appendix 1 Table A1-A3). All but the first 236
two were specific to the time of study. All predictors were normalized (mean=0 and SD=1) so 237
that model results show standardized coefficients. We compared all possible combinations of 238
predictor variables and a null model with an intercept but no predictors. Interactions among 239
predictors were not possible to include due to the high number of predictors relative to global 240
sample size. The models were compared by Akaike’s Information Criterion, adjusted for small 241
sample size (AICc), which penalizes more complex models (Burnham and Anderson 2002), 242
using the dredge function in the Multimodel Inference package in R (MuMIn; Barton 2015, R 243
Core Team 2015). 244
Allometric relationships were determined for RGR as a function of log10(body size), 245
motivated by metabolic scaling laws, and for leaf extension (AGR) relative to sheath length, 246
which has precedent for eelgrass (Gaeckle et al. 2006). Allometry among plant traits was also 247
examined for sheath width, maximum length, and number of leaves vs. sheath length. Allometric 248
relationships are typically tested by reduced (standard) major axis regression on log-transformed 249
values (Smith 2009), which we implemented in the lmodel2 package in R (Legendre 2015). Each 250
trait relationship was described by a slope and 95% confidence interval at each site, and also 251
across sites based on site means. We considered allometric relationships to differ across scales if 252
the 95% confidence intervals did not overlap. 253
254
Eelgrass size and productivity in the distributed experiment 255
Eelgrass was analyzed with respect to initial treatments of the distributed experiment 256
(mesograzer deterrent and water-column fertilizer), as well as with respect to continuous 257
variables representing nutrient conditions, epiphyte load, and shoot damage. Analyses were 258
carried out for response variables of sheath length (size) and absolute growth rate. In the latter 259
case, sheath length was included as a covariate because leaves from larger shoots extend faster 260
(i.e., Fig. 3B). Sheath length and AGR were evaluated with deterrent, nutrients, and their 261
interaction as fixed effects. Site and plot within site were random effects in linear mixed effects 262
models. Analyses were performed in the nlme package in R (Pinheiro et al. 2016, R Core Team 263
2015), and we set an -level of 0.05. 264
AGR was also modeled as a function of three continuous variables that are potential 265
stressors to eelgrass: epiphyte load, nutrient limitation, and leaf damage. As in our analyses of 266
deterrent and nutrient treatments, sheath length was included as a covariate. Epiphyte load was 267
based on the plot-level measurement of epiphyte load (chl-a g per gDW Z. marina). Nitrogen 268
content of leaf tissue in each plot provided an index of nutrient limitation (cf. Duarte 1990). Leaf 269
condition, which we calculated as the length of all original leaves per sheath length for each 270
shoot (Fig. 1B), by definition reaches higher values in shoots with less damage. With sheath 271
length in the denominator of leaf condition, some values of leaf condition appeared biologically 272
unrealistic given typical numbers of leaves and their maximum length. Further, underestimates of 273
sheath length could introduce artificial positive relationships between leaf condition and absolute 274
growth. Thus, we censored shoots with leaf condition > 16 (Supplementary Material Appendix 4 275
Figure A2), a threshold that we set by considering it unlikely that shoots would retain more than 276
four fully-extended leaves, especially as this referred only to leaf material present at the time of 277
marking and still present at collection. This threshold reduced total shoot number from 856 to 278
704 and removed one site altogether (San Diego, consistent with underestimates of sheath length 279
at that site). Because of our focus on within-site variability in epiphytes, nutrients, and damage, 280
all of which had continuous distributions, we carried out separate multiple regressions using data 281
at each site, then combined across sites using a meta-analytic approach. The multiple regressions 282
generated mean effect sizes and standard errors for each predictor (sheath length, epiphyte load, 283
leaf nitrogen content, and leaf condition) at each site; plot was included as a random effect at 284
sites with more than one shoot measured per plot. Then we used the site-specific ratios of mean 285
effect size to standard error as samples in a calculation of global mean and 95% confidence 286
interval for each predictor variable. 287
288
Data deposition 289
Data are archived through the Biological and Chemical Oceanography Data Management Office 290
(http://www.bco-dmo.org/project/472215; Duffy et al. 2014) and in DataDryad 291
(doi:10.5061/dryad.r417d; Ruesink et al. 2017). 292
293
Results
294
Global variation in eelgrass size and productivity 295
We expected summer productivity to vary with latitude in either linear or quadratic relationship, 296
but Z. marina RGR across 14 sites did not (Fig. 2C). Biogeographic patterns did, however, 297
emerge for body size. Based on total leaf area, sheath length and canopy height, eelgrass shoots 298
were largest in the middle of the latitudinal range (~42-50ºN) and larger at sites in the Pacific 299
than Atlantic Ocean (Fig. 2B, Supplementary Material Appendix 2 Table A4). 300
In our more extensive comparison of models containing up to nine mechanistic 301
predictors, none predicted site-level variation in sheath length well; the top model was the null 302
model, with some support for size increasing with genotypic richness or leaf nitrogen content 303
(Table 1). Relative growth rate was positively related to epiphyte load in all of the top four 304
models, with the null model (ranked fifth) more than 2 AICc units away from the top model 305
(Table 1). However, this across-site pattern was sensitive to a single site (Washington) with 306
highest epiphyte load and RGR (Supplementary Material Appendix 1 Table A1, A3). 307
The relationship of productivity to body size, which we expected to emerge under 308
internal constraints, showed distinct within- and across-site patterns. RGR declined with size 309
within sites but did not change with size across sites (Fig. 3A, Supplementary Material Appendix 310
3 Table A5). Absolute growth rate increased with sheath length both within and across sites (Fig. 311
3B). This relationship was isometric across sites but within many sites showed positive 312
allometry. 313
One other allometric comparison showed distinct within- and across-site patterns: number 314
of leaves increased with sheath length at some sites, but did not differ by sheath length across 315
sites (Fig. 4C). Sheath width increased slower than length (negative allometry) whereas canopy 316
height was isometric with sheath length, but both relationships were similar within and across 317
sites (Fig. 4A, B, Supplementary Material Appendix 3 Table A5; this supplement also documents 318
a linear mixed-effects approach in which results align with reduced major axis regression). 319
320
Eelgrass size and productivity in the distributed experiment 321
The nutrient and food web manipulations imposed at each site had little overall consequence for 322
eelgrass form and function. Neither deterrent, nutrients, nor their interaction had a significant 323
effect on size (sheath length) or growth (daily leaf extension, standardized to sheath length; 324
Table 2). Further, when epiphyte load and leaf nitrogen content were considered as continuous 325
predictors across plots within sites, neither affected leaf extension (Fig. 5). However, growth 326
increased significantly with leaf condition at an approximately one-to-one rate (Fig. 5). That is, 327
each additional length of original leaf material per sheath length led to a similar additional 328
amount of leaf extension d-1; site-level coefficients for leaf condition averaged 1.45 329
(Supplementary Material Appendix 4 Table A7). Leaf condition is reduced by partial or entire 330
loss of leaves, and such damage does not immediately change sheath length but reduces size-331 corrected growth. 332 333
Discussion
334Internal constraints on plant architecture and productivity result in robust allometric 335
relationships across taxa (Enquist et al. 1999, Niklas and Enquist 2001, Starko and Martone 336
2016). Across diverse seagrass species, allometry informs life history strategy and functional 337
role. Larger species have lower productivity and lower frequencies of module initiation (leaves, 338
branches), whereas smaller species have rapid rhizome extension and a vegetative colonization 339
strategy (Duarte 1991). A unique aspect of our study was its attention to a single species 340
exhibiting dramatic phenotypic variation (Fig. 1), studied biogeographically under peak local 341
growing conditions. At this within-species view, an expected negative size-productivity 342
relationship was not evident across sites (Fig. 3A). Possibly, Z. marina can achieve rapid 343
productivity (RGR 1-2% d-1) regardless of size due to its growth form in an aquatic environment, 344
since it need not build up non-photosynthetic biomass (support structures) or self-shading leaves, 345
and instead rapidly turns over its photosynthetic biomass. As a result, it also limits the build-up 346
of epiphytes that are potential competitors. Some of the features that make Z. marina especially 347
suited to a comparison of internal and external constraints on form-function relationships may 348
also decouple size and productivity. 349
When form-function relationships are scale-dependent, different controls on trait 350
expression must dominate across scales, while scale-dependence may also emerge statistically 351
when different traits do not share the same degree of within- and across-site variability. In our 352
data, both RGR and module (leaf) number were more variable within than across sites relative to 353
body size (Fig. 3A, 4C). Thus, although different ecotypes converged on similar rates of biomass 354
(and module) turnover in summer, ontogenetic development did not recapitulate the form-355
function variability observed across sites. Indeed, the accumulation of leaves in larger shoots 356
within sites (Fig. 4C) helps to reconcile two otherwise opposing trends at this smaller scale, 357
because larger shoots grow in total area faster than in sheath length: positive allometry for leaf 358
extension relative to sheath length (Fig. 3B), but negative allometry for RGR relative to total leaf 359
area (Fig. 3A). Going forward, it may be possible to link scale-dependence to plant growth form, 360
for instance, consistent allometric relationships within and across sites for plants altering 361
photosynthetic area through leaf number rather than size, or developing support structures 362
ontogenetically. 363
Although internal constraints are germane to our study, focused on a single species under 364
peak growing conditions, other distributed experiments have revealed a general role for external 365
constraints on community-level responses. For instance, in multi-species grasslands, resource 366
levels, diversity, and biomass (which accumulates during the growing season) show complex 367
relationships (Grace et al. 2016), and consumers and resources interactively determine plant 368
species coexistence (Borer et al. 2014b). In Z. marina, we found many traits to be unexpectedly 369
robust to both across-site environmental variation (Table 1) and within-site manipulation of top-370
down and bottom-up drivers (Table 2, Fig. 5). We also found no latitudinal pattern in summer 371
RGR (Fig. 2B), despite latitudinal declines in annual productivity of Z. marina (Olesen et al. 372
2015). How can a single species grow equally well under such different thermal, salinity, and 373
resource levels? One possible explanation at the across-site scale comes from local adaptation, 374
which generates locally-tuned traits, just as ecotypes of trees (Pinus sylvestris) from different 375
latitudes have different optimal temperatures for growth (Rehfeldt et al. 2002). Additionally, 376
what might make growth and form insensitive to experimental treatments? Seagrass systems 377
contain two functionally-distinct groups of primary producers (seagrass, epiphytes), with 378
epiphytes being the target of experimental treatments (Duffy et al. 2015). More generally, 379
nutrients may either alleviate nutrient limitation or interfere with standing biomass or growth 380
through proliferation of algal competitors (Hughes et al. 2004, Moksnes et al. 2008, Cabaço et al. 381
2013, Östman et al. 2016). Unfertilized shoots exceeded the threshold for nutrient limitation 382
(1.8% nitrogen; Duarte 1990) at most sites (Supplementary Material Appendix 1 Table A2), 383
which may have precluded any overall positive fertilizer effect. We can also draw on evidence 384
from a few sites suggesting why an indirect effect (mediated through epiphytes) could be weak 385
overall. Negative effects of epiphytes were evident in Virginia after two months of mesograzer 386
exclusion (Reynolds et al. 2014), and in Sweden when fertilized, due to macroalgal blooms 387
rather than epiphytic microalgae (unpublished data). In contrast, experimental removal of heavy 388
epiphyte loads at Washington did not improve eelgrass RGR, which was already relatively rapid 389
(Ruesink 2016). Overall, then, the diversity of direct and indirect pathways potentially linking 390
plant responses to experimental treatments could obscure any general pattern, especially among 391
just 14 sites in the present study. 392
Internal constraints predict negative size-productivity relationships from metabolic 393
scaling, and external constraints predict that both growth and size could be limited in concert 394
(Fig. 1). Such internal and external constraints have also been proposed as mechanisms for 395
shrinking body size of many species under anthropogenic climate change (Sheridan and Bickford 396
2011) and for latitudinal patterns of body size (Blackburn et al. 1999). However, the scheme in 397
Figure 1 was insufficient to capture all the form-function patterns in our distributed experiment, 398
particularly because we did not predict a mid-range peak in body size or larger shoots at Pacific 399
than Atlantic sites, independent of summer RGR (Fig. 2). These biogeographic patterns in size 400
appear distinct from other taxa, despite the variety of body size patterns reported (e.g. Mousseau 401
1997, Meiri and Dayan 2003). Figure 1 also needs modifying for modular organisms to 402
incorporate an external constraint from leaf damage (Fig. 5). Body size reduction (removing 403
photosynthetic leaf area) immediately slowed growth (Fig. 5; positive size-productivity 404
relationship, rather than the negative size-productivity relationship proposed in Fig. 1). The 405
result here contrasts with some other studies of simulated or actual grazing that augments 406
seagrass productivity or rate of branching (Valentine et al. 1997, Cebrian et al. 1998) in a manner 407
similar to compensatory growth documented in terrestrial grasslands (McNaughton et al. 1983). 408
Because water is a dense fluid, water motion can transport sloughed leaves of Z. marina away 409
from their site of production, thus preventing build-up of litter that is part of the mechanism of 410
compensatory growth in terrestrial grasslands. Both modifications of Figure 1 would benefit 411
from data regarding allocation among photosynthetic tissues, since leaf area increases with either 412
new shoots or larger leaves. The relationships here between size and productivity are at the level 413
of ramets and could be different for genets. Similarly, compensatory growth may be more 414
evident in shoot counts than in RGR, since shoot removal can be compensated by accelerated 415
clonal production of shoots (Ruesink et al. 2012). 416
In the framework of ecological traits, body size may act as either a response trait, such 417
that size characterizes particular environmental conditions, or as an effect trait driving 418
productivity (Suding et al. 2008, Fig. 1C). A further aspect of size acting as an effect trait in 419
foundation species arises when plant architecture shapes the modification of abiotic conditions 420
and the suitability as habitat for other species. Because of the isometry of leaf extension (AGR) 421
and canopy height relative to sheath length across sites (Fig. 4A, B), sheath length can serve as a 422
reliable indicator of services deriving from other traits. However, the particular trait relationships 423
documented in this distributed experiment mean that services related to architecture (habitat, 424
flow reduction; Fonseca et al. 1982, Heck et al. 2003) may differ more than those related to 425
RGR, such as summer carbon dynamics or detrital provisioning. For Z. marina, our results open 426
up a new challenge to resolve the contributions of phenotypic plasticity and genetic adaptation 427
underlying ecotypes, especially enabling convergent RGR across a wide range of environmental 428
conditions in summer. Genetically based trait variation in Z. marina is well-established (Hughes 429
et al. 2009, Winters et al. 2011), and local adaptation seems likely (Boström et al. 2004, Salo et 430
al. 2014), but shoots are also able to remodel in response to changes in environmental conditions 431
such as light, temperature, water motion, and disturbance (Ruesink et al. 2012, Eriander 2017). 432
More broadly, our study points to the value of tracking variability in traits within species, in the 433
context of an ongoing challenge to meld ecological perspectives emphasizing internal and 434
external constraints. This melding is improved by setting up competing hypotheses at particular 435
scales, while rich testing grounds exist in emerging trait databases – if collated with 436
environmental data – and distributed studies. 437
438
439
Acknowledgements The Zostera Experimental Network was funded by NSF OCE-1031061 and 440
OCE-1336206 to J. E. Duffy, OCE-1336741 to J. Stachowicz, and OCE-1336905 to K. Hovel. 441
Nodes in the network provided their own human capital, and sincere thanks for field help go to: 442
R. Descoteaux, A. Ravelo, S. Savard, T. Spurkland (AK); B. Brand, A. Fisher, D. Kronk, K. 443
Martens, E. Potter, S. Seshadri, R. Wong (BB); C. Prentice (BC); K. Momota, S. Aoe, K. Saito, 444
H. Katsuragawa, S. Hamano (JN); K. Momota, H. Shimabukuro (JS); P Diogo, T. Pereira, E. 445
Serrão (PO); S. Cimon, W.H. Landry (QU); L. Eriander (SW); J.S. Lefcheck, J.P. Richardson 446
(VA), N. Freshley, S. Herrold (WA). AHE was supported by FCT fellowships 447
SFRH/BPD/63703/2009 and SFRH/BPD/107878/2015. We greatly appreciate the efforts of 448
Elizabeth Borer and two anonymous reviewers, whose guidance improved the manuscript. 449
450
References 451
Backman, T. W. H. 1991. Genotypic and phenotypic variability of Zostera marina on the west 452
coast of North America. – Canadian Journal of Botany 69: 1361-1371. 453
Barton, K. 2015. Package ‘MuMIn’ cran.r-project.org/web/packages/MuMIn/MuMIn.pdf 454
Blackburn, T. M., et al. 1999. Geographic gradients in body size: a clarification of Bergmann’s 455
rule. – Diversity and Distributions 5: 165-174. 456
Boström, C. et al. 2004. Shoot morphometry and production dynamics of two eelgrass (Zostera 457
marina L.) populations at the lower salinity limit: a field study from the northern Baltic 458
Sea (61° N). – Aquat. Bot. 79: 145-161. 459
Borer, E. T. et al. 2014a. Finding generality in ecology: a model for globally distributed 460
experiments. – Methods in Ecology and Evolution 5: 66-73. 461
Borer, E. T. et al. 2014b. Herbivores and nutrients control grassland plant diversity via light 462
limitation. – Nature 508: 517-520. 463
Boyero, L. et al. 2011. A global experiment suggests climate warming will not accelerate litter 464
decomposition in streams but might reduce carbon sequestration. – Ecology Letters 14: 465
289-294. 466
Brown, J.H. et al. 2004. Toward a metabolic theory of ecology. – Ecology 85: 1771-1789. 467
Burnham, K. P. and Anderson, D. R. 2002. Model selection and multimodel inference: a 468
practical information-theoretic approach. Springer, New York, USA. 469
Cabaço, S. et al. 2013. Effects of nutrient enrichment on seagrass population dynamics: evidence 470
and synthesis from the biomass-density relationships. – J. Ecol. 101: 1552-1562. 471
Callaway, R. M. et al. 2002. Positive interactions among alpine plants increase with stress. – 472
Nature 417: 844-848. 473
Cebrian, J. et al. 1998. Leaf growth response to simulated herbivory: a comparison among 474
seagrass species. – J. Exp. Mar. Biol. Ecol. 220: 67-81. 475
Clausen, K. K. et al. 2014. Seasonality of eelgrass biomass across gradients in temperature and 476
latitude. – Mar. Ecol. Prog. Ser. 506: 71-85. 477
Dennison, W. C. 1990. Leaf production. In: Phillips, R. C. and McRoy, C. P. (eds), Seagrass 478
Research Methods. UNESCO, Paris, France, pp. 77-79. 479
Duarte, C. M. 1990. Seagrass nutrient content. – Mar. Ecol. Prog. Ser. 67: 201-207. 480
Duarte, C. M. 1991. Allometric scaling of seagrass form and productivity. – Mar. Ecol. Prog. 481
Ser. 77: 289-300. 482
Duffy, J. E. et al. 2014. Project: Zostera Experimental Network. http://www.bco-483
dmo.org/project/472215 484
Duffy, J. E. et al. 2015. Biodiversity influences top-down effects in eelgrass communities across 485
the Northern Hemisphere. – Ecology Letters 18:6 96-705. 486
Echevarría-Heras, H. et al. 2013. An allometric method for measuring leaf growth in eelgrass, 487
Zostera marina, using leaf length data. – Botanica Marina 56:275-286 488
Enquist, B.J. et al. 1999. Allometric scaling of production and life-history variation in vascular 489
plants. – Nature 401:907-911 490
Fay, P.A. et al. 2015. Grassland productivity limited by multiple nutrients. – Nature Plants 1: 491
UNSP 15080. 492
Fonseca, M. S. et al. 1982. Influence of the seagrass, Zostera marina, on current flow. – 493
Estuarine Coastal Shelf Science 15: 351-364. 494
Gaeckle, J. L. et al. 2006. Sheath length as a monitoring tool for calculating leaf growth in 495
eelgrass (Zostera marina L.) – Aquat. Bot. 84: 226-232. 496
Gang, C., et al. 2015. Comparative assessment of grassland NPP dynamics in response to climate 497
change in China, North America, Europe and Australia from 1981 to 2010. – J. Agron. 498
Crop Sci. 201: 57-68. 499
Grace, J. B. et al. 2016. Integrative modeling reveals mechanisms linking productivity and plant 500
species richness. – Nature 529: 390-393. 501
Graham, M. H. et al. 2007. Global ecology of the giant kelp Macrocystis: from ecotypes to 502
ecosystems. – Oceanography and Marine Biology: Annual Review 45: 39-88. 503
Guo, Q. et al. 2012. Spatial variations in aboveground net primary productivity along a climate 504
gradient in Eurasian temperate grassland: effects of mean annual precipitation and its 505
seasonal distribution. – Global Change Biology 18: 3624-3631. 506
Heck, K. L. Jr. et al. 2003. Critical evaluation of the nursery role hypothesis for seagrass 507
meadows. – Mar. Ecol. Prog. Ser. 253: 123-136. 508
Herbert, D. A. and Fourqurean, J. W. 2009. Phosphorus availability and salinity control 509
productivity and demography of the seagrass Thalassia testudinum in Florida Bay. – 510
Estuaries and Coasts 32: 188-201. 511
Hughes, A. R. et al. 2004. Relative effects of grazers and nutrients on seagrasses: a meta-analysis 512
approach. – Mar. Ecol. Prog. Ser. 282: 87-99. 513
Hughes, A. R. et al. 2009. Morphological and physiological variation among seagrass (Zostera 514
marina) genotypes. – Oecologia 159: 725-733. 515
Hughes, A. R. and Stachowicz, J. J. 2011. Seagrass genotypic diversity increases disturbance 516
response via complementarity and dominance. – J. Ecol. 99: 445-453. 517
Kattge, J. et al. 2011. TRY – a global database of plant traits. – Global Change Biology 17: 518
2905-2935. 519
Keddy, C. J. 1987. Reproduction of annual eelgrass: variation among habitats and comparison 520
with perennial eelgrass (Zostera marina L.). – Aquat. Bot. 27: 243-256. 521
Kirwan, M. T. et al. 2009. Latitudinal trends in Spartina alterniflora productivity and the 522
response of coastal marshes to global change. – Global Change Biology 15: 1982-1989. 523
Knapp, A. K. and Smith, M. D. 2001. Variation among biomes in temporal dynamics of 524
aboveground primary production. – Science 291: 481-484. 525
Koch, E. W. 2001. Beyond light: physical, geological, and geochemical parameters as possible 526
submersed aquatic vegetation habitat requirements. Estuaries 24:1-17 527
Lee, K. S. et al. 2007. Effects of irradiance, temperature, and nutrients on growth dynamics of 528
seagrasses: a review. – J. Exp. Mar. Biol. Ecol. 350: 144-175. 529
Legendre, P. 2015. Package ‘lmodel2’. https://CRAN.R-project.org/package=lmodel2 530
McNaughton, S. J. et al. 1983. Plant adaptation in an ecosystem context: effects of defoliation, 531
nitrogen, and water on growth of an African C4 sedge. – Ecology 64: 307-318. 532
Meiri, S. and Dayan, T. 2003. On the validity of Bergmann’s rule. – J. Biogeogr. 30: 331-351. 533
Moksnes, P.-O. et al. 2008. Trophic cascades in a temperate seagrass community. – Oikos 117: 534
763–777. 535
Mousseau, T. A. 1997. Ectotherms follow the converse to Bergmann’s rule. – Evolution 51: 630-536
632. 537
Neckles, H. A. et al. 1993. Relative effects of nutrient enrichment and grazing on epiphyte-538
macrophyte (Zostera marina L.) dynamics. – Oecologia 93: 285–295. 539
Niklas, K. J. and Enquist, B. J. 2001. Invariant scaling relationships for interspecific plant 540
biomass production rates and body size. – Proc. Nat. Acad. Sci. USA 98: 2922-2927. 541
Olesen, B. et al. 2015. Eelgrass Zostera marina in subarctic Greenland: dense meadows with 542
slow biomass turnover in cold waters. – Mar. Ecol. Prog. Ser. 518: 107-212. 543
Olsen, J. L. et al. 2004. North Atlantic phylogeography and large-scale population differentiation 544
of the seagrass Zostera marina L. – Molecular Ecology 13: 1923-1941. 545
Orth, R. J. et al. 2006. A global crisis for seagrass ecosystems. – Bioscience 56: 987-996. 546
Östman, Ö. et al. 2016. Top-down control as important as nutrient enrichment for eutrophication 547
effects in North Atlantic coastal ecosystems. – J. Appl. Ecol. 53: 1138-1147. 548
Pinheiro, J. et al. 2016. nlme: Linear and Nonlinear Mixed Effects Models. R package version 549
3.1-128, http://CRAN.R-project.org/package=nlme. 550
Pommerening, A. and Muszta, A. 2016. Relative plant growth revisited: Towards a mathematical 551
standardisation of separate approaches. – Ecological Modelling 320: 383-392. 552
Procaccini, G. et al. 2007. Contribution of genetics and genomics to seagrass biology and 553
conservation. – J. Exp. Mar. Biol. Ecol. 350: 234-259. 554
R Core Team. 2015. R: A Language and Environment for Statistical Computing. R Foundation 555
for Statistical Computing, Vienna, Austria. 556
Rehfeldt, G.E. et al. 2002. Intraspecific responses to climate in Pinus sylvestris. – Global Change 557
Biology 8: 912-929. 558
Reynolds, P. L. et al. 2014. Field experimental evidence that mesograzers mediate transition 559
between microalgal and seagrass dominance. – Limnol. Oceanogr. 59: 1053-1064. 560
Ruesink, J. L. et al. 2012. Life history and morphological shifts in an intertidal seagrass 561
following multiple disturbances. – J. Exp. Mar. Biol. Ecol. 424-425: 25-31. 562
Ruesink, J.L. 2016. Epiphyte load and seagrass performance are decoupled in an estuary with 563
low eutrophication risk. – J. Exp. Mar. Biol. Ecol. 481:1-8. 564
Ruesink, J. L. et al. 2017. Data from: Form-function relationships in a marine foundation species 565
depend on scale: a shoot to global perspective from a distributed ecological experiment. – 566
Oikos XX: XXX. doi:XXX 567
Salo, T. et al. 2014. Population specific salinity tolerance in eelgrass (Zostera marina). – J. Exp. 568
Mar. Biol. Ecol. 461: 425-429. 569
Sheridan, J. A. and Bickford, D. 2011. Shrinking body size as an ecological response to climate 570
change. – Nature Climate Change 1: 401-406. 571
Short, F. T. and Short, C. A. 2003. The seagrasses of the western North Atlantic. Pages 207-215 572
in World Atlas of Seagrasses (eds E.P. Green and F.T. Short). Prepared by the UNEP 573
World Conservation Monitoring Centre, University of California Press, Berkeley, USA. 574
Smith, R, J. 2009. Use and misuse of the reduced major axis for line-fitting. – Amer. J. Phys. 575
Anthr. 140: 476-486. 576
Starko, S. and Martone, P. T. 2016. An empirical test of ‘universal’ biomass scaling relationships 577
in kelps: evidence of convergence with seed plants. – New Phytologist 212: 719-729. 578
Suding, K. E. et al. 2008. Scaling evnrionmental change through the community-level: a trait-579
based response-and-effect framework for plants. – Global Change Biology 14: 1125-580
1140. 581
Tilman, D. et al. 2004. Does metabolic theory apply to community ecology? It's a matter of 582
scale. – Ecology 85: 1797-1799. 583
Valentine, J. F. et al. 1997. Experimental evidence that herbivory can increase shoot density in a 584
subtropical turtlegrass (Thalassia testudinum) meadow. – Oecologia 112: 193-200. 585
Wall, D. H. et al. 2008. Global decomposition experiment shows soil animal impacts on 586
decomposition are climate-dependent. – Global Change Biology 14: 2661-2677. 587
Winters, G. et al. 2011. Effects of a simulated heat wave on photophysiology and gene 588
expression of high- and low-latitude populations of Zostera marina. – Mar. Ecol. Prog. 589
Ser. 435: 83-95. 590
Yang, S. et al. 2013. Relative impacts of natural stressors on life history traits underlying 591
resilience of intertidal eelgrass (Zostera marina L.). – Estuaries and Coasts 36: 1006-592
1013. 593
594
Supplementary material (Appendix oik.XXXXX at <www.oikosjournal.org/readers/appendix>). 595
Appendix 1-4. 596
Table 1. Standardized coefficients for top models relating eelgrass (Zostera marina) biometrics 597
to nine predictor variables. Coefficients are provided for variables that appear in each model, 598
with models ranked by AICc, and accordingly from model with most to least weight. Models 599
with weight <0.02 are not shown. 600 Tida l ampli tude Tota l m ac rophy te cove r P hotoper iod Mini mum de pth Epip hyte loa d Ge notypi c ric hne ss %N Sali nit y T emper atur e AI C c Mode l wt
Response variable = Sheath length (mm), Intercept =156.3
176.0 0.108 48.77 176.3 0.089 45.74 176.7 0.073 38.60 177.5 0.050 43.92 40.47 178.0 0.039 31.03 178.1 0.036 -30.72 178.2 0.036 54.12 -38.27 178.3 0.034 27.69 178.4 0.032 -18.95 178.9 0.025 16.55 179.0 0.024 13.92 179.0 0.023 29.61 47.90 179.1 0.022
Response variable = Relative growth rate (% d-1), Intercept = 1.651
0.279 21.8 0.131 0.356 -0.214 22.0 0.121 0.205 0.360 22.5 0.095 0.240 -0.169 23.3 0.062 23.9 0.045 -0.225 23.9 0.045 -0.103 0.296 24.9 0.027 0.150 0.398 -0.166 25.0 0.027 601 602 603
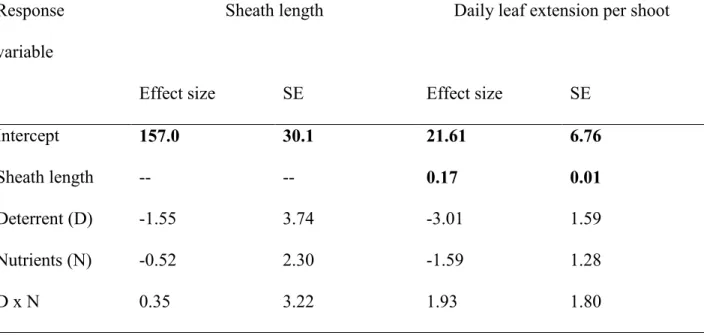
Table 2. Results of linear mixed-effects models examining size and growth of eelgrass (Zostera 604
marina) at 14 sites in summer 2011, with respect to experimental treatments of crustacean 605
mesograzer deterrent and water column nutrient addition. Sheath length was included as a 606
covariate of daily leaf extension, e.g. Fig. 2B. Total samples = 856. Bold is significant at =0.05. 607
Response variable
Sheath length Daily leaf extension per shoot
Effect size SE Effect size SE
Intercept 157.0 30.1 21.61 6.76 Sheath length -- -- 0.17 0.01 Deterrent (D) -1.55 3.74 -3.01 1.59 Nutrients (N) -0.52 2.30 -1.59 1.28 D x N 0.35 3.22 1.93 1.80 608 609
610
611
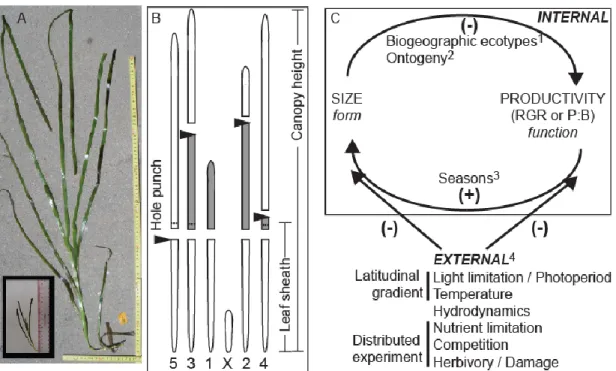
Figure 1. Eelgrass (Zostera marina) (A) ecotypes, (B) schematic representation of form and 612
function traits, and (C) internal and external controls on form and function. Larger shoot was 613
collected from Southern Japan (JS), smaller shoot from Virginia (VA), shown at same scale. The 614
traits in panel (B) are shown for one eelgrass shoot with five intact leaves, separated in order 615
from the enclosing leaf sheath. Grey represents leaf extension between marking and collecting. 616
Distal leaf material in white is greater when shoots retain more intact leaves, used to calculate 617
leaf condition. Superscripts in panel (C) refer to supporting citations: 1Enquist et al. 1999, 618
2Pommerening and Muszta 2016, 3Gaeckle et al. 2006, 4Koch et al. 2001, Lee et al. 2007, Yang 619
et al. 2013. RGR = relative growth rate; P:B = production per biomass 620
621 622
623
Figure 2. (A) Fourteen sites in the Zostera Experimental Network sampled for (B) size and (C) 624
relative growth rate of eelgrass (Zostera marina) in summer 2011. Site codes and information 625
provided in Supplementary Material Appendix 1 Tables A1-A3. 626
628
629
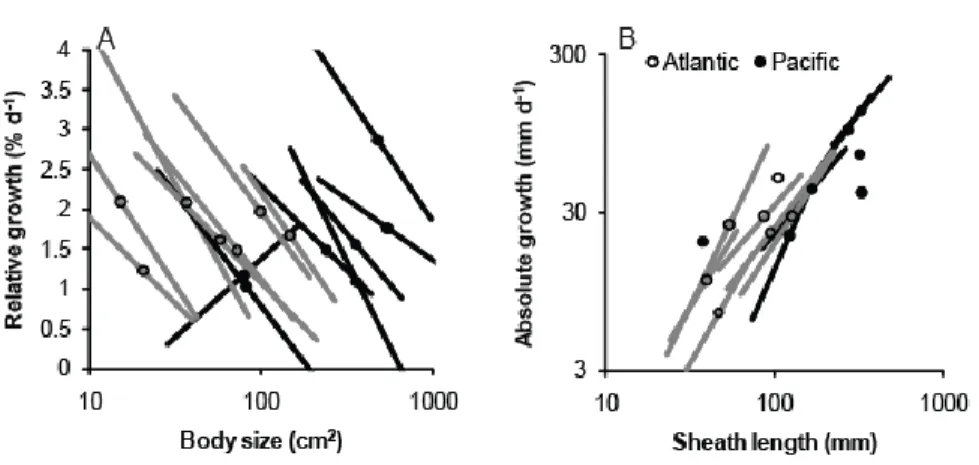
Figure 3. Form-function relationships of eelgrass (Zostera marina) in summer 2011 across 14 630
sites in the northern hemisphere. (A) Productivity as a function of body size. (B) Leaf extension 631
as a function of sheath length. Lines show reduced major axis fit at each site individually (N=32-632
178 shoots measured per site), with a point at each site mean. Panel (B) shows means without 633
slopes at four sites where AGR and size were uncorrelated. Regression statistics are provided in 634
Supplementary Material Appendix 3 Table A5. 635
637
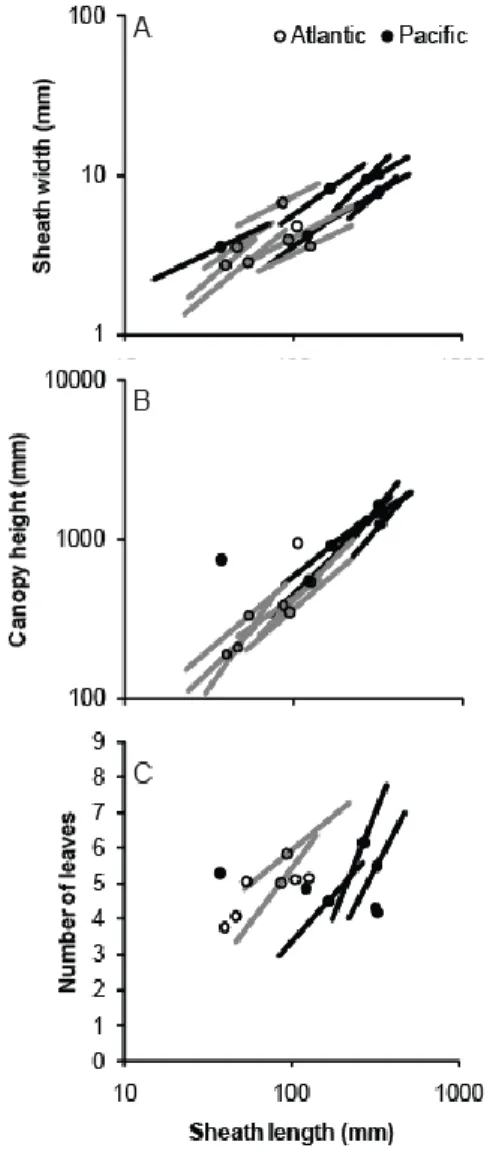
Figure 4. Allometric relationships among traits of eelgrass (Zostera marina) within and across 14 638
globally-distributed sites in summer 2011. A) Sheath width, B) maximum length, and C) number 639
of leaves as a function of sheath length. Each point shows mean values at a site in the Atlantic 640
(open points, grey lines) or Pacific Ocean (black points and lines). Lines are included when sites 641
demonstrated significant correlation between variables and show the slopes from reduced major 642
axis regression. Regression statistics are provided in Supplementary Material Appendix 3 Table 643
A5. 644 645
-2 -1 0 1 2 3 4 5 6 Sheath
length Epiphyte load contentLeaf N conditionLeaf
S ta n d a rd ize d e ff e c t s ize (+ 9 5 % C I) 646
Figure 5. Response of eelgrass (Zostera marina) growth to three stressors. Growth was based on 647
daily leaf extension per shoot, with sheath length as a covariate, e.g., Fig. 3B. Standardized effect 648
size shows mean effect size of each stressor divided by standard error, based on linear models 649
from 13 sites (Supplementary Material Appendix 4 Table A7), then combined for global mean 650
and 95% confidence interval. Stressors were considered continuous variables across Z. marina 651
shoots in 40 plots per site. Epiphyte load is defined as chlorophyll-a g per gDW Z. marina. 652
Nitrogen limitation declines with % nitrogen in Z. marina leaves. Increased leaf condition 653
indicates less damage. 654