HAL Id: hal-01742998
https://hal-mines-albi.archives-ouvertes.fr/hal-01742998
Submitted on 17 Apr 2018
HAL is a multi-disciplinary open access
archive for the deposit and dissemination of sci-entific research documents, whether they are pub-lished or not. The documents may come from teaching and research institutions in France or abroad, or from public or private research centers.
L’archive ouverte pluridisciplinaire HAL, est destinée au dépôt et à la diffusion de documents scientifiques de niveau recherche, publiés ou non, émanant des établissements d’enseignement et de recherche français ou étrangers, des laboratoires publics ou privés.
role of the oxygenated sites on the char surface
Marion Ducousso, Elsa Weiss-Hortala, Marco J. Castaldi, Ange Nzihou
To cite this version:
Marion Ducousso, Elsa Weiss-Hortala, Marco J. Castaldi, Ange Nzihou. Char as catalyst for hot gas cleaning and upgrading : role of the oxygenated sites on the char surface. WasteEng 2014 -5th International Conference on Engineering for Waste and Biomass Valorisation, Aug 2014, Rio de Janeiro, Brazil. p.713-724. �hal-01742998�
CHAR AS CATALYST FOR HOT GAS CLEANING AND UPGRADING:
ROLE OF THE OXYGENATED SITES ON THE CHAR SURFACE
M. DUCOUSSO1,* E. WEISS-HORTALA1,, M.J. CASTALDI2 and A. NZIHOU1 1 Université de Toulouse ; Mines Albi ; CNRS; Centre RAPSODEE, Albi, France. 2
Chemical Engineering Department, The City College of New York, New York City, USA.
Keywords: char, catalyst, Temperature Program Desorption, methane cracking, oxygenation
Abstract
Some recent researches have investigated the use of char in catalytic applications of hydrocarbons cracking [1]. Up to now textural properties as surface area, porosity and presence of minerals on its surface have been the main explanations of the catalytic performances of the chars. However literature and methane cracking tests have highlighted that oxygenated groups may play a role [2]. The goal of this study is to investigate the oxygenation of the char surface in terms of selectivity and efficiency. Then the catalytic performances of the functionalized chars will be evaluated through methane cracking tests. The oxygenation process has been done at 280°C for different duration times (1h, 2h, 4h, and 8h) under a 45 mL/min flow rate of a mixture composed of 8% O2 / 92% N2. Raw chars and
oxygenated chars have been analysed by FTIR and TPD. Methane cracking experiments have been carried out at 700°C over a bed of raw chars and oxygenated chars in a Chembet Instrument. The output gas has been analyzed continuously during the experiments via a micro-GC.
The O2 gas phase oxygenation process has shown good results since the global amount of
oxygenated groups at the surface has been enhanced. In particular groups such as anhydride, ether, phenol and lactone groups have been increased. The longest the oxygenation process was, the highest amount of oxygenated groups has been added. Thus it emphasizes that a functionalization of the char surface using a mixture of 8% O2 / 92% N2 is possible. First
results of methane cracking confirmed the catalytic performances of chars since methane decomposed to hydrogen at a lower temperature than that for regular cracking. The efficiency is evaluated as regards to hydrogen production and the impact of oxygenated groups. However methane cracking experiments conducted on chars oxygenated did not lead to a clear increase in the hydrogen production. Oxygenated groups which have been increased seem to have been desorbed before reaching the temperature of methane cracking. Further investigation on the impact of the oxygenation on the textural properties need to be carried out.
1
1- INTRODUCTION
The development of biomass gasifiers at the industrial scale is slowed down due to scientific and technological bottlenecks. During the gasification process to obtain syngas some co-products are formed due to the pyrolysis of the lignocellulosic materials which causes decrease in the syngas yield and lead to additional clean up costly steps. At gasification temperature (ca. 700 to 900°C) all co-products are in their gaseous forms while downstream the reactor some co-products called tars start to condense which leads to fouling and blocking process equipments as turbines and engines [3]. Non negligible part of the gas phase is also contaminated by co-products and pollutants. Main products are carbon dioxide, methane, non-condensible tars which may contribute up to 20% of the volatile material [4]. In a small extent pollutants as nitric or sulphur oxides are also present. A big effort has already been done to solve the issue of hot gas cleaning and two different ways have been developed. It can be achieved either by preventing their formation (primary treatment), or by their destruction in another step (secondary treatment). Unfortunately, when primary methods are successful, the amount of syngas produced is comparatively small [4]. For secondary treatment, several methods could be used as thermal, mechanical (cyclone, ceramic filter or scrubber) or catalytic cracking. In the case of catalytic secondary treatment three broad groups were identified: dolomite catalysts; alkali metal and other metal catalysts; and nickel catalysts. These mineral and metal catalyst have been selected because they are successful in transforming tars into fixed gases. Yung et. al state: “The main limitation for hot gas catalytic tar cracking is catalyst deactivation. Deactivation occurs from both physical and chemical processes associated with the harsh reaction conditions and impurities in the feed stream. Attrition, coking, and sulfur poisoning are the primary deactivation mechanisms that affect the efficient catalytic conditioning of biomass-derived syngas”[5]. Metal catalysts are expensive materials and their quick deactivation is a big issue for the economic viability of the process gasification.
An alternative process has been recently investigated. It consists in using chars which is the solid residue from biomass gasification as catalyst for hot gas cleaning. Chars are a very good candidate as it is a cheap and an onsite feedstock. Previous investigations have highlighted its catalytic performances for hydrocarbons degradation [6], [7]. Its high surface area and porosity are considered to be important factors of its catalytic efficiency. Minerals and metals such as calcium, iron are naturally present in chars, they may be active sites for hydrocarbons cracking. However literature stated that the cracking mechanism at the char surface is really complex and different active sites may compete as metals, oxygen atoms and defect in the carbon matrix.
Extensive use of char as catalyst for catalytic applications need to first understand the role of the different active sites at the char surface and be able to enhance their amount when it is needed. This study focuses on the oxygenated groups. The first objective is to investigate a process to oxygenate the char surface and evaluated the impact on the oxygenated groups.
2
Then catalytic performances of raw and oxygenated chars will be evaluated. Methane cracking has been chosen because it is the main co-product in the gas phase with carbon dioxide. Moreover its cracking leads to upgrade the syngas ratio. Firstly, a parametric study has been performed on raw chars. The impact of temperature, methane concentration, mass of chars and total flow rate have been investigated. From these results kinetics parameters have been determined. Then the influence of oxygen groups on the methane cracking yield, selectivity and deactivation has been studied.
2- MATERIALS AND METHODS
Generation of chars:
Char has been produced in a fluidized bed. Approximately 65 g of poplar wood have been gasified at 750°C during 30 minutes into a 90% H2O / 10% N2 mixture atmosphere of 1.5
m3/h biomass. Then particles have been crushed and their diameter size is in the range 100 to 500 μm.
Methane cracking experiments:
Methane cracking experiments have been carried out in a ChemBet Pulsar Instrument coupled with an Inficon micro Gas Chromatograph. A first set of experiments have been carried out only on raw chars to perform a parametric study. Four parameters have been studied: temperature (650, 700 and 800°C), mass of char (20, 50 and 100 mg), methane concentration (7, 15 and 21%) and flow rate (15 and 45 mL/min). A second set consisted in comparing methane cracking experiments on raw char and chars which have been oxygenated.
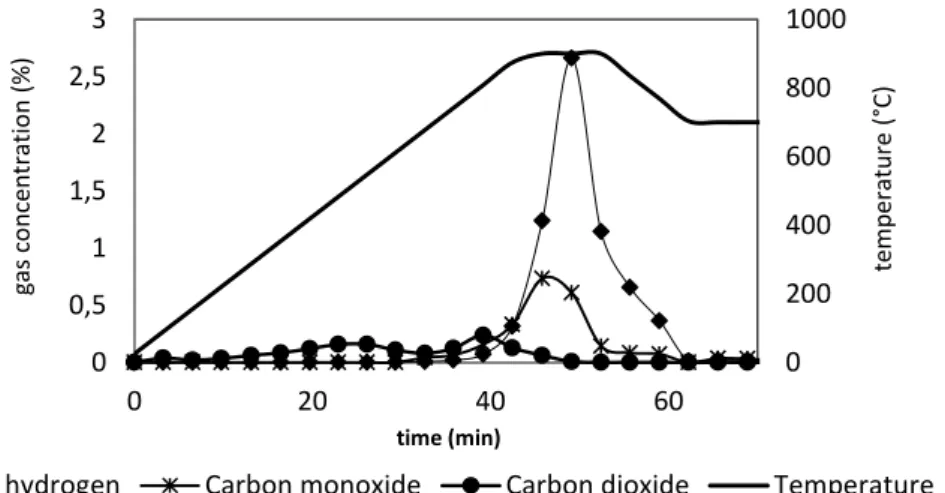
Prior reaction chars have been degassed up to 900°C with a heating rate of 20°C/min. Degassing has been done before introduction of the methane to be sure that all the hydrogen observed during the reaction is coming from methane cracking and not from desorption of the surface cause by heat treatment. Figure 1 shows that hydrogen and carbon monoxide desorbed from the surface from 700°C to 900°C during the degassing.
Figure 1: Gas desorption during the ramp temperature to 900°C with a heating rate of 20°C/min under pure nitrogen prior methane cracking reaction at 700°C
0 200 400 600 800 1000 0 0,5 1 1,5 2 2,5 3 0 20 40 60 te mp erat u re ( °C) gas c o n ce n tr ati o n ( % ) time (min)
3
Methane cracking experiments used for the comparison between raw char and oxygenated char have been performed at 700°C and the degassing has been done under nitrogen up to 700°C with an heating rate of 20°C/min.
Char oxygenation process:
100 mg of chars have been oxygenated in the ChemBet Pulsar reactor under a mixture 8% O2
/ 92% N2 and a flow rate of 45 ml/min during different extent.
Chars surface analyses:
TPD: TPD of 50 mg of raw char and oxygenated chars have been performed in the ChemBet
Pulsar instrument under a 25 mL/min of helium from 25°C to 1100°C with a temperature rate of 5°C/min.
FTIR: FTIR analyses have been done one raw char and char oxygenated on a Shimadzu FTIR
8400 s.
BET: BET analyses have been done on a ASAP 2010 apparatus from Micromeritics.
Adsorption of argon has been monitored at 77 K until a relative pressure of 1. Prior argon adsorption a degassing step of 30 h under high vacuum at 200°C has been performed. Specific surface area has been determined by application of the BET and Langmuir models. Pore size and pore volume have been evaluated using the Horvath-Kawazoe model.
Kinetics parameters calculations:
Apparent initial partial order of reaction regarding methane and initial apparent activation energy have been calculated. Methane has supposed to be decomposed into carbon solid and hydrogen following the reaction (1). From this equation initial reaction rate could be written in Equation (2). To obtain the reaction rate constant and be able to determine the activation energy the differential method has been applied. The magnitudes of partial pressure of methane were 7%, 15% and 21%. A mass balance on the plug flow reactor allows the determination of the reaction rate for the different partial pressures (see Equation 3). The activation energy was calculated following the Arrhenius law (Equation 4).
Methane cracking reaction equation:
( ) ( ) ( ) (1)
Reaction rate equation:
(2)
Mass balance on the differential plug flow reactor:
4 Arrhenius law: (4) ( ( )) ( ) (mol/ m3) (mol/s) (m3) (kJ/mol)
3- RESULTS AND DISCUSSION
The study concerns the use of char either or not functionalized as catalyst for methane cracking. However the efficiency is evaluated as regards to hydrogen production and the impact of oxygenated groups. The results are presented under both points of view.
3.1 Methane cracking on raw char
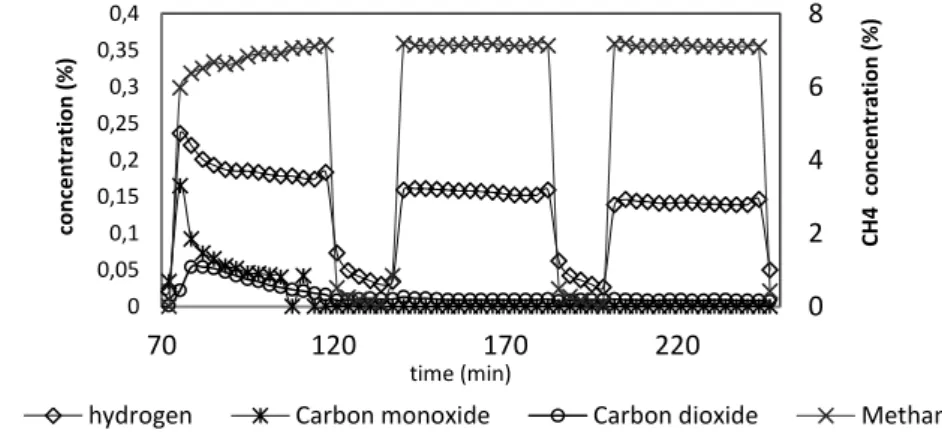
Methane cracking experiments under various operating conditions have been performed. Figure 2 shows measurements of gases concentration over time downstream the reactor during experiments. Hydrogen is the main product from the methane cracking according to reaction (1). This is in good agreement with the literature [8], [9]. Hydrogen production becomes smaller over the reaction. This decrease could be due to catalyst deactivation related to a decrease of the active surface. Pore blocking by carbon deposit are supposed to be the main cause of catalyst deactivation [1]. Indeed, our chars are microporous materials with a high BET surface area of ca. 550 m2/g compare to some activated carbons. Their surface area have been measured after methane cracking experiments and the results highlighted that they have been halved [6]. The lower active surface area would explain the decrease in hydrogen production.
Figure 2: Gas production during methane cracking experiment over a bed of chars at 700°C, under 15 mL/min of 7% CH4/93% N2 0 2 4 6 8 0 0,05 0,1 0,15 0,2 0,25 0,3 0,35 0,4 70 120 170 220 C H 4 conce nt rat ion (% ) conce nt rat ion (% ) time (min)
5
Kim et al. [10] also investigated methane cracking over several carbon based materials as activated carbons and coals. Surface areas of these catalysts have been correlated to initial reaction rate. Thus, the reaction at the surface is the limitative step of the process. Even if results have shown that pore blocking is happening during the reaction they stated that there is not a clear correlation between the deactivation and the surface area evolution. Moliner et al. [2] have done a similar study on activated carbons and lead to the same conclusion. These previous results have highlighted that textural properties of chars have been modified during methane cracking experiments and should play a role. However surface chemistry needs to be investigated to get better insight into the mechanism.
3.2 Surface chemistry of chars related to kinetics of methane cracking
Surface chemistry of the chars is complex as it is a natural material and its structure is completely dependent of the environmental conditions of the wood development. However results obtained during methane cracking revealed an interesting fact. Some carbon monoxide and carbon dioxide have been produced at the early stage of methane cracking experiments. As record the char has been previously degassed and no CO or CO2 have been analysed in the
previous chromatograph at 700°C prior experiments which means that these two components are produced during the methane cracking reaction. Reactions (5), (6) and (7) might happen between carbon from methane and oxygen groups of the char surface:
( ) ( ) ( ) ( ) (5)
( ) ( ) ( ) ( ) (6)
( ) ( ) ( ) ( ) (7)
Kim et al. [10] stated that the methane cracking reaction rate at early stage was controlled by oxygen groups present on the activated carbons. This observation is interesting and our results are in agreement with this assessment. From the parametric study which has been done, the initial apparent kinetics parameters have been determined (see Figure 3). The initial apparent activation energy has been found to be ca. 192 kJ/mol which is close to values obtained for activated carbons obtained by Muradov et al. [8] (160-201 kJ/mol). These observations are interesting for different reasons. Firstly, it showed that oxygen groups at the char surface are potential active sites. Secondly, if they are active sites it could be guessed that increasing their contents may lead to increase the conversion of methane into hydrogen and carbon monoxide. So if carbon atoms from methane react with oxygen groups from the surface and release into the gas phase they will not deposited into the pores of the char which limits the catalyst deactivation. For all these reasons, further investigation of the role of oxygen groups on the char surface have been performed.
6
Figure 3: Determination of k0 and Ea from experimental points
3.3 Surface chemistry of chars: oxygenated functions
In order to study the role of the oxygenated groups on the char surface in the methane cracking reaction, methods to increase their content have been investigated. Various methods have been reported in the literature using either liquid or gas agents. The most common methods using liquid are the immersion into nitric acid (HNO3) and hydrogen peroxide
(H2O2). Oxygenation into gas phase could be operated using molecular oxygen, ozone, nitrous
oxide or steam. Klinghoffer et al. [6] have oxygenated chars by immersion into HNO3.
Comparison of TPD results for raw chars and oxygenated chars into these conditions showed that the carboxylic groups have been the most increased groups. However carboxylic groups desorbed at low temperature and they did not impact the methane cracking reaction. Pereira et al. [11] have tested different oxygenation processes onto activated carbon. He stated that liquid treatment tend to increase acidic oxygen groups and gas phase rather basic groups which release at high temperature. In our case chars have been oxygenated under 8% O2/ 92%
N2 at 280°C to different extent because we attend to increase oxygen groups which remain at
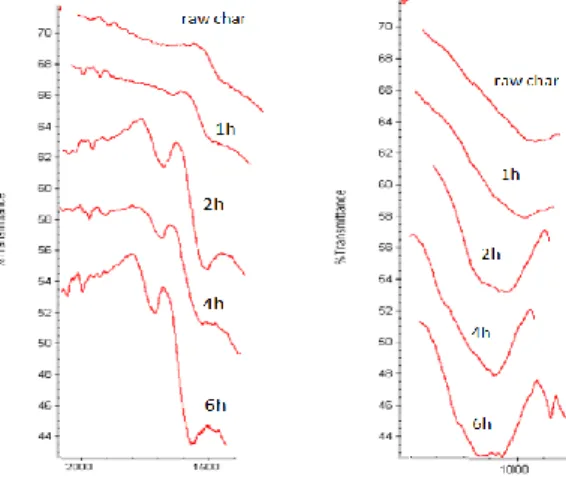
high temperature. FTIR analyses revealed that the process of oxygenation has been successful. It allowed the increase of C=O and C-O bondages (see Figure 4). The longest the oxygenation process is the highest the peaks are. However peaks assignments of the different double bonding oxygenated groups are very close and it is hard to make an accurate correlation between the peaks shown in FTIR and the nature of the group (see table 1).
Figure 4: comparison of the 1000-1300 and 1500-1900 region of FTIR results of raw and oxygenated chars
y = 0,939x + 3,443 R² = 0,998 2,0 2,5 3,0 3,5 4,0 4,5 -0,50 0,00 0,50 1,00 1,50 ln r0 ln CCH4
7
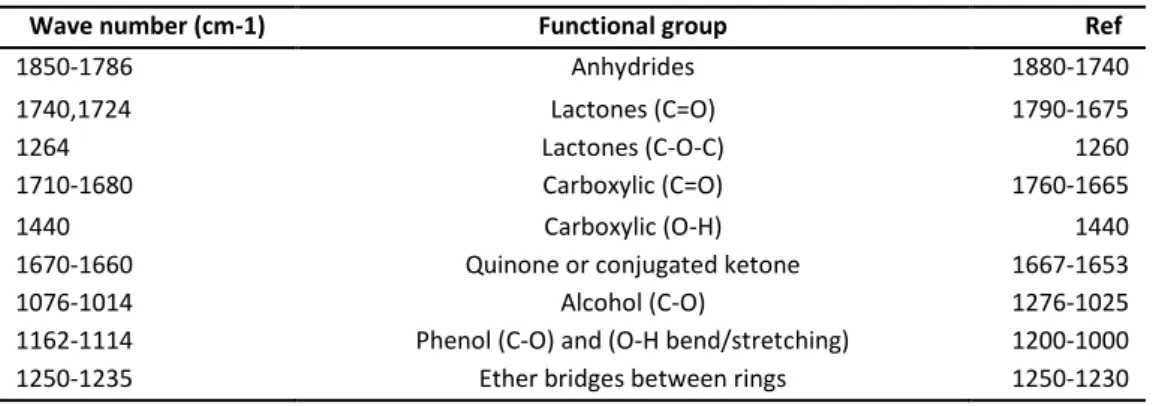
Table 1: Functional groups on active carbon and their corresponding infrared assignments
Wave number (cm-1) Functional group Ref
1850-1786 Anhydrides 1880-1740
1740,1724 Lactones (C=O) 1790-1675
1264 Lactones (C-O-C) 1260
1710-1680 Carboxylic (C=O) 1760-1665
1440 Carboxylic (O-H) 1440
1670-1660 Quinone or conjugated ketone 1667-1653
1076-1014 Alcohol (C-O) 1276-1025
1162-1114 Phenol (C-O) and (O-H bend/stretching) 1200-1000 1250-1235 Ether bridges between rings 1250-1230
TPD analysis gives complementary information as it is possible to correlate the amount of CO or CO2 desorbed at a given temperature under inert atmosphere to the functional groups
present at the char surface. In fact according the strength of the bonding the energy needed to break it varies. It means that oxygenated groups which have different kind of bondings will not desorb at the same temperature. Literature provides temperature range of desorption and type of gases desorbed according to the oxygenated groups (see Figure 5). Groups as carboxylic and lactone desorb into CO2 in a large range of temperature 100°C-400°C and
200°C-700°C respectively. Anhydrides decomposed into both CO and CO2 at about 650°C.
Phenol and ether desorb in the same range of temperature as anhydride but produced only CO. Then carbonyl and quinone decomposed into CO at temperature up to 800°C.
Figure 5: TPD Peak assignements [12]
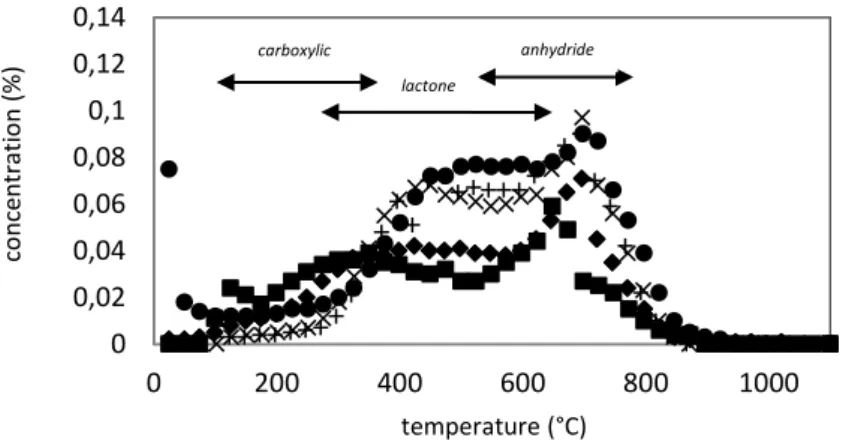
Results of TPD of raw chars and chars which have been oxygenated at 280°C for different durations (1h, 2h, 4h, 8h) are presented in Figure 6. This graph confirms the FTIR results. The longest was the oxygenation process, the highest the global amount of oxygenated groups had been enhanced. All oxygenated groups seem to have been impacted by the oxygenation process. However oxygenated groups which desorb in CO or/and CO2 in the temperature
range of 400-700°C might have been the most impacted. Figure 6.a) shows a comparison of CO2 production during TPD procedure for the raw chars and oxygenated chars. Before 400°C
chars which have been oxygenated desorbed less CO2 compare to raw chars. It could be
8
oxygenation which may lead to desorbing a part of carboxylic groups. Lactones may be one of the groups which have been the most enhanced. In fact concentration of CO2 desorbed by
raw chars is about 0.03% between 400°C and 600°C while it is ca. 0.06% and 0.08% for chars which have been oxygenated during 2h and 8h respectively. At a higher temperature anhydride starts desorbing into CO2 and CO. In the Figure 6.a) it might correspond to the
peak between 600°C and 800°C. Peak reaches 0.06% for raw char and 0.09% for char oxygenated at 280°C.
CO production is compared in the Figure 6.b) The impact of oxygenation on groups desorbing into CO is weaker than on those desorbing into CO2. No desorption is observed before 450°C
which is in accordance with the literature. Up to 800°C the process seems to have not impacted the oxygenated groups. However it is interesting to note that the longest is the oxygenation the soonest the CO desorption starts. Phenol is the first group desorbing into CO in the literature. Long oxygenation processes are favorable to phenol group formation at the char surface. Ether of which peak of desorption is around 650°C has also been enhanced. Then results of CO production confirms that anhydride have been increased at the char surface.
Figure 6: TPD results of raw chars and chars oxygenated at 280°C under a mixture of 8% O2/92% N2.
a) CO2 desorption; b) CO desorption
operating conditions for TPD : 25 mL/min He at 5°C/min to 1100°C
0 0,02 0,04 0,06 0,08 0,1 0,12 0,14 0 200 400 600 800 1000 co n ce n tr ati o n (% ) temperature (°C)
CO2_raw_char CO2_char_ox_1h CO2_char_2h CO2_char_ox_4h CO2_char_ox_8h
0 0,05 0,1 0,15 0,2 0,25 0,3 0 200 400 600 800 1000 co n ce n tr ati o n ( % ) temperature (°C)
CO_raw_char CO_char_ox_1h CO_char_ox_2h CO_char_ox_4h CO_char_ox_8h
carboxylic lactone anhydride phenol anhydride ether carbonyl quinone
9
Oxygenation of the char surface using a mixture of O2/N2 had successfully enhanced the
amount of oxygenated groups at the char surface. Clear impact of the duration time of the oxygenation is shown by TPD results. Then functionalization of the char surface by oxygen treatment is possible. Next paragraph will discuss preliminary results in term of catalytic application for the methane cracking.
3.4 Impact of oxygenated functions on methane cracking
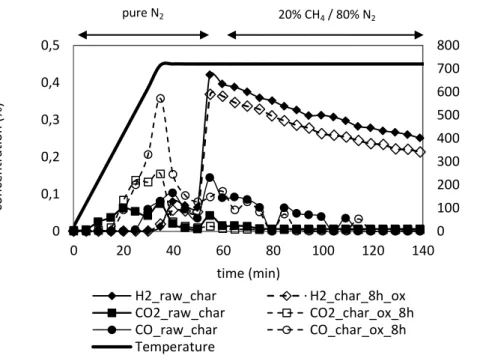
Chars oxygenated during 8h at 280°C and raw chars have been tested for methane cracking at 700°C. Results show that the hydrogen production was very similar in both cases. An explanation is that the oxygen process mainly increased species desorbing around 500°C to 750°C. On the Figure 7, it is observable that more CO2 and CO are desorbed during the ramp
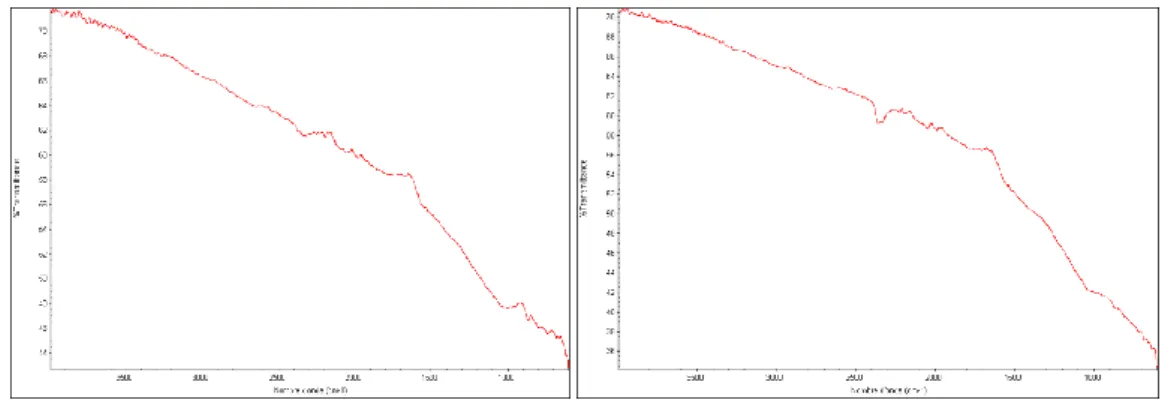
temperature under pure nitrogen for the oxygenated chars rather than for the raw chars. Then the oxygenated groups added during the oxygenation process have been desorbed before starting the methane cracking reaction. An FTIR analysis of a chars which has been oxygenated and then heated under pure nitrogen to 700°C is coherent with this conclusion. In fact no peaks in the 1000-1300 and 1500-1900 regions are observable (see Figure 8). However precautions have to be taken in discussing results as the oxygenation treatment may affected textural properties and carbon content of the chars.
Figure 7: Comparison of the hydrogen production during methane cracking at 700°C over a bed of raw chars and a bed of chars prior oxygenated at 280°C during 2h under 8% O2
0 100 200 300 400 500 600 700 800 0 0,1 0,2 0,3 0,4 0,5 0 20 40 60 80 100 120 140 tem p era tu re ( °C) con ce n tra tio n (% ) time (min) H2_raw_char H2_char_8h_ox CO2_raw_char CO2_char_ox_8h CO_raw_char CO_char_ox_8h Temperature pure N2 20% CH4 / 80% N2
10
Figure 8: FTIR analyses of raw chars on the left and chars after oxygenation treatment and then heating up to 700°C under pure nitrogen on the right.
4- CONCLUSIONS
The first goal of this study was to investigate the O2 gas phase oxygenation of the char
surface. Comparison of the CO and CO2 production during TPD results of raw and
oxygenated chars have shown that the oxygenation successfully increased the global amount of oxygenated groups. Anhydrides, lactones, phenols and ethers may have been enhanced in the greatest extent. The longest the oxygenation was the highest amount of oxygen atoms was added to the surface.
First results of methane cracking on oxygenated chars did not lead to conclude on the impact of the oxygenated groups on the hydrogen production as species enhanced by oxygenation process were not stable at the methane cracking temperature. In addition further analyses will be carried out to evaluate the impact of the oxygenation process on the textural properties of the chars. These complementary information will be useful regarding the interpretation of the methane cracking comparison.
REFERENCES
[1] N. B. Klinghoffer, M. J. Castaldi, and A. Nzihou, “Catalyst Properties and Catalytic Performance of Char from Biomass Gasification,” Ind. Eng. Chem. Res., Sep. 2012. [2] R. Moliner, I. Suelves, M. Lazaro, and O. Moreno, “Thermocatalytic decomposition of
methane over activated carbons: influence of textural properties and surface chemistry,” Int. J. Hydrogen Energy, vol. 30, no. 3, pp. 293–300, Mar. 2005.
[3] L. Devi, K. J. Ptasinski, R. H. Berends, N. Padban, J. Beesteheerde, and H. J. Veringa, “Primary measures to reduce tar formation in fluidised-bed biomass gasifiers,” no. March, 2004.
11
[4] A. Nzihou, B. Stanmore, and P. Sharrock, “A review of catalysts for the gasification of biomass char, with some reference to coal,” Energy, vol. 58, pp. 305–317, Sep. 2013. [5] M. M. Yung, W. S. Jablonski, and K. a. Magrini-Bair, “Review of Catalytic
Conditioning of Biomass-Derived Syngas,” Energy & Fuels, vol. 23, no. 4, pp. 1874– 1887, Apr. 2009.
[6] N. Klinghoffer, “Utilization of char from biomass gasification in catalytic applications Naomi Klingho ff er,” 2013.
[7] D. Wang, W. Yuan, and W. Ji, “Char and char-supported nickel catalysts for secondary syngas cleanup and conditioning,” Appl. Energy, vol. 88, no. 5, pp. 1656–1663, May 2011.
[8] N. Muradov, F. Smith, and A. T-Raissi, “Catalytic activity of carbons for methane decomposition reaction,” Catal. Today, vol. 102–103, pp. 225–233, May 2005.
[9] D. P. Serrano, J. a. Botas, J. L. G. Fierro, R. Guil-López, P. Pizarro, and G. Gómez, “Hydrogen production by methane decomposition: Origin of the catalytic activity of carbon materials,” Fuel, vol. 89, no. 6, pp. 1241–1248, Jun. 2010.
[10] M. Kim, “Hydrogen production by catalytic decomposition of methane over activated carbons: kinetic study,” Int. J. Hydrogen Energy, vol. 29, no. 2, pp. 187–193, Feb. 2004.
[11] J. L. Figueiredo, M. F. R. Pereira, M. M. A. Freitas, and J. J. M. Orfao, “Modification of the surface chemistry of activated carbons,” vol. 37, pp. 1379–1389, 1999.
[12] J. L. Figueiredo and M. F. R. Pereira, “The role of surface chemistry in catalysis with carbons,” Catal. Today, vol. 150, no. 1–2, pp. 2–7, Feb. 2010.