HAL Id: hal-01066677
https://hal.archives-ouvertes.fr/hal-01066677
Submitted on 22 Sep 2014HAL is a multi-disciplinary open access archive for the deposit and dissemination of sci-entific research documents, whether they are pub-lished or not. The documents may come from teaching and research institutions in France or abroad, or from public or private research centers.
L’archive ouverte pluridisciplinaire HAL, est destinée au dépôt et à la diffusion de documents scientifiques de niveau recherche, publiés ou non, émanant des établissements d’enseignement et de recherche français ou étrangers, des laboratoires publics ou privés.
spectroscopy
Yamina Ouabbas, Ana Cameirão, Jean-Michel Herri, Philippe Glénat
To cite this version:
Yamina Ouabbas, Ana Cameirão, Jean-Michel Herri, Philippe Glénat. On-line monitoring of methane hydrate crystallization process in water-in-oil emulsion using in situ ATR-FTIR spectroscopy. The 8th International Conference on Gas Hydrates, Jul 2014, Pékin, China. pp.T5-15. �hal-01066677�
ON-LINE MONITORING OF METHANE HYDRATE CRYSTALLIZATION
PROCESS IN WATER-IN-OIL EMULSION USING IN SITU ATR-FTIR
SPECTROSCOPY
Yamina OUABBAS*, Ana CAMEIRAO, , Jean-Michel HERRI
Gas Hydrate Dynamics Centre, Ecole Nationale Supérieure des Mines de Saint-Etienne, 158
Cours Fauriel, Saint-Etienne 42023, FRANCE
Philippe GLENAT
TOTAL S.A.
– CSTJF, Avenue Larribau, PAU Cedex 64018, FRANCE
ABSTRACTThe formation of gas hydrates in water-in-oil flowing emulsion was studied in a flow loop pilot at 80 bar and 1°C. The Archimede flow loop (30 m long, 1 cm diameter) has been built to reproduce the thermodynamic and hydrodynamic conditions encountered in pipelines. The crystallization of methane hydrate was investigated for two water contents (5%vol. and 30%vol.) in liquid Kerdane (C1-C14). The hydrate formation was determined from differential pressure drop and temperature measurements and gas consumption. During crystallization process, the time evolution of dissolved methane in liquid phase was obtained from spectroscopy measurements by using ATR-FTIR spectroscopy. Typical spectroscopic measurements are presented which open the possibility to monitor the methane concentration in oil phase. The signal is strongly affected by the presence of water and implies to convert the spectroscopic measurements into methane concentration from an appropriate calibration procedure. The PLS chemometric method based on multivariate data analysis method was applied in this study with success allowing to obtaining highly valuable information about the crystallization process.
Keywords: Gas hydrates, ATR-FTIR Spectroscopy, PLS modelling, Flow Assurance
NOMENCLATURE
dp depth of the evanescent wave [µm] wavelength of the radiation [µm]
n1 refractive indices of the crystal
n2 refractive index of the solution angle of incidence [rad]
Ctrye experimental concentration value [mol/L]
Cpred estimated concentration value [mol/L] Z gas compressibility factor
P gas pressure [MPa] T temperature [K]
n mole number of methane [mol]
η conversion rate[%]
n0 initial quantity of methane [mol]
mw initial mass of water [g]
Mw water molar mass [g.mol-1]
INTRODUCTION
Hydrate formation is a key problem for petroleum flow assurance in pipelines.
Gas hydrates are solid compounds made of gas molecules confined by water molecules, obtained in conditions of high pressure and low temperature. In the context of offshore oil production lines which frequently operate under high pressure and low temperature, formation of gas hydrates can cause severe production disruptions [1]. Because of the high costs of traditional methods to prevent the formation of hydrates, there is now an interest in developing technology not for preventing hydrates formation but for transporting and avoiding the formation of plugs.
To understand the formation and flow of hydrates in pipeline and to prevent the formation of plugs, many works were devoted to the study of hydrates formation and transport through rheological and flow properties characterization of gas hydrates suspensions [1, 2]. The formation of methane hydrate in water-in-oil emulsion was studied by us in the Archimede flow loop. This flow loop reproduces the thermodynamic and hydrodynamic conditions encountered in pipelines.
The Archimede flow loop is equipped with numerous probes, temperature, pressure drop and pressure probes. Also flow rate and density measurement can be made. It is also equipped with a focused beam reflectance measurements (FBRM) probe to monitor the chord length distribution of the emulsion and suspension with hydrates to study the crystallization and agglomeration [1, 3, 4] and an in-situ PVM (Particle Video Microscope) probe as detailed in this conference in [3].
In order to follow the concentration of methane in the emulsion an in situ attenuated total reflectance Fourier Transform InfraRed (ATR-FTIR) spectroscopy has been also added to the Archimede flow loop. The spectra’s were obtained during the dissolution of methane in a water-in-oil emulsion and during crystallization.
FTIR spectroscopy was reported as a promising technique for in situ measurement of supersaturation during solution crystallization because functional groups which are reacting or are produced during reaction show characteristic fingerprints in the IR spectrum [5, 6]. The approach was inspired by recent advancements in ATR-FTIR spectroscopy by way of various light transfer systems for remote sensing and by the increasing availability of ATR configurations well suited for remote, in situ measurements [5]. Over the last decade, there have been a number of applications of ATR-FTIR spectroscopy for in-process monitoring and control of solute concentration and supersaturation in bath cooling crystallization of inorganic and organic compounds. Appropriate calibration procedures are indispensable to the conversion of the spectroscopic measurements into useful and informative in-situ concentration predictions. The combination of this technique with other technologies such FBRM and PVM can provide a better understanding of crystallization flow [7, 8]. In this study, ATR-FTIR spectroscopy has been employed to measure liquid-phase composition in
situ. Quantitative procedure was applied by means of multivariate data analysis, so-called chemometric methods. Accurate concentration estimations were obtained and applicability of this approach was demonstrated through different experiments.
EXPERIMENTAL SECTION Materials
The organic liquid phase C1-C14 is delivered by TOTAL FLUIDES under commercial denomination Kerdane. As this oil does not present any natural emulsifying property, a chemical additive is added to the organic phase. The gas used is pure methane (99.99%) supplied by AIR LIQUIDE.
Experimental setup
The Archimede flow loop located at Ecole des
Mines de Saint-Etienne is composed by an
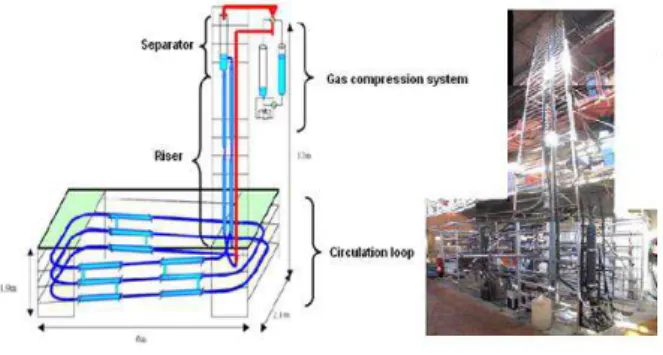
horizontal section of 30 meters and a riser of 12 m ending in a gas-liquid separator, presenting a total volume of 11.5 L. (Figure 1). Pressure and temperature are controlled in the range of 1 – 10 MPa, and 273 – 283K, respectively. Archimede flow loop is equipped with a Moineau Pump that keeps the flow rate at a constant value between 72L/h and 500L/h [1, 3].
Figure 1 : Archimede Flow loop installation
Spectroscopic measurements
Infrared spectra were collected using “Matrix-MF” FTIR spectrometer manufactured by Bruker Optics, equipped with ATR-Diamond immersion probe connected through optical fiber to the spectrometer. The ATR probe allows for exclusively liquid phase monitoring with a low penetration depth 2-3 µm [9]. That is why this technique allows the measurement of the solute concentration in the slurry without being too much disturbed by the solid particles, or disturbed in a
way that can be evaluated and taken into account [8].
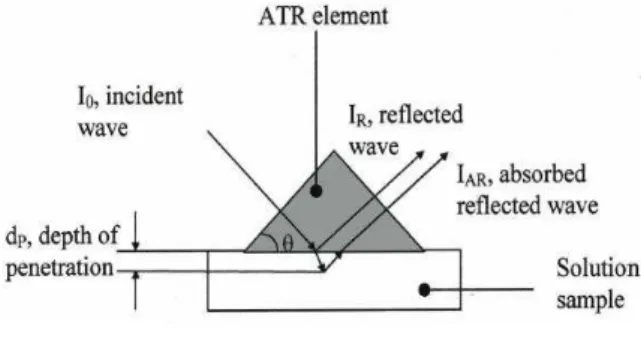
ATR-FTIR spectroscopy is based on the presence of an evanescent field in an optically rarer medium (the sample) in contact with an optically denser medium (the crystal) within which radiation is propagated due to internal reflection (Figure 2).
Figure 2 Principle of the ATR-FTIR sensor [8] The depth of penetration is given by equation 1, where is the wavelength of the incident radiation, n1 and n2 are, respectively, the refractive indices of the crystal (ATR-diamond) and of the solution, is the angle of incidence of the propagating radiation:
[ ⁄ ] ⁄
(1) Spectra were collected over a 3 min interval in the 600-4000 cm-1 wavenumber region with resolution
of 4 cm-1.
Experimental procedure
This work is divided into two parts, and for each one a set of experiences was carried out. We performed, respectively, methane solubility experiments and methane hydrates crystallization experiments. All experiments were made at constant flow rate of 250 L.h-1 in the Archimede
flow loop. The mass percentage of additive in the water is 0.5%.
The first step is the formation of the emulsion by mixing the Kerdane and the water with an Ultra-Turrax® at 8000 rpm during 3 minute before loading the loop. After the emulsion is cooled down. Once the temperature target of 277K is reached, the methane is rapidly injected up to 8 MPa and the infrared spectra acquisition is turned on. Then the gas dissolution in the oil phase induces a pressure decrease, compensated with a second (for crystallization experiment) or more
(for solubility experiment) gas injections up to 8 MPa [1].
A preliminary calibration model for in situ concentration predictions is necessary prior to proceed to crystallization process. We performed solubility experiments, with a single phase (Kerdane oil) or an emulsion at three different water contents (5%vol., 10%vol., and 30%vol.).
Figure 3 Time evolutions of pressure and temperature during a solubility experience The set of calibration data was obtained as follows: the methane is injected several times during the experiments, usually, 4 to 5 times as shown in Figure 3. At each plateau corresponding to a complete saturation of methane in oil phase, ATR-FTIR spectra were recorded.
To avoid the effect of the high water absorbance on the spectral measurements (or the absorbance of Kerdane oil) that can make it difficult to identify infrared bands of methane, the background spectrum has been recorded, before gas injection, in each emulsion (or in oil as single phase).
The quantity of methane (or concentration in oil phase Ctrue (mol/L), used for calibration procedure) that has been dissolved in the liquid is calculated from a mass balance from gas phase. During dissolution, the flow loop is considered as a closed system. For a pure gas, here methane, we determine the mole number in gas phase from the equation of state in equation 2:
(2)
Where Z, is gas compressibility factor, n is the number of moles of methane gas, P the pressure, and T the temperature. The compressibility factor is given by the following correlation [13]:
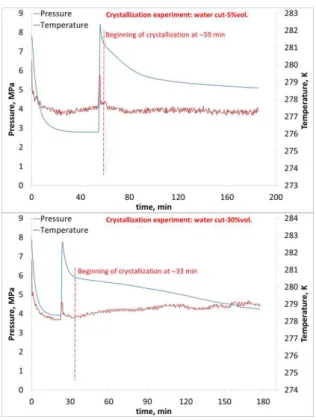
During the crystallization experiments at two water contents (5%vol. and 30%vol.), the methane gas is injected twice up to 8 MPa. After the first injection, the pressure decrease is compensated with a second injection. Then the pressure decreases until a constant value; the beginning of crystallization is accompanied by a sudden temperature increase and a pressure decrease (Figure 4).
Figure 4 Time evolutions of pressure and temperature during a crystallization experience A first set of infrared spectra were recorded after the first injection of methane at solubility equilibrium (the first plateau). The ATR-FTIR acquisition was stopped during the second methane injection and restarted after that.
The conversion has been determined and compared to the evolution of methane concentration during crystallization. To calculate the water conversion, the stoichiometry of the methane hydrate is fixed by equation 3. Thus the conversion is calculated by equation 4.
CH4(g) + 5.75H2O(l)→ CH45.75H2O(s) (3)
⁄ (4)
MULTIVARIATE DATA ANALYSIS
Quantitative application of any kind of measurement technique requires a model to relate the measured (dependent) variables, i.e., absorbance at different wavenumbers, to the independent variables, i.e., concentration. In spectroscopy, a relationship between a peak height or peak area and concentration is usually applied. However, this univariate approach does not always meet the accuracy and robustness that can be achieved by using a broader range of the measured spectra when a multivariate approach is applied [9].
There is a variety of calibration methods for correlating the physical and chemical variables to ATR-FTIR spectral data, such as Partial Least Squares (PLS) and Principal Component Regression (PCR). These advanced statistical methods enable quantitative measurements to be made for simultaneous monitoring of several chemical species, and under a wide range of operating conditions [10]. In this study a PLS model was built up to describe and monitor crystallization process. This multivariate method is well presented in the literature [7, 9, and 11]. Before construction of a multivariate model, spectra can be processed in order to remove unwanted variation in the data, i.e., shifting baselines in the spectra, hence improving the model performance. Preprocessing techniques range from smoothing, baseline corrections, to taken derivatives. A variety of preprocessing method was used in this study to optimize the calibration model; among them are linear baseline correction and spectral normalization.
To validate calibration model using PLS regression method, a cross-validation method was used. During cross-validation, parts of the calibration set are left out of the calculations and kept separately. The model is built using a certain number of spectra and applied to estimate the subset of samples that was left out. It is more reasonable to use the root mean square error of estimation (or calibration) (RMSEE, Eq. 5) to evaluate appropriateness of multivariate modeling (PLS regression) and the root mean square error of cross-validation (RMSECV) or of prediction (RMSEP, Eq. 6) to evaluate the performance of the calibration model [12].
√∑ ( )
√ ∑ ( )
(6)
Where N is the number of samples R is the number of PLS vector, Ctrue is experimental concentration value (equation 4), and Cpred is the value estimated by the model.
RESULTS AND DISCUSSIONS Calibration results
The calibration model was made only with infrared spectra recorded during solubility experiments. Results achieved by applying this model to spectral data of crystallization experiments have not been satisfactory. To improve the calibration model the spectral data obtained during the first step of crystallization experiments have been added to the calibration data set. These infrared spectra have been recorded after methane injection and dissolution once methane pressure attained the first plateau (Figure 4).
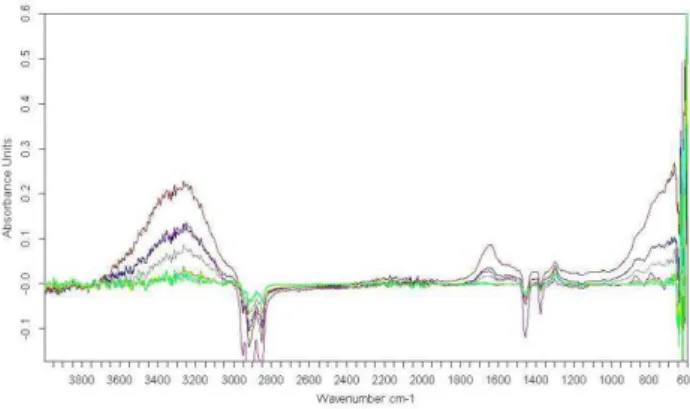
Before using this PLS calibration model, a detailed examination of recorded spectra is necessary to identify appropriate spectral band (or region) expressing quantitative information. As shown on figure 5, distinctive absorption band is observed at about 1367 cm-1 corresponding to bending mode of
C-H vibration in methane molecule. The spectral range between 1320 cm-1 and 1279 cm-1 was used
for quantitative modeling. OH contributions are identified in the region between 3100 cm-1 and
3700 cm-1.
Thirty spectra were, finally, used to build the calibration model and twelve spectra have allowed the cross validation.
Figure 5 ATR-FTIR spectra of liquid phase recorded during solubility experiments
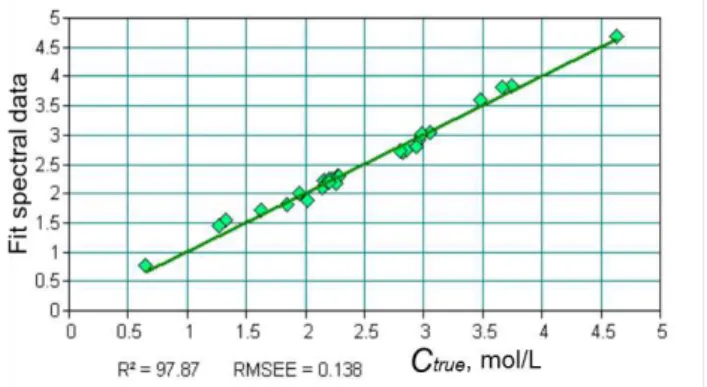
Figure 6 show calibration model obtained after PLS modeling. Linear regression has been obtained between the known dissolved methane concentration (Ctrue, mol/L), and measured spectral features (spectral region of C-H vibration).
Figure 6 Calibration model
Figure 6 show that the calibration model is very satisfactory with a good regression coefficient, R2,
of 98%.
The result of cross-validation, as shown in Figure 7, has demonstrated good correlation, (R2 = 98%),
between predicted concentrations (Cpred, mol/L) obtained by calibration model and calculated concentrations (Ctrue, mol/L) using equation 4. The calibration model was finally found to provide good predicted dissolved methane concentrations with an average relative uncertainty, calculated for three water contents (5%, 10% and 30%) and in the investigated concentration range, of the order of 8%.
Figure 7 Cross-validation results
Low values of RMSEE and RMSEP criteria (<1.5%), have contributed to validate this calibration model.
Crystallization results
Once a suitable calibration model was validated, the time evolution of methane concentration was obtained for two water cuts (5%vol. and 30%vol.)
by monitoring crystallization process with ATR-FTIR spectroscopy.
Figure 2 shows the time evolution of methane concentration, determined by PLS model, for experiment with 5% water cut compared to the conversion rate. After the first methane injection, the dissolved methane concentration increases to about 2.98 mol/L (after 36 minutes). This value is close to the concentration of dissolved methane calculated from the equation of state (equation 2) of 2.75 mol/L.
After the second methane injection, the methane concentration is gradually increased from 2.74 mol/L to 3.04 mol/L. The beginning of crystallization is observed after about 59 minutes from the beginning of the experiment, and 4 min after the second injection. A 100% conversion rate of water is reached after only 14 min. This crystallization is accompanied by a small decrease in methane concentration (up to 3.01 mol/L). After concentration increases and decreases again until the end of the experiment to reach a value of about 3.26 mol/L. The concentration due to the methane dissolution, under the same experimental conditions, would be 4.67 mol/L.
Figure 2 Time evolution of methane concentration during crystallization and conversion rate for
experiment with 5% water cut.
During the crystallization experiment of a water-in –oil emulsion with 30% of water, as shown on figure 9, the dissolved methane concentration increases up to the maximal value of 2.24 mol/L. This concentration is equal to the calculated concentration of 2.21 mol/L.
After the second methane injection, the methane concentration is gradually increased from 2.20 mol/L to 2.87 mol/L. The beginning of crystallization is observed after about 33 minutes from the beginning of the experiment and 15 min
after the second injection. After that, the methane concentration is gradually decreased to a value of 1.33 mol/L, after 86 min of the onset of crystallization. This value corresponds to a conversion of about 18%. The concentration is subject to large fluctuations until the end of the crystallization experiment, where it reaches a value, of 1.10 mol/L. The conversion of water reached only a value of 31% (Figure 9). Under the same experimental conditions, the concentration due to the methane dissolution would be 4.20 mol /L.
Figure 9 Time evolution of methane concentration during crystallization and conversion rate for
experiment with 30% water cut.
Fluctuations of the dissolved methane concentration during the crystallization are likely caused by formation of hydrate crystals, and by agglomeration and breaking phenomena. Spectra obtained during the crystallization (Figure 10) have been of lower quality (Signal to Noise Ratio) compared to those obtained for methane solubility experiments (Figure 5).
Figure 10 ATR-FTIR spectra of liquid phase recorded during Crystallization experiments with
CONCLUSIONS
This work demonstrates the quantitative application of in-situ ATR-FTIR spectroscopy using multivariate data analysis technique in the case of crystallization process.
In situ ATR-FTIR spectroscopy has been applied to monitor the methane concentration in liquid phase during methane dissolution and crystallization. It was shown that a significantly good quantitative model was obtained by applying PLS regression analysis of ATR-FTIR spectra recorded during solubility only.
Through data preprocessing techniques, a good dissolved methane concentration estimation was obtained. Time evolution of methane crystallization during crystallization experiments performed with 5% and 30% of water cut, respectively, was determined. It was compared to conversation rate of water. The results were significantly affected by hydrates crystals which caused fluctuation in the methane concentration. However, we believe that ATR-FTIR spectroscopy in combination with multivariate data analysis is of great importance for an in situ measurement of the liquid phase composition in crystallization process.
REFERENCES
[1] Hung L, Cameirao A, Herri JM, Darbouret M, Peytavy JL, Glenat P. Chord length distributions
measurements during crystallization and
agglomeration of gas hydrate in a water-in-oil emulsion: Simulation and experimentation.
Chemical Engineering Science 2010;65:1185-1200.
[2] Sinquin A, Palermo T, Peysson Y.
Rheological and Flow Properties of Gas Hydrate Suspensions. Oil & Gas Science and Technology.
Rev. IFP-EN 2004;59(1):41-57.
[3] Melchuna A, Cameirao A, Herri JM, Glenat P.
Transport of hydrates slurry at high water cut. The
8th international Conference in Gas Hydrates,
China, 2014.
[4] Galfré A, Cameirao A, Herri JM. Monitoring
and modeling the crystallization of the CP gas
hydrate via FBRM probe. The 8th international
Conference in Gas Hydrates, China, 2014.
[5] Dunuwila DD, Berglund KA. ATR FTIR
spectroscopy for in situ measurement of supersaturation. Journal of Crystal Growth 1997;
179:185-193.
[6] Wolf U, Leiberich R, Seeba J. Application of
infrared ATR spectroscopy to in situ reaction monitoring. Catalysis Today 1999; 49:411-418.
[7] Chen ZP, Morris J, Borissova A, Khan S, Mahmud T, Penchev R, Roberts KJ. On-line
monitoring of batch cooling crystallization of organic compounds using ATR-FTIR spectroscopy coupled with advanced calibration method.
Chemometrics and Intelligent Laboratory Systems 2009; 96:49-58.
[8] Lewinar F, Klein JP, Puel F, Févotte G.
On-line measurement of supersaturation during solution crystallization processes. Calibration and applications on three solute/solvent systems.
Chemical Engineering Science 2001; 56:2069-2084.
[9] Cornel J, Lindenberg C, Mazzotti M.
Quantitative application of in situ ATR-FTIR and Raman Spectroscopy in crystallization processes.
Industrial Engineering Chemical research 2008; 47:4870-4882.
[10] Derdour L, Févotte G, Puel F, Carvin P.
Real-time evolution of the concentration of impurities during organic solution crystallization.
Powder Technology 2003; 129:1-7.
[11] Alatalo H, Kohonen J, Qu H, Hatakka H, Reinihainen SP, Louhi-Kultanen M, Kallas J.
In-line monitoring of reactive crystallization process based on ATR-FTIR and Raman spectroscopy.
Journal of Chemometrics 2008; 22:644-652. [12] Bruker Optics. OPUS spectroscopy software.
User Manuel. BRUKER OPTIK GmbH 2006.
[13] Fidel-Durafour A. PHD’s thesis. Ecole des Mines de Saint Etienne 2004.