HAL Id: hal-01101643
https://hal.archives-ouvertes.fr/hal-01101643
Submitted on 23 Jan 2015HAL is a multi-disciplinary open access archive for the deposit and dissemination of sci-entific research documents, whether they are pub-lished or not. The documents may come from teaching and research institutions in France or
L’archive ouverte pluridisciplinaire HAL, est destinée au dépôt et à la diffusion de documents scientifiques de niveau recherche, publiés ou non, émanant des établissements d’enseignement et de recherche français ou étrangers, des laboratoires
Segmentation of elongated objects using attribute
profiles and area stability: application to melanocyte
segmentation.
Andrés Serna, Beatriz Marcotegui, Etienne Decencière, Thérese Baldeweck,
Ana-Maria Pena, Sébastien Brizion
To cite this version:
Andrés Serna, Beatriz Marcotegui, Etienne Decencière, Thérese Baldeweck, Ana-Maria Pena, et al.. Segmentation of elongated objects using attribute profiles and area stability: application to melanocyte segmentation.. Pattern Recognition Letters, Elsevier, 2014, 10.1016/j.patrec.2014.03.014. �hal-01101643�
Segmentation of elongated objects using attribute
profiles and area stability: application to
melanocyte segmentation
Andr´es Serna1, Beatriz Marcotegui1, Etienne Decenci`ere1, Th´er`ese Baldeweck2, Ana-Maria Pena2, S´ebastien Brizion2 1Mines ParisTech, CMM - Centre de morphologie math´ematique. 35
rue St Honor´e 77305-Fontainebleau-Cedex, France. 2 L’Or´eal Research and Innovation, 1 Avenue Eug`ene Schueller
93601-Aulnay-sous-Bois, France.
Abstract
In this paper, a method to segment elongated objects is proposed. It is based on attribute profiles and area stability. Images are rep-resented as component trees using a threshold decomposition. Then, some attributes are computed on each node of the tree. Finally, the attribute profile is analyzed to identify important events useful for seg-mentation tasks. In this work, a new attribute, combining geodesic elongation and area stability is defined. This methodology is success-fully applied to the segmentation of cells in multiphoton fluorescence microscopy images of engineered skin. Quantitative results are pro-vided, demonstrating the performance and robustness of the new at-tribute. A comparison with MSER is also given.
keywords: mathematical morphology, segmentation, connected component, attribute profile, elongation, area stability, multiphoton microscopy.
1
Introduction
Filtering techniques, aiming at removing noise while preserving as much as possible the desired information, are often essential prior to segmentation. Mathematical Morphology [Mat75, Ser88] is a theory of non-linear oper-ators based on a set approach in order to study the objects morphology. Classically, it uses structuring elements. It has been shown that adaptive approaches can lead to important improvements [LDM07, MV09, PD09, Roe09, Ang11].
In this paper, we propose a method to segment elongated cells (melanocytes) in multiphoton fluorescence microscopy images of engineered skin. Seg-menting these images with standard methods fails since melanocytes are
low contrasted and noisy. Moreover, it is proven that including shape prior knowledge improves the segmentation results.
The proposed method is based on the analysis of the attribute profile over the threshold decomposition of an image. We define a new attribute, called area-stable elongation, that combines the geodesic elongation and the area stability. In our experiments, we analyze important events in the evolution of this attribute and we show its efficiency in segmenting elongated objects while filtering out noisy structures.
This paper is organized as follows. Section 2 reviews related work in the state of the art. Section 3 presents the threshold decomposition, the attribute profile and introduces the new area-stable elongation attribute. Section 4 illustrates an application segmenting elongated cells in fluores-cence multiphoton microscopy images of engineered skin. Finally, Section 5 concludes the paper.
2
Related work
[Jon99] proposed connected filters using attributes signatures, i.e. the evo-lution of an attribute on the component tree. He has successfully applied his method to the segmentation of wood micrographs. [PB01] introduced mor-phological profiles using the derivative of the residues from opening/closing by reconstruction. Their method is well suited for images with low contrast and low resolution. However, the maximal residue may not be the best segmentation choice. Moreover, the computational cost increases when pro-cessing large and homogeneous images. [Beu07] proposed the analysis of the residue evolution through successive morphological operations. This evolu-tion over each pixel of the image leads to interesting transformaevolu-tions such as ultimate openings and quasi-distance functions. More recently, [OPS12] proposed differential area profiles for efficient point-based multiscale feature extraction in pattern analysis and image segmentation.
Maximally Stable Extremal Regions (MSER), proposed by [MCUP04], is a well-known region detector. MSER are invariant to affine transformations of both intensity and image coordinates. They have a high repeatability and can be run in linear time with respect to the number of pixels in the image (5 Mpix/s using a max-tree implementation [NS08]). However, the param-eter selection remains its major drawback. Even when default paramparam-eters perform well in many applications, some heuristics need to be applied in order to yield appropriate regions. Moreover, MSER favors round regions, as proved by [KZBB11], making it unsuitable to detect irregular shapes such as elongated objects.
[FL07] computed SIFT descriptors on the MSER shape in order to char-acterize each region of the image. This approach is proven to be robust to illumination changes and nearby occlusions. They also proposed a
pyrami-dal searching to reach scale invariability. The authors also suggested the use of MSER for image segmentation. [For07] extended the MSER concept to color images and [LBB12] defined stable volumetric features in deformable shapes.
This paper is an extended version of [SM13] work. In that framework, the attribute profile is built over increasing quasi-flat zones and three applica-tion are presented: image segmentaapplica-tion, adaptive mathematical morphology and feature extraction. In this paper, we extend the idea of analyzing the attribute profile over the threshold decomposition of an image. Additionally, we define an attribute profile based on a new attribute, called area-stable elongation, to segment elongated objects.
3
Methodology
3.1 Threshold decomposition and attribute profile
A binary attribute can be extended to gray-scale through threshold decom-position [WCG86, MZ90]. Let I be a digital gray-scale image I: D → V , with D ⊂ Z2 the image domain and V = [0, ..., R] the set of gray lev-els. A decomposition of I can be obtained considering successive thresholds Tt(I) = {p ∈ D|I(p) > t} for t = [0, ..., R − 1]. Since this decomposition
sat-isfies the inclusion property Tt(I) ⊆ Tt−1(I), ∀t ∈ [1, ..., R − 1], it is possible
to build a tree, called the component tree, with these level sets Tt(I). Each
branch of the tree represents the evolution of a single connected component (CC) Xt. An attribute profile is the evolution of an attribute on a branch
of the tree.
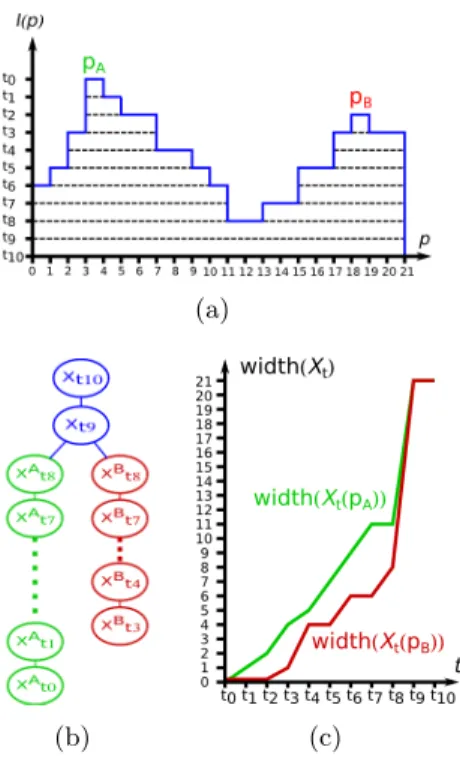
Fig. 1 illustrates the threshold decomposition in the 1D case, its compo-nent tree and attribute (width) profiles for the two maxima of the function (pA and pB). Events on this attribute profile are useful to segment objects
[Jon99], extract features [PB01] and define adaptive structuring elements [SM13].
In general, there are two types of attributes: increasing and non-increasing [BJ96]. On the one hand, an attribute is increasing when its value is greater or equal to the attribute computed on any subset of the object. The most common increasing attribute is the area, which is used to compute area openings and area stability, among others. On the other hand, an attribute is non-increasing when the latter property is not reached. In general, shape attributes –such as circularity, tortuousity, elongation– are not increasing.
3.2 Geodesic Elongation
In this work, we focus on geodesic elongation, simply called henceforth elon-gation [LM84]. The elonelon-gation E(Xt) of an object Xt is a shape descriptor
(a)
(b) (c)
Figure 1: 1D threshold decomposition (a), component tree (b), and attribute profile (c).
useful to characterize long and thin structures. It is proportional to the ra-tio between the square geodesic diameter L2(X
t) and the area of the object
A(Xt), as shown in Eq. 1. The geodesic diameter L(Xt) = supx∈Xt{lx(Xt)} is the length of the longest geodesic arc of Xt, i.e. the longest internal
segment lx(Xt) connecting the two end points of Xt [LB81].
E(Xt) = π 4 L2(Xt) A(Xt) (1) The longer and narrower the object, the higher the elongation. The lowest bound is reached with the disk, where E(Xt) = 1. An example of
elongation for binary objects is presented in Fig. 2. The number on each object corresponds to its approximated elongation. An efficient implemen-tation can be found in [MDD13].
A feature image can be defined assigning to each pixel pinthe maximum
attribute recorded over all CC Xt(pin) containing this pixel, i.e. the
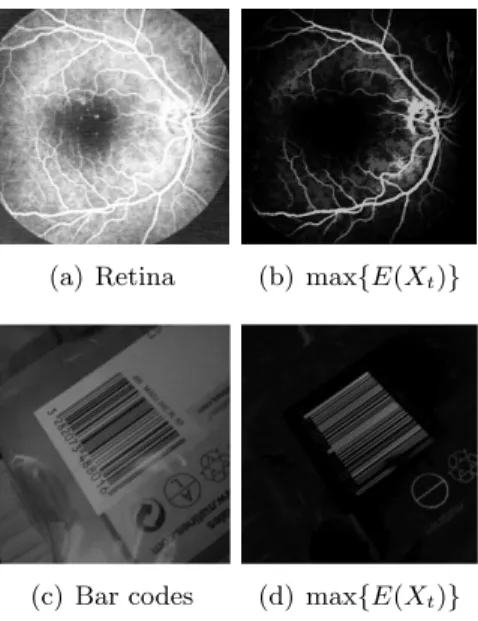
maxi-mum of the attribute profile. Fig. 4(b) exemplifies the maximal elongation image max{E(Xt)} on a synthetic example while Fig. 3 presents two real
cases. It has to be noted that this feature image is a partition in which objects of an elongated shape are highlighted.
Figure 2: Geodesic elongation for different binary objects. The elongation values have been approximated to get integer values.
(a) Retina (b) max{E(Xt)}
(c) Bar codes (d) max{E(Xt)}
Figure 3: Maximal elongation images using threshold decomposition.
3.3 Maximally Stable Extremal Regions (MSER)
A simple but interesting attribute is the area A(Xt). When used to suppress
small CCs, it leads to the definition of the area opening [Vin94]. Since A(Xt)
is increasing, events in the area profile are analyzed instead of its global maximum. For example, great changes in area are probably related to the union of different objects while small ones are related to area stable regions, as those detected by the MSER method [MCUP04].
The area stability Ψ of the region Xt is defined as the ratio between its
area A(Xt) and its area variation dA(Xdtt), as shown in Eq. 2:
Ψ(Xt) =
A(Xt) dA(Xt)
dt
(2) A MSER is a CC Xtwith maximal area stability. In the original
proposi-tion, every local maximum is detected, thus making possible to have nested regions. Then, some heuristics can be applied to only select the most im-portant peaks.
3.4 A new attribute: Area-stable elongation
Favoring regular (round) regions is one of the main limitations of MSER, as proved by [KZBB11]. Thus, it is not suitable to detect irregular shapes, as elongated objects. In order to detect elongated objects taking into account their area stability, we propose a new attribute Φ(Xt), called area-stable
elongation. This attribute combines the area stability of a region Ψ(Xt)
with its elongation E(Xt), as defined in Eq. 3:
Φ(Xt) = Ψ(Xt)E(Xt) = A(Xt) dA(Xt) dt π 4 L2(Xt) A(Xt) = π 4 L2(Xt) dA(Xt) dt (3) The area-stable elongation function Φ(Xt) is affine-invariant since Ψ(Xt)
and E(Xt) are preserved under affine transformation of intensity (domain
V ) and image coordinates (domain D), as stated by [MCUP04] and [FL07]. However, area-stable elongated regions are not invariant to blur. If blurring invariance is required, e.g. for a matching application, two possible solutions consist in weighting the stability function by the gradient magnitude along its boundary or pre-processing the image with a deblurring filter, as proposed by [KZBB11].
The maxima of Φ(Xt) represent area stable regions with a significant
elongation. We propose to build a feature image using the maximal Φ(Xt),
which implies: i) the feature image is a partition of the space, useful for seg-mentation; ii) each pixel contains information about the shape and the area stability of its neighborhood, which can be exploitable using prior knowl-edge.
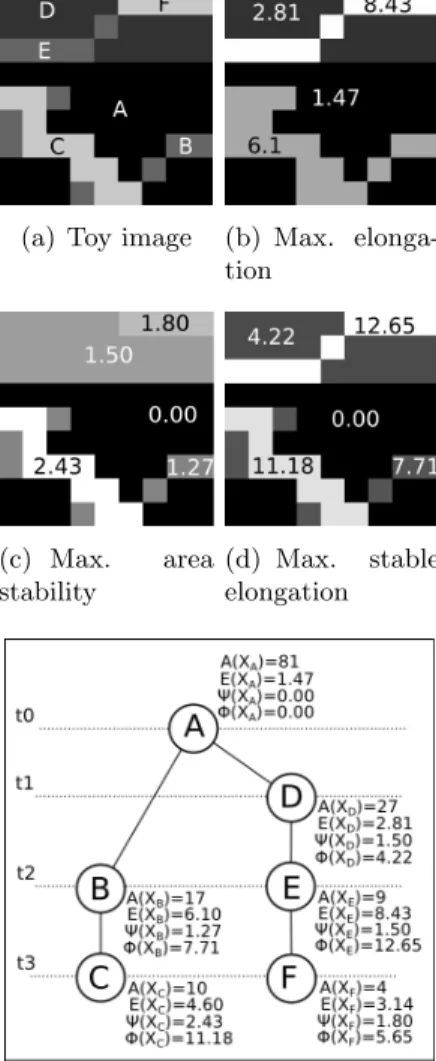
Let us explain this new attribute with a toy example. Consider the 9×9 image of Fig. 4. For this example, we have approximated the euclidean distance on the 8-connectivity grid, i.e. the geodesic diameter of a pixel is equal to 1, the distance between horizontal and vertical neighbors is equal to 1, and the distance between diagonal neighbors is equal to√2. This toy image contains 4 gray-levels enumerated from t0to t3, and 6 CCs enumerated
from A to F. Fig. 4(e) presents the component tree, where A(X), E(X), Ψ(X) and Φ(X) are the area, the elongation, the area stability and the area-stable elongation of a given component X, respectively. Note that the stability for the background (object A) is not defined since it is the root of the component tree.
The component tree contains two branches. Let us suppose that we aim at segmenting object C from the left branch, and object E+F from the right one. Let us analyze each case separately.
First, object C is an elongated object nested on a spurious elongated structure B. Analyzing the elongation profile, we can see that object B (E(XB)=6.10) is more elongated than object C (E(XC)=4.60), as shown in
the maximal elongation image of Fig. 4(b). However, the stability of region C (Ψ(XC)=2.43) is higher than that of region B (Ψ(XB)=1.27), as shown
(a) Toy image (b) Max. elonga-tion (c) Max. area stability (d) Max. stable elongation
(e) Component tree
Figure 4: Toy example: maximal attributes images and component tree.
in Fig. 4(c). Combining these two attributes, region C (Φ(XC)=11.18) has
a higher area-stable elongation than region B (Φ(XB)=7.71), as shown in
Fig. 4(d).
Second, object E is an elongated object that includes another elongated object F. Analyzing the elongation profile, we can see that object E+F (E(XE)=8.43) is more elongated than the single object F (E(XF)=3.14),
as shown in the maximal elongation image of Fig. 4(b). Since their area stabilities are similar (Ψ(XE)=1.50 and Ψ(XF)=1.80, as shown in Fig. 4(c)),
the highest area-stable elongation is obtained for the union of these two objects (Φ(XE)=12.65), as shown in Fig. 4(d).
It is noteworthy that applying a simple threshold (e.g. Φ(Xt) ≥ 8) in the
are correctly segmented, which is not possible on the original image nor on the other two feature images (Figs. 4(b) and 4(c)).
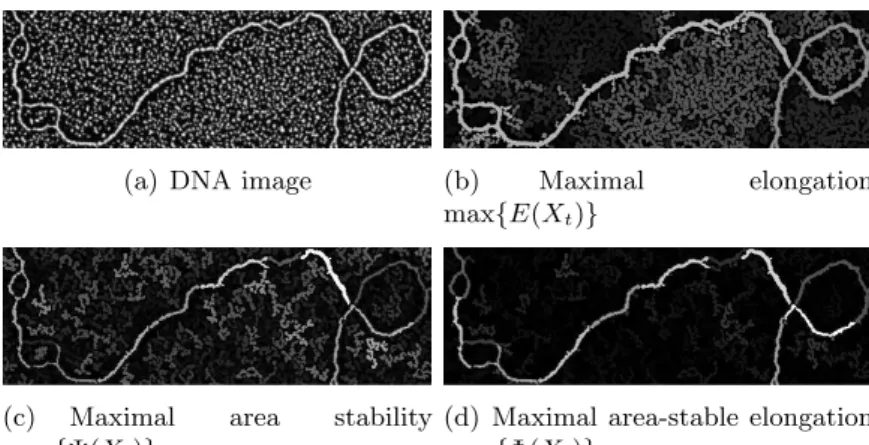
Fig. 5 illustrates the behavior of our method on a real DNA image. The goal is to segment the elongated and bright fiber from the noisy background. Fig. 5(b) shows the maximal elongation image, where objects of an elongated shape are highlighted. However, spurious objects can be merged at low levels resulting in CC with high feature value, such as the porous structure in the center of the image. The maximal area stability (Fig. 5(c)) keeps also many noisy and non elongated structures in the background. Finally, Fig. 5(d) shows the area-stable elongation image, where most of noisy structures have been eliminated due to their low stability.
(a) DNA image (b) Maximal elongation
max{E(Xt)}
(c) Maximal area stability
max{Ψ(Xt)}
(d) Maximal area-stable elongation max{Φ(Xt)}
Figure 5: Maximal elongation, maximal area stability and maximal area-stable elongation on a real DNA image.
4
Application: cell segmentation
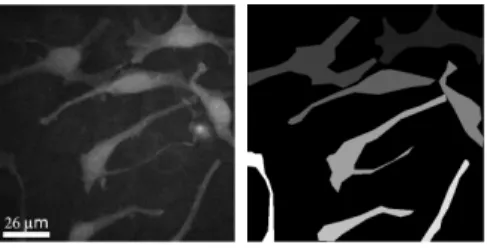
To illustrate the performance of our method, we apply it to segment elon-gated cells in multiphoton fluorescence microscopy images. Images corre-spond to reconstructed skin used in cosmetic research in applications such as screening of de-pigmenting and pro-pigmenting agents (Fig. 6(a)). This model contains two types of cells: keratinocytes and melanocytes. The lat-ter are dendritic cells, more elongated and brighlat-ter than keratinocytes. An accurate segmentation of melanocytes becomes crucial in order to quantify the melanin in the skin. This value is used to assess the efficiency of the cosmetic ingredient. Our goal here is to segment melanocytes, which appear as bright elongated structures.
Segmenting these images with standard methods fails since melanocytes are low contrasted and noisy, as shown in Fig. 6(a). A first simple solu-tion may consist in applying automatic thresholding, e.g. Otsu method
[Ots79]. However, it does not work because foreground and background gray-distributions overlap, as shown in the histogram of Fig. 6(c). Thus, cells and background are not separable with a global threshold.
(a) 511 × 511 pix-els (resolution 0.26 µm/pixel).
(b) Ground truth (melanocytes)
(c) Histogram of melanocytes and background.
Figure 6: Foreground and brackground gray distributions on a multiphoton image of engineered skin containing keratinocytes and melanocytes.
In this application, we propose a segmentation method using the com-ponent tree in order to solve the problem of low contrasted cells. Besides, the use of the area-stable elongation introduces shape prior knowledge and offers robustness to noise. In such a case, each cell can be segmented if it appears in the component tree, even if its gray-level is much lower than that for other cells in the image. Moreover, thanks to prior knowledge about melanocyte shape, the result is improved, justifying the use of our proposed methodology.
In our experiments we have 8 manually annotated images of 511 × 511 pixels each. The spatial resolution is equal to 0.26 µm/pixel. The ground truth definition has been carried out by experts from L’Or´eal Research and Innovation. Classical Precision (P ), Recall (R) and fmean = (2 × P ×
R)/(P + R) statistics are computed in order to evaluate our results. The recall (or completeness) is defined as the number of correctly segmented pixels divided by the number of pixels marked in the ground truth. The
precision (or correctness) is defined as the number of correctly segmented pixels divided by the total number of segmented pixels.
To exemplify our method, let us analyze the attribute profile for a single pixel belonging to a melanocyte, called seed pixel and marked with a red x in Fig. 7(a). Fig. 7(b) presents the ground truth provided by an expert. Fig. 7(c) shows four attribute profiles: area A(Xt), elongation E(Xt), area
stability Ψ(Xt) and area-stable elongation Φ(Xt). For visualization
pur-poses, each attribute has been normalized dividing by its maximum value to be in the range [0, 1]. Additionally, the fmeanis plotted in order to define the
best possible segmentation for this cell. Figs. 7(d) to 7(i) show the evolution of the CC Xt containing the seed pixel.
Segmentation methods using threshold decomposition are based on the hypothesis that objects of interest exist at some level of the tree. In our example, the best possible segmentation corresponds to Xt=34, for which
the highest fmean is obtained. Other good segmentations are in the range
Xt∈[34,30]. The whole melanocyte is not retrieved for Xt>34 and it is merged
with other structures for Xt<30.
Let us analyze each attribute profile, starting with A(Xt). Based on
a prior knowledge about melanocytes size, attributes for t < 15 are not analyzed since they correspond to structures bigger than 75% of the whole image. Analyzing Ψ(Xt), its global maximum represents the most stable
region Xt=42. This is an area-stable and round region but useless in such
a case since it does not match the entire melanocyte. Another interesting attribute is E(Xt) since melanocytes are long and thin. Its global maximum
corresponds to a CC merging three different objects Xt=28. From an
area-stability viewpoint, this region is not stable because it is generated merging three different objects in a small range t ∈ [30, 28]. Finally, the global maximum of the area-stable elongation Φ(Xt) appears at Xt=34, which is
the best segmentation according to fmean.
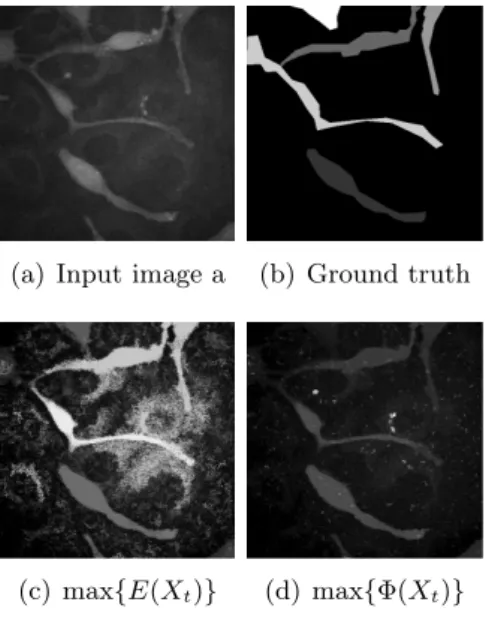
Figs. 8 and 9 present two experimental results. Figs. 8(a) and 9(a) show the two input images with their corresponding manual annotations in Figs. 8(b) and 9(b). Figs. 8(c) and 9(c) present the max{E(Xt)} images.
Note that all melanocytes present a significant elongation, however some post processing is required in order to eliminate porous structures on the background. Most noisy regions are not area-stable, then the area-stable elongation Φ(Xt) appears suitable for the segmentation of this kind of
ob-jects, as shown in Figs. 8(d) and 9(d). This example demonstrates the use of our area-stable elongation in order to enhance elongated objects with respect to a noisy background. Using this feature image, the melanocyte segmentation becomes an easy task.
A simple three-fold segmentation algorithm is used for this purpose: i) characterization: a feature image is computed using the maximal area-stable elongation max{Φ(Xt)}; ii) filtering small objects: in the feature
(a) Multiphoton image.
(b) Ground truth.
(c) Attribute profiles. Xt<15 is not
considered because A(Xt) > 0.8
(d) Xt=42 (e) Xt=34 (f) Xt=31
(g) Xt=30 (h) Xt=28 (i) Xt=16
Figure 7: Attribute profiles for pixel marked with an x in the input image (a). From (d) to (i) CC of Xtcontaining x, for diffent values of t.
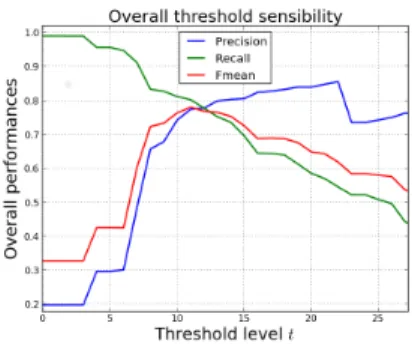
opening followed by an area closing. This parameter is not critical since the smallest cell in the database is approximatively 3000 pixels size; finally, iii) filtering objects with low attribute value: a simple threshold removes structures with low area-stable elongation. In our experiments we have used a threshold equal to 11 for all images. However, this parameter is not critical since several values produce similar results, as shown in the overall sensi-bility curve of Fig. 10. It is noteworthy that thresholds between 7 and 16
(a) Input image a (b) Ground truth
(c) max{E(Xt)} (d) max{Φ(Xt)}
Figure 8: Feature images using the global maximum in the attribute profile.
(a) Input image b (b) Ground truth (c) max{E(Xt)} (d) max{Φ(Xt)}
Figure 9: Feature images using the global maximum in the attribute profile.
produce an overall fmean over 70%.
Table 1 presents quantitative results and a comparison with respect to the classical MSER by [MCUP04]. MSER regions have been computed us-ing the algorithm directly provided by the authors [MTS+05]. The MSER parameters have been consistently set with those used by our method, i.e. the minimal MSER area has been set to 500 pixels and the threshold de-composition has been carried out for all gray-levels (one by one) stopping when the object area is greater than 75% of the whole image. Other MSER parameters such as relative area and relative margins have been kept to their default values 0.010 and false, respectively. Setting up these two parame-ters is not intuitive and global improvements have not been obtained in our tests. Using our method, this kind of parameters is not required, which is an advantage with respect to MSER. MSER results may be also improved using some pre-processing step. However, it would require the setting up and the
Figure 10: Overall sensibility curves: threshold to eliminate objects with low area-stable elongation.
Table 1: Comparison with respect to MSER. In each column, numbers on the left correspond to the proposed method, and numbers between parentheses to MSER.
Image Precision Recall fmean
a 0.84 (0.83) 0.61 (0.36) 0.71 (0.51) b 0.74 (0.89) 0.84 (0.42) 0.78 (0.57) c 0.71 (0.52) 0.84 (0.38) 0.77 (0.44) d 0.78 (0.84) 0.78 (0.53) 0.78 (0.65) e 0.85 (0.73) 0.90 (0.40) 0.87 (0.52) f 0.84 (0.72) 0.68 (0.48) 0.75 (0.57) g 0.62 (0.52) 0.92 (0.26) 0.74 (0.34) h 0.83 (0.50) 0.86 (0.41) 0.84 (0.45) Overall: 0.78 (0.69) 0.80 (0.41) 0.78 (0.51)
selection of the appropriate filter to do it. Another advantage of our method is that pre-processing is not used since the noise robustness is included in the area-stable elongation itself, as aforementioned in Section 3.4.
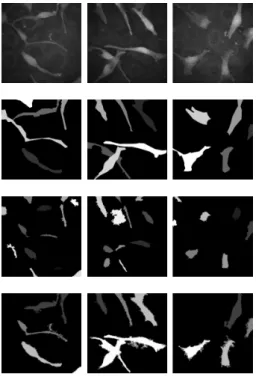
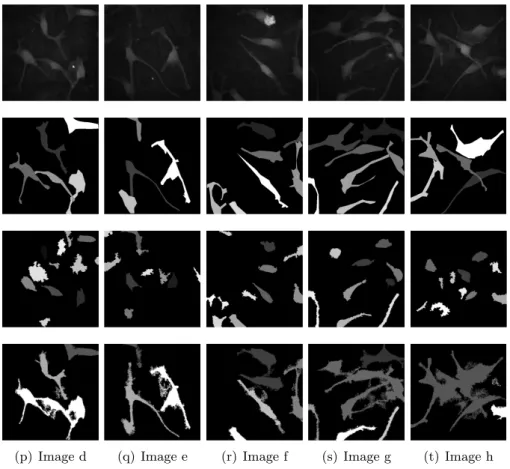
Figs. 11 and 12 present our experimental results showing the input im-age, the ground truth, the MSER result and our segmentation result. It is noteworthy that in most cases, melanocytes are correctly segmented by our method. Some problems are shown in Fig. 11(l) where a clearly non-elongated melanocyte in the upper left part of the image has not been seg-mented, and in Fig. 12(r) where a melanocyte in the lower left part has not been detected; given its low contrast, it is mixed with the background. Note that our method presents much better results than MSER for all images. As aforementioned, MSER favors round and regular regions. Thus, only a partial segmentation is possible. In fact, MSER corresponds in several cases
to the cell nuclei.
(j) Image a (k) Image b (l) Image c
Figure 11: Segmentation of melanocytes using area-stable elongation. First row: input image; second row: ground truth; third row: MSER; fourth row: our segmentation result.
5
Conclusions
We have presented a method to segment elongated objects using attribute profiles. Images are represented as component trees using threshold decom-position. Then, the attribute profile is analyzed and important events are recorded. In this work, the geodesic elongation and the area stability are combined to define a new attribute: the area-stable elongation. The behavior of this new attribute in relation to noise, blur and geometrical distortions is discussed. The global maximum of this attribute is computed for each pixel of the input image and a feature image is built. This image is a spatial partition where objects of interest can be easily extracted using a simple threshold.
This method can be interpreted as an extension of MSER favoring ob-jects of a given shape. Another main difference with the classical MSER is that only the global maximum of the attribute profile is chosen, thus only
(p) Image d (q) Image e (r) Image f (s) Image g (t) Image h
Figure 12: Segmentation of melanocytes using area-stable elongation. First row: input image; second row: ground truth; third row: MSER; fourth row: our segmentation result.
the most stable and elongated region is kept. More generally, this work con-firms the interest of attribute profiles for image analysis and segmentation. Our method has been successfully used in a cosmetic application aiming at segmenting melanocytes cells that appear as bright and elongated structures in multiphoton images. Standard methods fail because melanocytes are low contrasted and noisy. Better segmentations are obtained providing a prior knowledge about cells shape. One of the method limitations, common to all methods based on threshold decompositions, is that it can only segment CCs present in the component tree.
The analysis based on attribute profiles can be extended to other at-tributes and to other hierarchical partitions. For example, [SM13] compute attribute profiles on increasing quasi-flat zones, which is useful when pro-cessing pre-filtered images. In the future, other interesting attributes such as porosity and tortuousity will be studied. Additionally, extensions to higher dimensional data (color and 3D) will be analyzed.
Acknowledgements
Part of this work has been funded by TerraMobilita project.
References
[Ang11] Jesus Angulo. Morphological Bilateral Filtering and Spatially-Variant Adaptive Structuring Functions. In Proceedings of the 10th International Symposium on Mathematical Morphology (ISMM’11), pages 212–223, 2011.
[Beu07] Serge Beucher. Numerical residues. Image and Vision Comput-ing, 25(4):405–415, April 2007.
[BJ96] Edmond J. Breen and Ronald Jones. Attribute Openings, Thin-nings, and Granulometries. Computer Vision and Image Under-standing, 64(3):377–389, 1996.
[FL07] P.-E. Forssen and D.G. Lowe. Shape Descriptors for Maximally Stable Extremal Regions. In IEEE 11th International Confer-ence on Computer Vision, ICCV 2007, pages 1–8, 2007.
[For07] P.-E. Forssen. Maximally Stable Colour Regions for Recognition and Matching. In IEEE Conference on Computer Vision and Pattern Recognition, CVPR 2007, pages 1–8, 2007.
[Jon99] Ronald Jones. Connected Filtering and Segmentation Using Component Trees. Computer Vision and Image Understanding, 75(3):215–228, 1999.
[KZBB11] R. Kimmel, Cuiping Zhang, A.M. Bronstein, and M.M. Bron-stein. Are MSER Features Really Interesting? IEEE Transactions on Pattern Analysis and Machine Intelligence, 33(11):2316–2320, 2011.
[LB81] Christian Lantu´ejoul and Serge Beucher. On the use of the geodesic metric in image analysis. Journal of Microscopy, 121(1):39–49, 1981.
[LBB12] R. Litman, A.M. Bronstein, and M.M. Bronstein. Stable volu-metric features in deformable shapes. Computers & Graphics, 36(5):569–576, 2012. Shape Modeling International Conference, SMI 2012.
[LDM07] Romain Lerallut, ´Etienne Decenci`ere, and Fernand Meyer. Im-age filtering using morphological amoebas. ImIm-age and Vision Computing, 25(4):395–404, 2007.
[LM84] Christian Lantu´ejoul and Francis Maisonneuve. Geodesic methods in quantitative image analysis. Pattern Recognition, 17(2):177–187, 1984.
[Mat75] Georges Matheron. Random Sets and Integral Geometry. John Wiley & Sons, New York, 1975.
[MCUP04] J. Matas, O. Chum, M. Urban, and T. Pajdla. Robust wide-baseline stereo from maximally stable extremal regions. Image and Vision Computing, 22(10):761–767, 2004. British Machine Vision Computing, BMVC 2002.
[MDD13] Vincent Morard, Etienne Decenci`ere, and Petr Dokl´adal. Effi-cient geodesic attribute thinnings based on the barycentric diam-eter. Journal of Mathematical Imaging and Vision, 46(1):128– 142, 2013.
[MTS+05] K. Mikolajczyk, T. Tuytelaars, C. Schmid, A. Zisserman, J. Matas, F. Schaffalitzky, T. Kadir, and L.Van Gool. A Com-parison of Affine Region Detectors. International Journal of Computer Vision, 65(1-2):43–72, 2005.
[MV09] P. Maragos and C. Vachier. Overview of adaptive morphology: Trends and perspectives. pages 2241–2244, 2009.
[MZ90] P. Maragos and R.D. Ziff. Threshold superposition in morpho-logical image analysis systems. IEEE Transactions on Pattern Analysis and Machine Intelligence, 12(5):498–504, 1990.
[NS08] David Nist´er and Henrik Stew´enius. Linear Time Maximally Stable Extremal Regions. In European Conference on Com-puter Vision, ECCV 2008, volume 5303 of LNCS, pages 183– 196. Springer Berlin Heidelberg, 2008.
[OPS12] G.K. Ouzounis, Martino Pesaresi, and P. Soille. Differential Area Profiles: Decomposition Properties and Efficient Computation. IEEE Transactions on Pattern Analysis and Machine Intelli-gence, 34(8):1533–1548, 2012.
[Ots79] Nobuyuki Otsu. A Threshold Selection Method from Gray-Level Histograms. IEEE Transactions on Systems, Man and Cyber-netics, 9(1):62–66, 1979.
[PB01] Martino Pesaresi and J.A. Benediktsson. A new approach for the morphological segmentation of high-resolution satellite im-agery. IEEE Transactions on Geoscience and Remote Sensing, 39(2):309–320, 2001.
[PD09] Jean-charles Pinoli and Johan Debayle. General Adaptive neigh-borhood mathematical morphology. In 16th IEEE International Conference on Image Processing (ICIP’09), pages 2249–2252, 2009.
[Roe09] Jos B. T. M. Roerdink. Adaptivity and group invariance in mathematical morphology. In Proceedings of the International Conference on Image Processing (ICIP’09), pages 2253–2256, Cairo, Egypt, 2009.
[Ser88] Jean Serra. Image Analysis and Mathematical Morphology, vol-ume 2. Academic Press, London, 1988.
[SM13] Andr´es Serna and Beatriz Marcotegui. Attribute Controlled Reconstruction and Adaptive Mathematical Morphology. In Mathematical Morphology and Its Applications to Signal and Im-age Processing, volume 7883 of LNCS, pIm-ages 207–218. Springer Berlin Heidelberg, 2013.
[Vin94] Luc Vincent. Morphological area openings and closings for grey-scale images. In Proceedings of the Workshop: shape in picture, pages 197–208, Driebergen, The Netherlands, 1994. Springer. [WCG86] P. Wendt, E.J. Coyle, and N.C. Jr. Gallagher. Stack filters.
IEEE Transactions on Acoustics, Speech and Signal Processing, 34(4):898–911, 1986.