HAL Id: hal-00827659
https://hal.archives-ouvertes.fr/hal-00827659
Submitted on 3 Jun 2013
HAL is a multi-disciplinary open access
archive for the deposit and dissemination of sci-entific research documents, whether they are pub-lished or not. The documents may come from teaching and research institutions in France or abroad, or from public or private research centers.
L’archive ouverte pluridisciplinaire HAL, est destinée au dépôt et à la diffusion de documents scientifiques de niveau recherche, publiés ou non, émanant des établissements d’enseignement et de recherche français ou étrangers, des laboratoires publics ou privés.
Investigation of Injection-Locked Quantum Cascade
Lasers based on Rate equations
Cheng Wang, Frédéric Grillot, Vassilios Kovanis, Jacky Even
To cite this version:
Cheng Wang, Frédéric Grillot, Vassilios Kovanis, Jacky Even. Investigation of Injection-Locked Quan-tum Cascade Lasers based on Rate equations. Journal of Applied Physics, American Institute of Physics, 2013, 113 (6), pp.063104. �10.1063/1.4790883�. �hal-00827659�
Investigation of Injection-Locked
Quantum Cascade Lasers based on Rate equations
Cheng Wang,1, a) Frédéric Grillot,2 Vassilios Kovanis,3,4 and Jacky Even1 1
Université Européenne de Bretagne, INSA, CNRS FOTON, 20 avenue des buttes de Coesmes, 35708 Rennes, France
2
Telecom Paristech, Ecole Nationale Supérieure des Télécommunications, CNRS LTCI, 46 rue Barrault, 75013 Paris, France
3ElectroScience Laboratory, Ohio Sate University, 1320 Kinnear Road, Columbus, OH, 43212,USA 4
Air Force Research Lab, 2241 Avionics Circle, Wright-Patterson AFB, OH 45433, USA
The optical injection-locking properties of quantum cascade lasers (QCLs) are investigated theoretically via a simple low dimensional rate equation model. The modulation bandwidth is found to be primarily enhanced by increasing the injection strength, while the impact of the frequency detuning and the linewidth enhancement factor (LEF) is momderate. However, both positive frequency detuning and large LEF contribute to enhancing the magnitude of the relaxation oscillation frequency peak in the intensity modulation (IM) response. As opposed to traditional injection-locked interband lasers, no pre-resonance frequency dip occurs in the QCL’s IM response, and calculations show that the LEF can critically modify both the locking and stability regions on the optical detuning injection level map.
I. INTRODUCTION
Quantum cascade lasers (QCLs) have been of great interest technologically since the first demonstration by Faist et al. in 19941. Because of the intersubband optical transitions, the spectra of QCLs ranges from mid-infrared down to terahertz2,3, which can be widely used in optical communication, high resolution spectroscopy, imaging, and remote sensing3. Indeed, due to the small carrier lifetime as compared to the photon lifetime, one particular feature of QCLs is the absence of relaxation oscillations in the electrical modulation response. Thus, because of the short stimulated lifetime and the cascade of photons, QCLs lead to ultra-wide modulation bandwidth, which is also highly desirable for free-space short-range communications4. On the other hand, the short non-radiative lifetime can suppress the relaxation oscillations resulting in an over-damped oscillator with carrier equilibrium completely restored after one photon roundtrip. To this end, assuming a simplified rate equation model, the modulation bandwidth can be as large as of 100 GHz4,5. Values up to terahertz were even theoretically predicted in intersubband semiconductor lasers based on a triple quantum well structure6,7. However, these values get restricted to tens of gigahertz when using a full rate equation approach taking into account the ground level from which electrons leave the active region into the injector of the next stage and QCL periods8,9. Experimentally, R. Paiella et al. reported a 8 micron QCL without the relaxation oscillation resonance10, and its modulation
a)Electronic mail: [email protected]
bandwidth is 10 GHz. Besides, modulation bandwidths of 13 GHz and 24 GHz have also been reported on terahertz QCLs with a test bench technique11,12. Since the relaxation oscillation is responsible for the dynamic stability in the free-running laser, a slight external perturbation such as modulation, optical injection or self-injection is enough to induce sustained pulsating intensities13. Optical injection-locking technique is known to be an attractive approach for improving the modulation characteristics of directly modulated interband semiconductor lasers14,15. Indeed, optical injection can be very critical for increasing the modulation bandwidth, reducing the laser’s chirp, and suppressing the mode hopping phenomenon as well as the relative intensity noise16-18. For instance, a record relaxation resonance frequency of 72 GHz associated with a broadband response of 44 GHz has been reported in an injection-locked quantum well DFB laser. Such a bandwidth enhancement corresponds to a 5.5 fold improvement when compared to the free-running case17. A theoretical study has recently reported the impacts of optical injection on the modulation properties of QCLs19. Numerical results point that injection-locked QCLs show no unstable regime in the locking map while giant modulation bandwidths as large as 200 GHz can be reached with a 10 dB injection level ratio.
This paper aims to go a step beyond in examing the IM properties of injection-locked QCLs, by taking into account the influences of injection strength, frequency detuning and LEF with fast and slow carrier removal rate. Based on a second-order system model, the modulation transfer function of the injection-locked
laser is obtained from a small signal analysis. Calculations show that the modulation bandwidth is mostly enhanced by increasing the injection strength, while it is little impacted by the frequency detuning and the LEF. However, both positive detuning and large LEF lead to the peak occurrence in the modulation response. In comparison with conventional injection-locked interband semiconductor lasers, no pre-resonance frequency dip occurs in the QCLs’ IM response.
II. RATE EQUATION MODEL
FIG. 1. Sketch of the simplified carrier dynamics model in injection-locked QCLs.
The classical differential equation describing the complex field of an injection-locked laser is as follows20,21:
(
)
( ) 1 1 1 ( ) ( ) 2 P H c inj inj dE t G j E t k A j w E t dt τ α ⎛ ⎞ = ⎜ − ⎟ + + − Δ ⎝ ⎠ (1) where ( )E t is the slave laser’s complex field, Gis the gain, τP is the photon lifetime, Ainj is the injected fieldmagnitude, αH is the LEF, Δwinj is the frequency
detuning (Δwinj =wmaster−wslave ), k is the coupling c
rate of the master laser into the slave laser and defined such askc =c/ (2n Lr ) with n the refractive index and r
L the cavity length. The complex rate equation (1) can be split into two coupled rate equations for the photon number and the phase, respectively, according to the relationship E t( )= S t( ) expjΔφ( )t with the phase differenceΔ =φ φslave−φmaster. Along with the simplified
carrier rate equation7, the rate equations of injection-locked QCLs are finally given by:
0 up up N dN I N G NS dt = q− τ − Δ (2) 0 up low low N R N dN N G NS dt = τ + Δ − τ (3)
(
0 1 /)
2 cos up P c inj sp N dS G N S k S S dt = Δ − τ +β τ + Δ (4) φ(
0 1 /)
sin 2 inj H P inj c S d G N k dt S α φ τ ω φ Δ = Δ − − Δ − Δ (5)where Nup and Nlow are the carrier numbers in the
upper and lower subbands, respectively. The QCL is assumed to be composed of one period as in Ref.7, and the sketch of the carrier dynamics is shown in Fig. 1. The pump current I is directly injected into the active region without through the injector. Then, the carriers enter the quantum well through the upper subband and leave only via the lower subband. Neither the carrier absorption process nor the ground level in the active region is taken into account in the simulations. Finally, let us note that τN is the carrier relaxation time from
the upper subband, τR is the carrier removal time from
the lower subband, τ is the spontaneous emission sp lifetime, β is the spontaneous emission factor, andSinj
is the injected photon number. The linear gain
0
G=G NΔ is proportional to ΔN=Nup−Nlow as well as to the gain coefficientG , which corresponds to the 0
differential gain multiplied by the group velocity. Although the approach used in this paper is rather simplified as compared to an actual QCL band structure, it is shown in the following that some preliminary insights regarding the high-speed properties of optically-injected QCLs can be extracted. III. STEADY-STATE RESPONSE
Neglecting the spontaneous term in Eq. (4) and setting the rate equations (2)-(5) to zero, the steady-state solutions can be expressed as:
(
)
(
)
2 2 2 0 0 1 1 / 1 / 4 2 c inj H p p inj k S S G N τ α G N τ w = ⎛ ⎞ Δ − +⎜ Δ − − Δ ⎟ ⎝ ⎠ (6) 0 1 1 2 inj cos up low c p S N N N k G τ S φ ⎛ ⎞ ⎜ ⎟ Δ = − = − Δ ⎜ ⎟ ⎝ ⎠ (7) 1 1 2 sin tan 1 inj H inj c H w S S k φ α α − ⎡⎢ −Δ ⎤⎥ − Δ = − ⎢ + ⎥ ⎣ ⎦ (8) Let us stress that the expression of the carrier numberfor the lower subband Nlow=τRI q/ is similar to the one occurring in the free-running laser. According to Eq. (7), ΔN is found to be reduced by
0
2kc Sinj /ScosΔφ/G from the free running valueΔNfr =1 / (G0τp). The bounds for the variation of
the phase across the locking range can be derived from Eq. (7) and Eq. (8), which are 1
cot αH −
at the negative frequency detuning edge and −π/ 2 at the positive frequency detuning edge22. Then, the locking regime can be obtained by rearranging Eq. (8):
(
)
2 1 1 / sin tan inj c H inj H w k α S S φ − α Δ = − + Δ + (9) In the simulations, the lasing wavelength is λ =8.0 mand the other parameters are G0=2.5×10⁵ s-1, τP =1
ps,τN=1.5 ps, τ =7 ns, β =10sp -4
, n =3.27, kr c=305.8
GHz while the bias current is fixed at I=1.2Ith . Although the typical cavity length of QCLs is in the order of millimetre8,23, shorter cavity is desirable for higher modulation bandwidth. In consequence, the cavity length in our simulation is set down to L =0.15 mm as in Ref. 5. Fig. 2 shows the locking map as function of the detuning frequency and the injection ratio Rinj=Sinj/S. Recent experiments have shown that
the above-threshold QCL LEF can range from 0 to about 2.523-26. To this end, calculations in this paper are conducted for LEF values of 0.1, 1, 2 and 3. The boundaries (solid line) between the locked and unlocked regimes are obtained from Eqs. (7)-(9). As for interband lasers, the locking range is found to increase with the injection ratio. Calculations also show that the LEF mainly influences the locking diagram especially for the negative frequency detuning boundary, which is reduced at larger LEFs. As it will be discussed in the next section, the stability boundary can be obtained from the pole extraction of the IM response (see Eq. (12)) via a stability analysis16. To this end, dashed lines in Fig. 2 indicate the stability boundary. The stable regime enlarges with higher LEF values. Interestingly, for LEF=0.1, the system is found always stable when the injection ratio gets larger than 0.05 (the boundary for Rinj<0.05 is not shown since it
overlaps others). Unlike the traditional locking map of interband lasers, simulations point out that in the case of injection-locked QCLs, there is no unstable regime in the locking range as already reported in Ref. 19.
However, at this stage we believe that this conclusion has to be supported via a deeper non-linear dynamics analysis conducted on a full rate equation model.
0,01 0,1 1 10 -500 -400 -300 -200 -100 0 100 200 300 400 500 LEF=0.1, 1, 2, 3 LEF=1, 2, 3 Locking boundary Stability boundary Unstable D e tu n in g fr e q u e n c y ( G H z) Injection ratio Locked Unlocked
FIG. 2. Optical injection-locking diagram as function of the detuning frequency and the injection ratio. Solid lines are the locking regime boundaries, the negative detuning frequency boundaries are calculated with LEF=0.1, 1, 2, 3, respectively; dashed line is the stability boundary.
IV. MODULATION RESPONSE
In order to obtain the small-signal responses to a small current deviation I1 , the deviations of
, , ,
up low
N N S Δφ are defined as Nup1,Nlow1,S1 andΔ , φ1
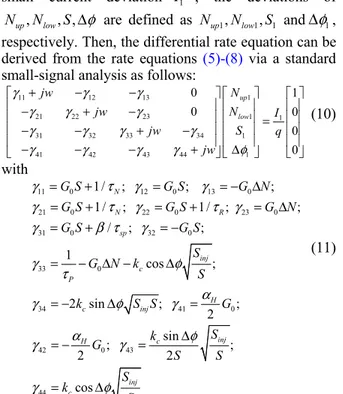
respectively. Then, the differential rate equation can be derived from the rate equations (5)-(8) via a standard small-signal analysis as follows:
11 12 13 1 21 22 23 1 1 31 32 33 34 1 41 42 43 44 1 0 1 0 0 0 0 up low jw N jw N I jw S q jw γ γ γ γ γ γ γ γ γ γ γ γ γ γ φ + − − ⎡ ⎤ ⎡ ⎤ ⎡ ⎤ ⎢ − + − ⎥ ⎢ ⎥ ⎢ ⎥ ⎢ ⎥ ⎢ ⎥= ⎢ ⎥ ⎢ − − + − ⎥ ⎢ ⎥ ⎢ ⎥ ⎢ − − − + ⎥ ⎢Δ ⎥ ⎢ ⎥ ⎣ ⎦ ⎣ ⎦ ⎣ ⎦ (10) with 11 0 12 0 13 0 21 0 22 0 23 0 31 0 32 0 33 0 34 41 0 42 0 43 44 1 / ; ; ; 1 / ; 1 / ; ; / ; ; 1 cos ; 2 sin ; ; 2 sin ; ; 2 2 cos N N R sp inj c P H c inj inj c H c G S G S G N G S G S G N G S G S S G N k S k S S G S k G S S k γ τ γ γ γ τ γ τ γ γ β τ γ γ φ τ α γ φ γ φ α γ γ γ = + = = − Δ = + = + = Δ = + = − = − Δ − Δ = − Δ = Δ = − = = Sinj S φ Δ (11)
Then, the modulation transfer function can be extracted as follows: 1 2 3 4 1 1 1 1 1 2 1 2 1 2 3 4 ( ) / ( ) ( ) (0) / (0) ( )( ) ( )( )( )( ) p p p p S w J w H w S J z z jw z jw z jw p jw p jw p jw p = = Δ − − × − − − − (12)
where the zeros are z2=1/τN−1/τR
andz1 =kc Sinj/S
(
αHsinΔ −φ cosΔφ)
, respectively.Parameter z1 is mainly determined by the injection
condition while z2 is related to the difference between
the carrier relaxation and carrier removal rates. The denominator of Eq. (12) represents a polynomial function whose expression comes from the determinant of the matrix located in Eq. (10). Because of the complexity of the transfer function, it is important to stress that the analytical expressions of the poles are too complicated to be extracted.
According to Ref. 7, for fast carrier removal rates, the IM response of the free-running QCLs does not exhibit a peak while in the case of slow carrier removal rates, a peak can arise in the free-running IM response. Let us note that this peak is not due to the traditional carrier-photon relaxation resonance as in interband lasers, but to the small zero occurring in the modulation transfer function. In what follows, optical injection-locking behaviours of QCLs have been
investigated both for fast and slow carrier removal rates. 0,1 1 10 100 -12 -9 -6 -3 0 3 Mo d u la ti o n r e s p o n s e ( d B ) Modulation freqency (GHz) Rinj=-10 dB Rinj=0 dB Rinj=10 dB Free running
Detuning=0 GHz, LEF=1 (a)
0,1 1 10 100 -12 -9 -6 -3 0 3 M o d u la ti o n r e s p o n s e ( d B ) Modulation freqency (GHz) Detuning=0 GHz Detuning=10 GHz Detuning=-10 GHz Free running Rinj=10 dB, LEF=1 (b) 0,1 1 10 100 -12 -9 -6 -3 0 3 6 M o d u la ti o n r e s p o n s e ( d B ) Modulation freqency (GHz) LEF=1 LEF=2 LEF=3 Free running Rinj=10 dB, Detuning=0 GHz (c)
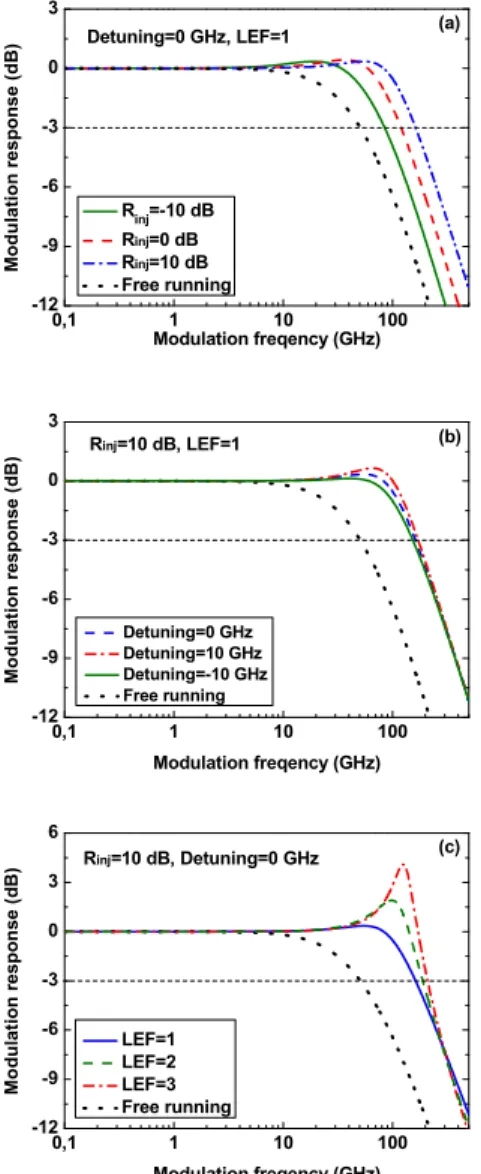
FIG. 3. IM response of optical injection-locked QCLs for fast carrier removal rate (τR=0.21 ps) as a function of (a) Injection ratio at zero detuning with LEF=1, (b) detuning frequency at Rinj=10 dB with
LEF=1, and (c) LEF at zero detuning with Rinj=10 dB.
A. IM response with fast carrier removal rate The carrier removal time is set to be τ =0.21 ps. R Fig. 3(a)-(c) show the optical injection-locking IM response of the QCLs as a function of the injection ratio Rinj, frequency detuning and LEF, respectively.
As depicted in Fig. 3(a) at zero detuning with LEF=1, the bandwidth f3dB increases with the injection ratio, and the modulation response remains relatively flat with no peak. At Rinj=10 dB, the modulation bandwidth
(163 GHz) is 3.2 fold enhancement as compared to the free-running one (51 GHz). In comparison, in the case of injection-locked interband lasers, there is an optimum injection strength, above which the modulation bandwidth starts decreasing18.
TABLE I. Poles, Zeros and Bandwidths (GHz) for Fig. 3(a)
Rinj(dB) p1 p2 p3 p4 z1 z2 f3dB Free -35.3 -93.2 -777.9 -651.8 50.9 -10 24.3 - 47.5 - -87.5 793.6 - 16.7 - 651.8 - 84.9 0 -50.2 ±j35.9 105.1 -825.4 -39.8 -651.8 120 10 -64.9 ±j64.6 173.5 -947.9 -81.0 -651.8 163
Since the IM response shape can be analyzed through the Bode diagram, poles and zeros as well as the 3 dB bandwidths have been determined for Fig.
3(a), and the corresponding values are listed in Table I. Because z1 , p1 and p2 are much smaller than the
other poles and zeros, those play a dominant role in the IM response7. As seen in Fig. 3(a), the initial slope of the modulation response is 0 dB/decade. When the modulation frequency exceeds the zero value z , the 1
slope of the Bode diagram starts increasing until the frequency reaches the pole p . Because1 p is close 1
to z , only a relatively small peak is observed in the 1
modulation response. At larger modulation frequencies, the break-up point, which is related to the pole p 2
induces a decrease of the Bode diagram with a slope of -20 dB/decade. This dominant pole p can be used to 2
evaluate the 3 dB bandwidth such as 7:
3dB 3 2
f ≈ p (13)
We would like to note that since the modulation bandwidth can be enhanced by a high injection ratio, the impacts of frequency detuning and LEF are studied under strong optical injection (Rinj=10 dB). In Fig. 3(b)
with LEF=1, the modulation bandwidth is found almost insensitive to the values of the frequency detuning. A similar effect is pointed out in Fig. 3(c) at zero detuning for different values of the LEF. According to Eq. (13), this phenomenon can be attributed to the fact that the pole p is only slightly changed. However, it 2
is important to note that, the peak occurrence is predominant at the positive detuning edge and especially for large LEF values. This effect is related to the pole p2, which becomes closer to the imaginary
axis, and resulting in an under-damped modulation response.
1 10 100 1000 -12 -9 -6 -3 0 3 6 M o d u la ti o n r e s p o n s e ( d B ) Modulation frequency (GHz) Rinj= -10 dB Rinj= 0 dB Rinj=10 dB Free running
Detuning=0 GHz, LEF=1 (a)
1 10 100 1000 -12 -9 -6 -3 0 3 6 M o d u la ti o n r e s p o n s e ( d B ) Modulation frequency (GHz) Detunning=0 GHz Detunning=-10 GHz Detunning=10 GHz Free running Rinj=10 dB, LEF=1 (b) 1 10 100 1000 -12 -9 -6 -3 0 3 6 9 Mo d u la ti o n r e s p o n s e ( d B ) Modulation frequency (GHz) LEF=1 LEF=2 LEF=3 Free running Rinj=10 dB, Detuning=0 GHz (c)
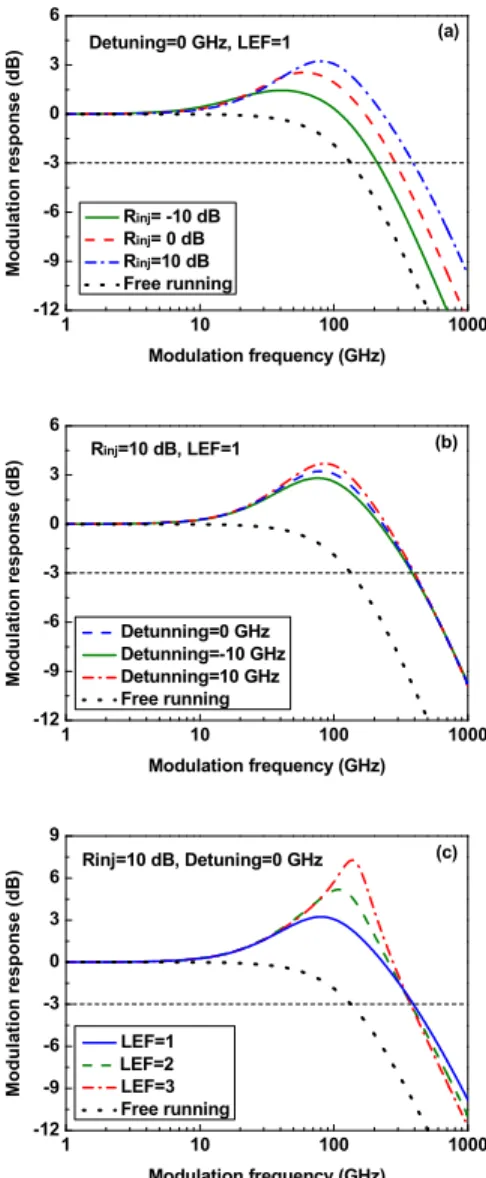
FIG. 4. IM response of optical injection-locked QCLs for slow carrier removal rate (τR=0.21 ps) as a function of (a) Injection ratio at zero detuning with LEF=1, (b) detuning frequency at Rinj=10 dB
with LEF=1, and (c) LEF at zero detuning with Rinj=10 dB.
B. IM response with slow carrier removal rate The carrier removal time is set to be τR=1.2 ps. Fig. 4(a)-(c) illustrate the optical injection-locking IM response of the QCLs as a function of the injection ratio Rinj=Sinj/S, frequency detuning and LEF,
respectively. The poles, zeroes and calculated 3 dB bandwidth related to Fig. 4(a) are listed in Table II.
TABLE II. Poles, Zeros and Bandwidths (GHz) for Fig. 4(a)
Rinj(dB) p1 p2 p3 p4 z1 z2 f3dB Free -26.5 -127.3±j26.0 -26.5 135 -10 -26.3 ±j6.1 -137.9±j20.0 -16.7 -26.5 212 0 -44.0 ±j25.3 106.9 -212.1 -39.9 -26.5 289 10 -69.9± -71.6 -418.0 -81.3 -26.5 393 j57.2
In Fig. 4(a) at zero detuning with LEF=1, both the peak magnitude and the bandwidth increase with the injection ratio. Under strong optical injection (Rinj=10
dB), the bandwidth (393 GHz) is about 3 times larger when compared to the free-running case (135 GHz). This strong enhancement is the consequence of the slow carrier removal rate making the zero z smaller 2
than the other poles. Thus, z when associated with 2
the small zero z leads to a peak arising in the IM 1
response. Similarly to the fast carrier removal rate case, the peak increases at positive detuning as depicted in Fig. 4(b) for Rinj=10 dB and with LEF=1. In Fig. 4(c), a
similar effect occurs for large LEF values under the zero detuning case with Rinj=10 dB. This effect is also
due to the pole p2, which becomes closer to the
imaginary axis in the pole-zero plot. Besides, both the frequency detuning and the LEF have little effect on the modulation bandwidth. Unlike injection-locked interband lasers18, it is important to stress that no pre-resonance frequency dip appears in the IM response both for the fast and the slow carrier removal rate cases. These results indicate that the dip, which is the major drawback limiting the 3-dB bandwidth of injection-locked interband lasers, does not occur in injection-locked QCLs. This major difference is due to the ultrafast carrier dynamics resulting from the intesubband transitions in the QCLs. The elimination of the pre-resonance frequency dip is always highly desirable to meet the broadband requirement for high-speed communications as well as for free-space short range communications.
V. CONCLUSIONS
Based on a simplified rate equation model, the optical injection-locked properties of QCLs have been investigated taking into account the influences of the LEF and the carrier removal rate. These preliminary stability analysis results are of prime importance for the improvements of the modulation properties of QCLs. Calculations show that the modulation bandwidth increases with the injection strength, with a 10 dB injection ratio, the bandwidth can be ~3 fold improved in comparison with the free-running laser. However, it is little impacted by the frequency detuning and the LEF. The magnitude of the peak in the IM response is found more sensitive at the positive frequency detuning condition especially for large LEF values. In comparison with conventional injection-locked interband semiconductor lasers, no pre-resonance frequency dip occurs in the QCLs’ IM response. Although these calculations demonstrate no unstable regime in the locking range, it has to be confirmed via a systematic nonlinear dynamics analysis. To this end, an enhanced rate equation model
will take into account the ground level from which electrons leave the active region into the injector of the next stage, but also gain compression as well as QCL periods, so as to emphasize the effects of the enhanced photon number in the laser cavity. Investigation of the optically-injected QCL spectral properties will be also in the context for future high performance oscillators, like low noise tunable photonic oscillators, in wavelengths from 3 to 5 microns, which can be enable multiple Radio Frequency photonics applications.
ACKNOWLEDGMENTS
The authors would like to thank Professor Carlo Sirtori and Dr. S. Barbieri of Université Paris Diderot-Paris 7, France as well as Professor Thomas Erneux from Brussels University Belgium for helpful discussions. Vassilios Kovanis work has been supported via the Electromagnetics portfolio of Dr. Arje Nachman of AFOSR.
1J. Faist, F. Capasso, D. L. Sivco, C. Sirtori, A. L. Hutchinson, A,
and Y. Cho, Science 264, 553 (1994).
2C. Gmachl, F. Capasso, D. L. Sivco, and A. Y. Cho, Rep. Prog.
Phys. 64, 1533 (2001).
3S. Kumar, IEEE J. Select. Topics Quantum Electron. 17, 38 (2011). 4N. Mustafa, L. Pesquera, C. Y. L. Cheung, and K. A. Shore, IEEE
Photon. Technol. Lett. 11, 527 (1999).
5C. Y. L. Cheung, P. S. Spencer, and K. A. Shore, IEEE proceedings
Optoelectronics 144, 44 (1997).
6K. Donovan, P. Harrison, and R. W. Kelsall, J. Appl. Phys. 89,
3084 (2001).
7M. K. Haldar, IEEE J. Quantum Electron. 41, 1349 (2005). 8F. Rana, and R. J. Ram, Phys. Review B 65, 125313 (2002). 9Y. Petitjean, F. Destic, J. C. Mollier, and C. sirtori, IEEE J.
Quantum Electron. 17, 22 (2011).
10R.Paiella, R. Martini, F. Capasso, and C. Gmachl, Appl. Phys. Lett.
79, 2526 (2001).
11S. Barbieri, W. Maineult, S. S. Dhillon, C. Sirtori, and J. Alton,
Appl. Phys. Lett. 91, 143510 (2007).
12W. Maineult, L. ding, P. Gellie, P. Filloux, and C. Sirtori, Appl.
Phys. Lett. 96, 021108 (2010).
13T. B. Simpson, J. M. Liu, M. Almulla, N. Usechak, and V.
Kovanis, in Frequency Control Symposium, 2012 IEEE International, Baltimore, USA, 21-24 May 2012, pp. 1-5.
14V. Kovanis, T. Erneux, and A. Gavrielides, Opt. Comm. 159, 177
(1999).
15A. Gavrielides, V. Kovanis, T. Erneux, Opt. Comm. 136, 253
(1997)
16A. Murakami, K. Kawashima, and K. Atsuki, IEEE J. Quantum
Electron. 39, 1196 (2003).
17E. K. Lau, H. K. Sung, and M. C. Wu, IEEE J. Quantum Electron.
44, 90 (2008).
18N. A. Naderi, M. Pochet, F. Grillot, N. B. Terry, V. Kovanis, and
L. K. Lester, IEEE J. Select. Topics Quantum Electron. 15, 1349 (2009).
19B. Meng, and Q. J. Wang, Optics Express 20, 1450 (2012). 20R. Lang, IEEE J. Quantum Electron. QE-18, 976 (1982).
21T. Erneux, V. Kovanis, A. Gavrielides, and P. M. Alsing, Phys.
Rev. A. 53, 4372 (1996).
22F. Mogensen, H. Olesen, and G. Jacobsen, IEEE J. Quantum
Electron. QE-21, 784 (1985).
23F. Capasso, R. Paiella, R. Martini, R. Colombelli, C. Gmachl, and
T. L. Myers, IEEE J. Quantum Electron. 38, 511 (2002).
24R. P. Green, J.H. Xu, L. Mahler, A. Tredicucci, and F. Beltram,
Appl. Phys. Lett. 92, 071106 (2008).
25T. Aellen, R. Maulini, R. Terazzi, N. Hoyler, M. Giovannini, and J.
Faist, Appl. Phys. Lett. 89, 091121 (2006).
26J. V. Staden, T. Gensty, and W. Elsaber, Optics Letters 31,