HAL Id: hal-02637431
https://hal.inrae.fr/hal-02637431
Submitted on 27 May 2020
HAL is a multi-disciplinary open access
archive for the deposit and dissemination of
sci-entific research documents, whether they are
pub-lished or not. The documents may come from
teaching and research institutions in France or
abroad, or from public or private research centers.
L’archive ouverte pluridisciplinaire HAL, est
destinée au dépôt et à la diffusion de documents
scientifiques de niveau recherche, publiés ou non,
émanant des établissements d’enseignement et de
recherche français ou étrangers, des laboratoires
publics ou privés.
Are local food chains more sustainable than global food
chains? Considerations for assessment
Gianluca Brunori, Francesca Galli, Dominique Barjolle, Rudolf van
Broekhuizen, Luca Colombo, Mario Giampietro, James Kirwan, Tim Lang,
Erik Mathijs, Damian Maye, et al.
To cite this version:
Gianluca Brunori, Francesca Galli, Dominique Barjolle, Rudolf van Broekhuizen, Luca Colombo, et
al.. Are local food chains more sustainable than global food chains? Considerations for assessment.
Sustainability, MDPI, 2016, 8 (5), 27 p. �10.3390/su8050449�. �hal-02637431�
sustainability
Article
Are Local Food Chains More Sustainable than Global
Food Chains? Considerations for Assessment
Gianluca Brunori1, Francesca Galli1,*, Dominique Barjolle2, Rudolf van Broekhuizen3, Luca Colombo4, Mario Giampietro5,6, James Kirwan7, Tim Lang8, Erik Mathijs9, Damian Maye6, Kees de Roest10, Carin Rougoor11, Jana Schwarz9, Emilia Schmitt2, Julie Smith8, Zaklina Stojanovic12, Talis Tisenkopfs13and Jean-Marc Touzard14
1 Department of Agriculture, Food and Environment, University of Pisa, 56124 Pisa, Italy;
gianluca.brunori@unipi.it
2 Sustainable Agroecosystems Group, Swiss Federal Institute of Technology Zürich ETH, 8092 Zürich,
Switzerland; barjolle@ethz.ch (D.B.); schmitte@ethz.ch (E.S.)
3 Rural Sociology Group, Wageningen University, 6708 PB Wageningen, The Netherlands;
rudolf.vanbroekhuizen@wur.nl
4 Fondazione Italiana per la Ricerca in Agricoltura Biologica e Biodinamica, 00153 Roma, Italy;
l.colombo@firab.it
5 Catalan Institution for Research and Advanced Studies (ICREA), 08010 Barcelona, Spain;
mario.giampietro@uab.cat
6 Spain and Institute of Environmental Science and Technology, Universitat Autònoma de Barcelona,
08193 Bellaterra, Spain; dmaye@glos.ac.uk
7 Countryside and Community Research Institute, University of Gloucestershire, Cheltenham GL50 2RH, UK;
jkirwan@glos.ac.uk
8 Centre for Food Policy, City University, London EC1V 0HB, UK; T.lang@city.ac.uk (T.L.);
juliesmith.juke@gmail.com (J.S.)
9 Division of Bioeconomics, Department of Earth and Environmental Sciences, KU Leuven, 3000 Leuven,
Belgium; erik.mathijs@kuleuven.be (E.M.); jana.schwarz@kuleuven.be (J.S.)
10 Centro Ricerche Produzioni Animali S.p.A.—C.R.P.A. S.p.A., 42121 Reggio Emilia, Italy; k.de.roest@crpa.it 11 Centre for Agriculture and Environment Foundation (CLM), 4104 BA Culemborg, The Netherlands;
crougoor@clm.nl
12 Faculty of Economics, University of Belgrade, 11000 Belgrade, Serbia; zaklina@ekof.bg.ac.rs 13 Baltic Studies Centre, LV1014 Riga, Latvia; talis.tisenkopfs@lu.lv
14 Inra, UMR Innovation, 34060 Montpellier, France; touzard@montpellier.inra.fr
* Correspondence: francesca.galli@for.unipi.it; Tel.: +39-050-221-8975 Academic Editor: Iain Gordon
Received: 10 March 2016; Accepted: 2 May 2016; Published: 6 May 2016
Abstract:This paper summarizes the main findings of the GLAMUR project which starts with an apparently simple question: is “local” more sustainable than “global”? Sustainability assessment is framed within a post-normal science perspective, advocating the integration of public deliberation and scientific research. The assessment spans 39 local, intermediate and global supply chain case studies across different commodities and countries. Assessment criteria cover environmental, economic, social, health and ethical sustainability dimensions. A closer view of the food system demonstrates a highly dynamic local–global continuum where actors, while adapting to a changing environment, establish multiple relations and animate several chain configurations. The evidence suggests caution when comparing “local” and “global” chains, especially when using the outcomes of the comparison in decision-making. Supply chains are analytical constructs that necessarily—and arbitrarily—are confined by system boundaries, isolating a set of elements from an interconnected whole. Even consolidated approaches, such as Life Cycle Assessment (LCA), assess only a part of sustainability attributes, and the interpretation may be controversial. Many sustainability attributes are not yet measurable and “hard” methodologies need to be complemented by “soft” methodologies which are at least able to identify critical issues and trade-offs. Aware of these limitations, our research shows that comparing local and global chains, with the necessary caution, can help overcome a priori
Sustainability 2016, 8, 449 2 of 27
positions that so far have characterized the debate between “localists” and “globalists”. At firm level, comparison between “local” and “global” chains could be useful to identify best practices, benchmarks, critical points, and errors to avoid. As sustainability is not a status to achieve, but a never-ending process, comparison and deliberation can be the basis of a “reflexive governance” of food chains.
Keywords: local; global; food supply chain; sustainability; assessment; reflexive governance; post-normal science
1. Introduction
Sustainability has become an arena of competition among firms. Given the growth of the “concerned consumers” segment [1], who care for the environment and other social and ethical attributes when they make their consumption choice, firms tend to respond by linking values and symbols to commodities, trying to engage consumers in long-term relationships based on trust and on shared value [2]. In the food sector, a diffuse perception of the unsustainability of “big food” [3,4] has opened the way to a myriad of “local food” initiatives, often supported by regional and national governments. The “local” has been frequently associated with sustainable and healthy production and consumption patterns [5,6], fostering the growth of product niches and allowing “weak” actors in the system—in particular, farmers—to challenge “big food” with alternative principles, values, organizational patterns and business models [7]. Local products are sustained by consumers’ willingness to pay a higher price, as they believe that the price of local products, unlike “big food”, covers the “real cost” of food that entails social and environmental costs of production, processing and distribution [8,9]. More than two decades after the birth of local food movements, the appeal of local food among consumers is strong [10]. To address this trend, conventional food actors have started to develop strategies that embody the local. These strategies are often mere “local washing”, but in many cases are part of coherent sustainability strategies [11,12]. As “local” and “sustainable” products can be increasingly found on supermarket shelves, i.e., actors of more “global” food systems, the need for clarity on definitions and on claims about local and global food grows. In recent years, a blossoming of initiatives aimed at signalling to consumers sustainable or local products can be witnessed: the European Union has introduced a requirement for compulsory information on product origin on labels for some fresh commodities [13]; retailers dedicate distinguished spaces to fresh local produce; and food producers offer consumers the possibility of acknowledging the origin of the ingredients of food products through Internet applications.
As a consequence of increasing exposure to these issues, there is a growing need for tools that enable consumers—and other decision makers—to filter and validate information, so that they can make more informed choices. This paper, which synthetizes the main findings of a European-wide project, GLAMUR (Global and Local food chain Assessment: a Multidimensional performance-based approach), addresses this need. The project has departed from concerned consumers’ daily dilemmas facing food choice: cheap or environmentally friendly? Conventional local or global organic? Seasonal or sourced overseas? The modern consumer choices become more complicated when various sustainability dimensions are considered and weighted: economical, ecological, social, ethical, health. In particular, it addresses a question that has a lot of implications: is “local” more sustainable than “global”? This apparently innocent question opens the door to a series of epistemological conundrums,
addressed by a growing stream of academic literature.
Sustainability assessment is one of the most complex types of appraisal because it entails multidisciplinary, cultural and value-based elements. Empirical applications—in the review by Gasparatos and colleagues [14]—rely on “frameworks”, i.e., integrated procedures containing a number of prescribed stages, and “tools”, i.e., analytical techniques that can be used to conduct
Sustainability 2016, 8, 449 3 of 27
analyses/comparisons within frameworks [15]. Examples of tools include economic tools (e.g., cost benefit analysis, whole life costing), biophysical models (e.g., material flow analysis, ecological footprint, energy accounting), indicator lists/composite indices and Multi-Criteria Analysis (MCA) [16]. Among indicator tools, a valuable example is provided by FAO, who has developed and tested a universal framework for Sustainability Assessment of Food and Agriculture systems (SAFA) which can be adapted to single enterprises and extended to the supply chain level [17]. However, none of the metrics and tools discussed seem to be capable of assessing the progress towards sustainability in a holistic manner. The need to address environmental, social and economic issues in an equitable manner determines problems that none of the above approaches can tackle individually in an adequate way. Even though they provide complementary snapshots of the same picture, it can be argued that they are unable to capture the whole picture [16].
New science–society interactions are crucial and lead to multiple forms of knowledge and to the synthesis of theory and practice, intended to resolve pressing societal problems through collaboration among scientists from different academic disciplines and with other stakeholder groups (business, government and civil society) [18]. There is an increasing effort to develop sustainability assessment frameworks in line with the principles of sustainable science: holistic approach, transdisciplinarity, normative function, promoting social learning, dealing with uncertainties [19]. The GLAMUR project has tried to apply these principles, taking sustainability assessment as a component of a wider process of deliberation and learning involving firms, civil society organizations, citizens and public administrations into a “reflexive governance” framework, aimed at anticipating unintended consequences of choice through an “open” process of appraisal [20] of the food chain and develop a coherent commitment to sustainability [21].
This paper proceeds as follows: Section 2 provides an overview of the methodology—a cross-country and cross-sector case study approach—adopted within the GLAMUR project. Section3
proceeds by providing a general overview of the results of the assessment, to focus on a comparative analysis to highlight the main drivers of the sustainability performances of the supply chains analysed. Section4discusses the main implications of the research and concludes.
2. Methodology
A starting point for our research is the awareness that the three conventional dimensions of sustainability (social, economic and environmental) do not fully cover the range of impacts of food. Human health, for example, may come under the topic of social sustainability, but in this way its relevance is obscured and often overlooked. A large body of literature has recently emphasized the systemic impact of food chain configurations on health and the link between diets and sustainability [22]. The same can be said with regard to ethics: on the one hand, these cover most of the sustainability attributes but, on the other hand, need specific heuristics when assessing the intention of chain actors to address sustainability [23].
In order to identify a wide range of sustainability criteria for assessment, we carried out a media analysis exercise, integrated with a Delphi survey, which led to the identification of 24 sustainability attributes [24]. Each attribute is the synthesis of a cluster of keywords emerging from the debate within “spheres of discourse”—spaces of communication characterised by actors, the media and discourses ([24] (p. 12))—giving “voice” also to a variety of media sources (policy documents, general media, market communication). In this way, we aimed at identifying areas of concern that the scientific community had not yet considered [24]. The attributes are listed in a “sustainability matrix” shown in Table1, below.
Each attribute in the matrix covers a broad set of impacts, often place and product-specific. For example, when considering “labour relations”, one should take into consideration salaries, labour quality, security, duration of contracts, presence of written contracts, etc. This set of attributes represents a conceptual and practical tool that can be used by actors of local and global chains to reflect on their performance from a multidimensional perspective and in a systematic way.
Sustainability 2016, 8, 449 4 of 27
Table 1.Multi criteria performance matrix and 24 attributes.
Composite Matrix
Economic Social Environmental Health Ethical
1. Affordability 7. Food security 12. Resource use 17. Nutrition 20. Animal welfare 2. Creation & distribution
of added value
8. Consumer
behaviour 13. Pollution 18. Food safety 21. Responsibility 3. Economic development 9. Territoriality 14. Biodiversity 19. Traceability 22. Fair trade 4. Efficiency 10. Connection 15. Technologicalinnovation 23. Information &communication 5. Profitability 11. Labour
relations 16. Food waste 24. Governance
6. Resilience
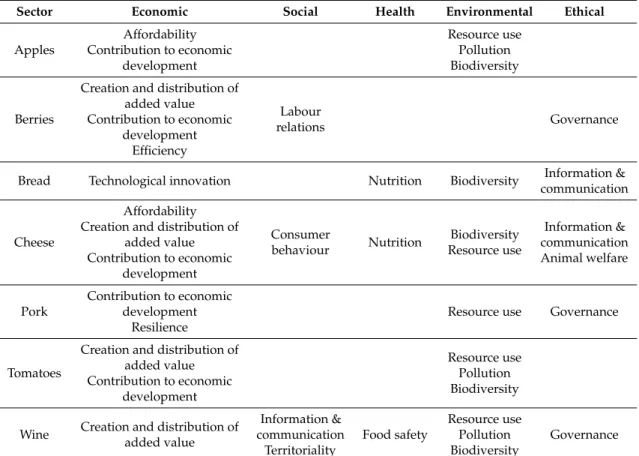
The performance assessment compared and contrasted the economic, social, ethical, health and environmental impacts of 39 food supply chains belonging to different sectors. Table2provides an overview of the attributes investigated in each sector.
Table 2.Overview of sectors and attributes investigated within case studies.
Sector Economic Social Health Environmental Ethical
Apples Affordability Contribution to economic development Resource use Pollution Biodiversity Berries
Creation and distribution of added value Contribution to economic development Efficiency Labour relations Governance
Bread Technological innovation Nutrition Biodiversity Information & communication
Cheese
Affordability Creation and distribution of
added value Contribution to economic development Consumer behaviour Nutrition Biodiversity Resource use Information & communication Animal welfare Pork Contribution to economic development Resilience
Resource use Governance
Tomatoes
Creation and distribution of added value Contribution to economic development Resource use Pollution Biodiversity
Wine Creation and distribution of added value Information & communication Territoriality Food safety Resource use Pollution Biodiversity Governance
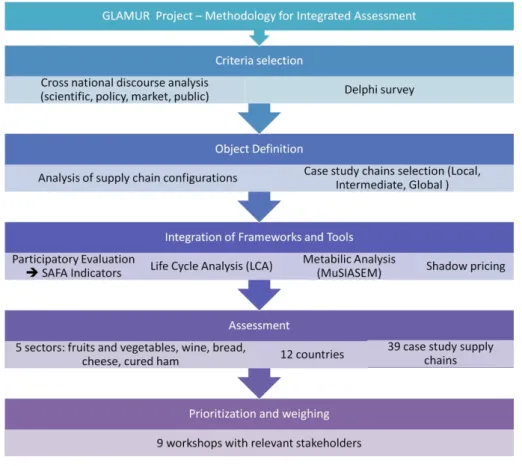
Figure1summarises the main steps of the methodology adopted by the Glamur project.
National teams selected at least two supply chain case studies for each commodity group, one with “local” characteristics and one with “global” characteristics. A “thick description” of each supply chain was then carried out, aimed at identifying the main characteristics that differentiate “local” from “global” chains and that may have an impact on sustainability performance. The classification of supply chains into “local” and “global” has proven much more challenging than expected, so that a series of intermediate supply chains have also been taken into consideration. For each commodity, two teams from different countries selected a common set of relevant attributes and developed common indicators for measurement. Each attribute was assessed through one or more indicators, measured through a
Sustainability 2016, 8, 449 5 of 27
variety of methods, both qualitative and quantitative. A meta-evaluation of the different methodologies adopted to assess the attributes within each case study was performed [25]. For each product group, at least two “local” and two “global” chains were analysed, and a cross-country assessment of the sustainability performance of local and global supply chains was carried out [26]. Finally, participatory assessment exercises were developed with researchers and supply chains’ stakeholders to understand the priorities among sustainability dimensions’ attributes and indicators: the outcomes of the case studies provided the input for a series of stakeholders’ workshops, the aim of which was to check the validity of basic pre-analytical choices of the project [27]. The design of each workshop and the methods used were diverse and tailored to the specificity of each case. In most workshops, a ranking exercise has been carried out, aimed at assessing the hierarchy of importance of different attributes (see for example the Italian bread case, published in this special issue [28]).
Sustainability 2016, 8, 449 5 of 26
series of stakeholders’ workshops, the aim of which was to check the validity of basic pre‐analytical choices of the project [27]. The design of each workshop and the methods used were diverse and tailored to the specificity of each case. In most workshops, a ranking exercise has been carried out, aimed at assessing the hierarchy of importance of different attributes (see for example the Italian bread case, published in this special issue [28]).
Figure 1. Steps of the Glamur methodology for integrated sustainability assessment.
3. Results
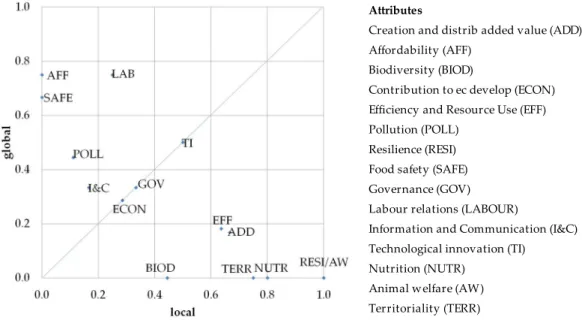
An extreme synthesis of our assessment exercise is reported in Figure 2, which provides an overall representation of the performance of local and global supply chains as measured in the country reports of the project. Appendix A shows the indicators chosen by the research teams to measure supply chains performances. Detailed results for each case study can be found in this special issue and in the project reports, as indicated in Appendix B. Figure 2, which we use as a starting point for our methodological discussion, shows where “local” and “global” chains perform better in the case studies, for each attribute selected. The coordinates of each attribute indicate how many times the local chain prevails over the global chain (and vice versa), relative to the number of comparisons in which that attribute has been considered. The “prevalence” means that the authors of the case study make a clear cut statement on the performance based on their assessment. On the bisecting line, local chains and global chains prevail an equal number of times for the given attribute.
Figure 1.Steps of the Glamur methodology for integrated sustainability assessment. 3. Results
An extreme synthesis of our assessment exercise is reported in Figure2, which provides an overall representation of the performance of local and global supply chains as measured in the country reports of the project. Appendix A shows the indicators chosen by the research teams to measure supply chains performances. Detailed results for each case study can be found in this special issue and in the project reports, as indicated in Appendix B. Figure2, which we use as a starting point for our methodological discussion, shows where “local” and “global” chains perform better in the case studies, for each attribute selected. The coordinates of each attribute indicate how many times the local chain prevails over the global chain (and vice versa), relative to the number of comparisons in which that attribute has been considered. The “prevalence” means that the authors of the case study make a clear cut statement on the performance based on their assessment. On the bisecting line, local chains and global chains prevail an equal number of times for the given attribute.
Sustainability 2016, 8, 449 6 of 27 Sustainability 2016, 8, 449 6 of 26 Attributes Creation and distrib added value (ADD) Affordability (AFF) Biodiversity (BIOD) Contribution to ec develop (ECON) Efficiency and Resource Use (EFF) Pollution (POLL) Resilience (RESI) Food safety (SAFE) Governance (GOV) Labour relations (LABOUR) Information and Communication (I&C) Technological innovation (TI) Nutrition (NUTR) Animal welfare (AW) Territoriality (TERR) Figure 2. Performance of local and global chains on attributes selected for cross country case study assessment. The figure shows that there are no best performing chains: each of the analysed “local” chains performs better than the “global” counterpart for some attributes, while for other attributes, the “local” chain performs worse. However, this only confirms that it is impossible to establish a clear superiority of any of the two ideal types, as the results are strongly dependent on the context, on the actual behaviour of supply chain actors, on the assessment methodologies, and on the perception of external observers. This apparently trivial—but very politically relevant—statement implies that, when embarking in widespread comparisons, strong attention should be dedicated to the analysis of the links between the characteristics of the supply chains and their performance. In the following sections, we present and discuss the characteristics of the food supply chains that, according to our research, are relevant to detect the differences between “local” and “global” chains when comparing their sustainability performance. The characteristics identified are: spatial configurations, product identity, physical distance, size of operations, governance of the chain, and technologies and resources. 3.1. Spatial Configurations
Spatial configurations are shaped by the activities that characterise the supply chain and the extent to which they are localised. The spectrum of spatial configurations analysed through the case studies shows an impressive variety (Table 3), ranging from radically localised chains (on‐farm processed products sold to local consumers) to radically globalized chains. Rather than a dichotomy between local and global, the research has shown a highly dynamic local–global continuum. Various cases in between local and global reveal the dynamism in both local and global chains. Intermediary chains emerge as a response to new food system opportunities, sometimes an outcome of malfunctioning of existing chains. The following two cases show the “purest” examples of “local” and “global”, respectively. A truly local chain. Floriddia farm, based in Italy, produces bread with flour from ancient varieties of wheat, which are more suitable to organic agriculture practices. Cultivation of the wheat, milling and baking are all done on farm. The bread is sold mostly at a regional and local level: directly from the farm itself, to local bakeries and to the GAS (Gruppi di Acquisto Solidale, i.e., solidarity purchasing groups); the latter regularly prepare their orders through the online catalogue and the e‐commerce service that is available on the website. On‐line sales have also been activated, directed to the national territory.
Figure 2.Performance of local and global chains on attributes selected for cross country case study assessment.
The figure shows that there are no best performing chains: each of the analysed “local” chains performs better than the “global” counterpart for some attributes, while for other attributes, the “local” chain performs worse. However, this only confirms that it is impossible to establish a clear superiority of any of the two ideal types, as the results are strongly dependent on the context, on the actual behaviour of supply chain actors, on the assessment methodologies, and on the perception of external observers. This apparently trivial—but very politically relevant—statement implies that, when embarking in widespread comparisons, strong attention should be dedicated to the analysis of the links between the characteristics of the supply chains and their performance.
In the following sections, we present and discuss the characteristics of the food supply chains that, according to our research, are relevant to detect the differences between “local” and “global” chains when comparing their sustainability performance. The characteristics identified are: spatial configurations, product identity, physical distance, size of operations, governance of the chain, and technologies and resources.
3.1. Spatial Configurations
Spatial configurations are shaped by the activities that characterise the supply chain and the extent to which they are localised. The spectrum of spatial configurations analysed through the case studies shows an impressive variety (Table3), ranging from radically localised chains (on-farm processed products sold to local consumers) to radically globalized chains. Rather than a dichotomy between local and global, the research has shown a highly dynamic local–global continuum. Various cases in between local and global reveal the dynamism in both local and global chains. Intermediary chains emerge as a response to new food system opportunities, sometimes an outcome of malfunctioning of existing chains. The following two cases show the “purest” examples of “local” and “global”, respectively. ‚ A truly local chain.
Floriddia farm, based in Italy, produces bread with flour from ancient varieties of wheat, which are more suitable to organic agriculture practices. Cultivation of the wheat, milling and baking are all done on farm. The bread is sold mostly at a regional and local level: directly from the farm itself, to local bakeries and to the GAS (Gruppi di Acquisto Solidale, i.e., solidarity purchasing groups); the latter regularly prepare their orders through the online catalogue and the e-commerce service that is available on the website. On-line sales have also been activated, directed to the national territory.
Sustainability 2016, 8, 449 7 of 27
Floriddia has received many enquiries from importers in other countries, but has chosen not to export, as this may undermine the coherence of their business model [29].
‚ A truly global chain.
The VION Good Farming Global business, in the Netherlands, relies heavily on global resource flows, especially soy and other fodder inputs, but increasingly also exports transformed manure surpluses from the pig farms. The international nature of this concept is further manifest in VION’s multiple slaughterhouse locations and processing facilities throughout Europe; in addition, the globalization of the labour force in these slaughter and processing facilities is impressive, where Eastern European workers are now prevalent. Moreover, VION relies on global energy inputs, technology, ICT applications and linkages with global operating pharmaceutical industries [30].
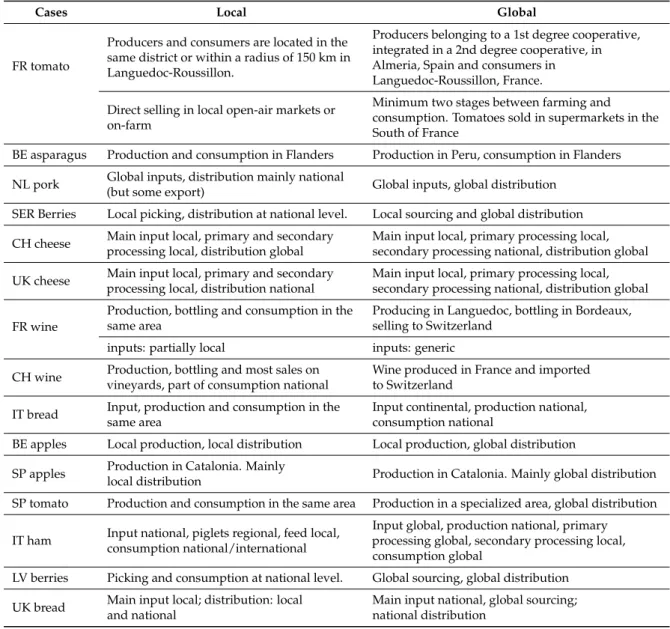
Table 3.Geographical profile of GLAMUR case studies.
Cases Local Global
FR tomato
Producers and consumers are located in the same district or within a radius of 150 km in Languedoc-Roussillon.
Producers belonging to a 1st degree cooperative, integrated in a 2nd degree cooperative, in Almeria, Spain and consumers in Languedoc-Roussillon, France. Direct selling in local open-air markets or
on-farm
Minimum two stages between farming and consumption. Tomatoes sold in supermarkets in the South of France
BE asparagus Production and consumption in Flanders Production in Peru, consumption in Flanders NL pork Global inputs, distribution mainly national
(but some export) Global inputs, global distribution SER Berries Local picking, distribution at national level. Local sourcing and global distribution CH cheese Main input local, primary and secondary
processing local, distribution global
Main input local, primary processing local, secondary processing national, distribution global UK cheese Main input local, primary and secondary
processing local, distribution national
Main input local, primary processing local, secondary processing national, distribution global FR wine
Production, bottling and consumption in the same area
Producing in Languedoc, bottling in Bordeaux, selling to Switzerland
inputs: partially local inputs: generic CH wine Production, bottling and most sales on
vineyards, part of consumption national
Wine produced in France and imported to Switzerland
IT bread Input, production and consumption in the same area
Input continental, production national, consumption national
BE apples Local production, local distribution Local production, global distribution SP apples Production in Catalonia. Mainly
local distribution Production in Catalonia. Mainly global distribution SP tomato Production and consumption in the same area Production in a specialized area, global distribution IT ham Input national, piglets regional, feed local,
consumption national/international
Input global, production national, primary processing global, secondary processing local, consumption global
LV berries Picking and consumption at national level. Global sourcing, global distribution UK bread Main input local; distribution: local
and national
Main input national, global sourcing; national distribution
In most cases, it was very hard to make a clear-cut distinction between local and global. Economic actors tend to have a multiplicity of trade relations, and in any chain it is possible to find actors who participate in a plurality of configurations.
In the Serbian raspberry industry (Figure3) [31] all farmers sell to intermediaries, who have a central role in the network as they have trade relationships with retailers, processors and foreign
Sustainability 2016, 8, 449 8 of 27
importers. The numbers indicate different types of relationships—(1) information exchanges; (2) trade and (3) collaboration—between the stakeholders. However, some farmers are able to sell part of their produce to “green markets”, or to process the raspberries on farm to make juices or traditional food [31]. Sustainability 2016, 8, 449 8 of 26 Figure 3. Local and global chains for raspberries in Serbia and their interconnections [31]. Of particular interest is the “locality chain” category that sets the geographical limits of some inputs and production while keeping other inputs (energy, seeds, sometimes feed) or sales global. An example of such a chain is shown in Figure 4. A locality chain. L’Etivaz cheese is produced in the Canton of Vaud, in specific municipalities located between 1000 and 2000 meters altitude. It obtained the PDO status in 1999. Most of the resources used are local. The ripening phase is located in the Pays d’Enhaut region. Thus, production is limited to a small zone, whereas retail and consumption extend beyond the national borders. Producers are allowed to retail 10% of their own production at their chalets. The remaining 90% are sold to “La Maison de L’Etivaz” and then on to exporters and retailers. Around 70% of the total volume is sold in Switzerland, 40% in the French speaking part. The remaining 30% is sold mostly in France, Belgium and Germany. Upstream from the chain, the cattle are mostly fed on alpine meadows. However, concentrated feedstuffs, such as cereals and soy that come from Europe, Argentina and Brazil are authorized up to a maximum of 1 kilogram per cow per day. Global inputs are also used in processing, as for example the rennet necessary for the cheese making is purchased on global markets [32].
“Local” and “global” labels may be misleading if not related to the organizational history of the chain. “Locality” chains are in most cases related to PDO (Protected Designation of Origin) and PGI (Protected Geographical Indication) labels under the EU regulations, which underpin a clear link between quality and geographical origin and specify specific codes of practice. If we look at the evolution of these chains, we normally observe traditional products that have undergone a process of modernisation in recent years and that, under the present market trends and existing regulations, tend to differentiate by stressing their local characteristics. The L’Etivaz case suggests that we may witness the emergence of value chains that connect rather small localities and places on a wide territorial scale.
Among our case studies we also identified “globalising” chains, as in the case of apples in Flanders.
Figure 3.Local and global chains for raspberries in Serbia and their interconnections [31].
Of particular interest is the “locality chain” category that sets the geographical limits of some inputs and production while keeping other inputs (energy, seeds, sometimes feed) or sales global. An example of such a chain is shown in Figure4.
‚ A locality chain.
L’Etivaz cheese is produced in the Canton of Vaud, in specific municipalities located between 1000 and 2000 meters altitude. It obtained the PDO status in 1999. Most of the resources used are local. The ripening phase is located in the Pays d’Enhaut region. Thus, production is limited to a small zone, whereas retail and consumption extend beyond the national borders. Producers are allowed to retail 10% of their own production at their chalets. The remaining 90% are sold to “La Maison de L’Etivaz” and then on to exporters and retailers. Around 70% of the total volume is sold in Switzerland, 40% in the French speaking part. The remaining 30% is sold mostly in France, Belgium and Germany. Upstream from the chain, the cattle are mostly fed on alpine meadows. However, concentrated feedstuffs, such as cereals and soy that come from Europe, Argentina and Brazil are authorized up to a maximum of 1 kilogram per cow per day. Global inputs are also used in processing, as for example the rennet necessary for the cheese making is purchased on global markets [32].
“Local” and “global” labels may be misleading if not related to the organizational history of the chain. “Locality” chains are in most cases related to PDO (Protected Designation of Origin) and PGI (Protected Geographical Indication) labels under the EU regulations, which underpin a clear link between quality and geographical origin and specify specific codes of practice. If we look at the evolution of these chains, we normally observe traditional products that have undergone a process of modernisation in recent years and that, under the present market trends and existing regulations, tend to differentiate by stressing their local characteristics. The L’Etivaz case suggests that we may witness the emergence of value chains that connect rather small localities and places on a wide territorial scale.
Sustainability 2016, 8, 449 9 of 27
Sustainability 2016, 8, 449 9 of 26
Figure 4. L’Etivaz value chain spreading between the local and the global scale.
Sustainability 2016, 8, 449 10 of 27
‚ A globalising chain.
Throughout history, horticulture has always been an important part of the territory of Flanders because of the good quality of the soils in the regions where the apples are grown. Apples are therefore perceived by many as a regional product. This is emphasized in the global chain by the “Flandria” label. The best quality apples are sold under this label in national and international markets. Apples—of “global” varieties such as Jonagold, Golden delicious and Elstar—are delivered by farmers to the Belgian fruit auction, the biggest fruit auction in Flanders, with a market share of more than 50 percent. The apples are bought at the auction by big retailers—Carrefour, Colruyt and Delhaize—who have a 70 percent market share among them. Apples are also exported to the Netherlands, Germany and Russia [33].
Food chain configurations may change in relation to fluctuating market conditions and/or as an outcome of the strategic choices of the leading actors involved. In some cases, leading companies can decide to adopt localisation strategies as a component of a broader differentiation strategy. The possibility of claiming that a product has a local component becomes a factor of competitive advantage for producers.
‚ A localising chain.
The “Tuscan bread” initiative was promoted by a Tuscany miller, who applied to the Regional Rural Development Plan for a cooperation measure. The code of practices agreed with farmers and bakeries limits the sourcing of wheat to the Tuscan territory. The localisation strategy pursued by the Tuscan Bread Consortium includes the recognition of the PDO and all operations must take place in Tuscany. The intention of the network is to sell this product on the global market [29,34].
3.2. Product Identity
A strong local identity is an asset that can be used in market competition. Local origin is a powerful source of differentiation, but to further mark the difference, actors in local chains adopt strategies based on a mix of actions. For example, when considering the genetic diversity of tomatoes, “global chains impose criteria of functional quality that impact breeding, cultivation culture and distribution systems [35]: (i) homogeneous aspect of the product; (ii) resistance to shocks; (iii) long conservation and maintenance of a good appearance on the shelves; (iv) long-term availability of the product during a long period. Choice of varieties, cultural season, stage of maturity at harvest and modes of transportation and conservation is made regarding these quality criteria” [36]. Local and traditional varieties often do not correspond to these criteria, and therefore they are not of interest to global players. Local players adopt local varieties to address the taste of smaller segments of consumers who prefer unconventional characteristics.
The case of “Cinta Senese” pork in Italy shows a chain configuration built around a local pork breed. “Cinta Senese” ham is clearly recognizable from conventional breeds, but the difference is emphasized more when pigs are reared in the forest, so that their diet differs substantially from conventional breeds [37]. Gloucester cheese in the UK requires farmers to have some endangered Gloucester breed among cattle in their herd [38]. In other cases, as we have seen with apples in Belgium and Spain, local and traditional varieties are not an option, as local and global chains adopt the same “global” varieties [33,39].
In several case studies (such as bread in Italy [34], apples in Belgium [33], tomatoes and wine in France [36,40]), local producers adopt organic certification as another strategy for differentiation.
In the case of berries in Serbia, the local produce is characterised by its freshness, as global chains trade frozen produce [31]. In the case of PDO and PGI products, codes of practices are designed and updated to mark the differences. Local wine in Switzerland, for example, is produced with a restriction on the quantity of grapes that can be harvested per ha [41]. L’Etivaz cheese production rules require that unpasteurized milk should be used, and that to heat the milk copper boilers over a wood fire should be used [32].
Sustainability 2016, 8, 449 11 of 27
When differentiation is not obtained through product characteristics, chain organization may help to regulate information flows by attaching symbols, values and stories to products to help make them unique. Short food chains adopted by Spanish and French tomatoes, Belgian apples, bread in Italy and Cheddar in the UK, mobilise farmers to testify the localness and authenticity of the product. Unlike producers involved in global chains, local wine producers in France are more involved in local cultural or gastronomic events, fairs, tourism projects. However, not all local chains are able to develop a strong local identity. This is the case of blueberries in Latvia, where local chains are largely informal economies; it happens similarly to generic bread in Italy, where it is normal for artisanal bakeries to source their flour from spot markets.
3.3. Physical Distance
In the literature, a distinction between physical distance and social distance in food value chains is made, as physical distance is not always able to capture the specificity of local food chains [42]. Here, we consider only physical distance, as we refer to social distance when considering governance issues in Section3.5. The question we addressed is: is physical distance a factor that affects sustainability performance?
With regard to the economic and social dimensions, a positive impact of long distances may be related to a reduction in the pressure on local resources and the generation of welfare in the regions being traded with. In the case of berries in Latvia and Serbia, for example, the supply of berries is much greater than domestic demand, so that export is an important source of employment and income. A short distance between producers and consumers is used as a differentiation strategy. A growing number of consumers have a preference for “0-miles products”, as in the case of apples in Belgium, bread in Italy, and tomatoes in Spain and France. This happens especially in contexts where global chains dominate the market, so that local products meet the need for novelty and authenticity. This preference is often associated with the development of networks where producers and consumers undergo relations of proximity. Short distances can be relevant for producers as these impacts can result in greater competitiveness and may have a transformative role when local products carry with them symbols and values that challenge the dominant discourse in relation to sustainability issues. Voluntary constraints on external sourcing—in other words, reducing distances between input production and their use—creates artificial scarcity that can be turned into a competitive advantage, as it helps producers to differentiate their product; the case of Tuscan bread is a case in point. On the other hand, it may cause the over-exploitation of local resources or too much demand for the product. In the Cinta Senese ham case, local stakeholders had to solve an emerging problem of the intensive use of forests where Cinta Senese pigs are normally reared [37].
With regard to the social and ethical dimensions, long-distance trade often implies a loss of information on the product: asymmetric information that results from it is one of the causes of power concentration along the chain. In the Serbian and Latvian cases, berries are exported globally. This implies a strong centrality of intermediate actors (wholesalers and importers), and the loss of product identity. Consumers, in fact, are not aware of where the berries they consume have come from. However, adequate traceability systems can address this problem, as in the case of fresh asparagus from Peru sold in Belgian Supermarkets, where asparagus by law must be labelled with clear information that states origin of production. Physical distance affects animal welfare in relation to transport. In the Dutch pork case, distances from farm to slaughterhouse are included as parameters for animal welfare performance. However, animal welfare related to transportation can depend more on transport technologies than on distance.
When considering the environmental dimension, long-distance trade may contribute to the extraction of resources in resource-scarce places, or places with poor governance, contributing to territorial inequality: it amplifies the effects of power asymmetries within and among countries. The asparagus case, produced in Peru and consumed in Belgium, shows that asparagus production requires much more water in Peru than in Flanders. The water footprint per kg of asparagus is 1137 m3
Sustainability 2016, 8, 449 12 of 27
in Peru and 889 m3in Flanders [43]. However, it is not possible to generalise this result, as in other cases long distance trade may reduce the pressure on the scarce resources of destination countries, while tapping on abundant resources in the country of origin, as in the case described in the literature on New Zealand lamb [44]. Longer transport distances may also require a surplus of energy costs. According to Edward-Jones [45], air freight has a carbon footprint ten times higher than a truck, although it becomes a controversial issue, if considering the construction and maintenance of roads that airplanes do not require [46]. Practically all fresh asparagus exported from Peru to Europe is transported by airplane, as the product is easily perishable and needs to reach the overseas market in good time. In this case, the environmental impact per unit of product delivered may be large. In the asparagus case study (see Schwarz et al. [47] in this special issue) it is estimated that transport-related GHG emissions of Peruvian asparagus (exported to Belgium) are 11.12 CO2-eq./kg. The local Belgian
chain only emits 0.03 CO2-eq./kg. When comparing apples consumed in Belgium, New Zealand
apples show a worse environmental performance than Belgian apples [48]. However, the case of tomatoes in both Spain and France show that longer distances may be compensated by more efficient logistics. Long distance transport also implies the transportation of diseases [24].
3.4. Size of Operations
There are three drivers that affect the size of operations within the supply chain. The first driver is demand, which tends to generate pressure for growth. Given the existing distribution structure, based on large-scale retailers, firms tend to concentrate production in order to be able to respond to large-scale orders. The second driver is the presence of economies of scale, which allow for a reduction of costs per unit of production. The third driver is diversity of consumers’ tastes and needs. High demand diversity tends to reduce the size of operations, as it stimulates product and chain differentiation, while demand homogeneity tends to favour mass production.
Given the tension between these three drivers, there is a strong correlation between localness and size of operations within the chain. Local chains are in fact networks of small and medium enterprises that tap into local inputs and knowledge, while at the same time contributing to their maintenance and reproduction. Specificity of local resources allows local chains to differentiate. At the same time, localness puts a limit on growth, especially if the main inputs are to be sourced locally. On the contrary, actors operating in global chains tend to be large enough to meet global demand. For this purpose, they establish large-scale operations, especially at the processing and distribution stages. The combination of the three drivers allows a variety of pathways. For example, demand and scale economies can put pressure on successful local products to grow. Geographical boundaries limit the growth of local chains, but there are several examples of “locality” products around which specialised production districts have grown, involving hundreds or sometimes thousands of small producers. Parma ham, Le Gruyère and several French and Italian wines combine localness and large-scale operations. However, in order to maintain this scale of operation, they have to source a relevant quantity of inputs from outside, as in the case of animal feed or seasonal labour. In other cases, global actors can be tempted to “relocalise” in order to capture the opportunities of differentiation, as in the case of a number of intermediate chains studied in the GLAMUR project.
Our assessment shows that the scale of operations can be positively related to several indicators used in this project to characterise sustainability performance. Scale economies can result in a substantial saving of energy, water and materials. This is the case of global bulk wine in France (see Touzard et al. [49] in this special issue and [50]), global apples in Spain [39] and Belgium [33], and global bread in Italy and the UK [29,51]. However, these operations generate intense flows of resources both from and to the outside: water, energy, materials, and labour. The impact of these flows is not easy to assess, as it has an indirect, remote and systemic nature. However, it is reasonable to suggest that the production capacity determined by large scale plants creates “rebound effects”: in order to break-even, firms have to produce near to full capacity, and this mobilizes large flows of resources even when they may become scarce. In this way, greater efficiency may be compensated for by a higher
Sustainability 2016, 8, 449 13 of 27
throughput. At the same time, larger scale production is not necessarily related to lower efficiency in terms of the use of resources: in the pork sector in the Netherlands, for example, the local chain, as a consequence of specific strategies, is more efficient than the global chain.
3.5. Governance of the Chain
The analysis of cases studies has shown that coordination of the food chain is a key aspect for assessment of both local and global chains. Similar configurations may have very different characteristics and performance outcomes in relation to different governance patterns. Governance regulates the stability of material and information flows: good governance preserves the territorial identity of a product, avoids the over-exploitation of local resources, facilitates access to external resources, and fairly distributes costs and benefits among involved stakeholders. Bad or weak governance, in a context of absence of regulation and lack of controls, is an indicator of bad performance, unpredictability and risk. An example of the link between sustainability and the degree of coordination is given by the case of industrial bread in Italy where Barilla wanted to produce bread with added wheat germ, which gives bread a higher nutritional quality. Wheat germ was available on the market, but after a chemical analysis of samples, the company made the decision not to carry on with this ingredient, as it found pesticides residues above limits in the samples. The global blueberry chain operator in Latvia introduced internal origin tracing procedures and laboratory tests to check chemical contents of wild blueberries, which was a precondition to supply for global pharmaceutical and food companies [52].
Public and private standards have spread throughout the competitive global food system, emphasising the intricate supply and demand relationships between different portions of the supply chain. Standards essentially serve the purpose of aiding governance of the food system across regions and sectors [53,54]. The development of extended quality and safety standards, according to a management systems approach, served the purpose of monitoring and evaluating the performance of the production process, characterising private standard schemes as meta-systems [55]. With a systems approach, standards need not be specific to an attribute or product. This implies an approach that is more amenable to being utilised as a governance tool in the food system than simple product performance criteria.
We can distinguish internal governance as interpreted by Gereffi and colleagues [56], from extended governance as conceptualized by Sacconi [57]. Internal governance focuses on transactions between firms within the chain, while extended governance refers to the distribution of duties and rights between the firms and stakeholders in a broader sense (i.e., including civil society and institutions).
Gereffi and colleagues [56] contribute to the theory on global value chains by drawing on three streams of literature: transaction costs economics [58], production networks [59] and technological capability and firm-level learning [60]. The authors identify internal governance arrangements that define five types of value chains: spot market, modular, relational, captive and hierarchy. Spot market refers to short-term contractual relations, in which coordination is mainly based on prices. Modular value chains are based on the presence of standards that regulate product specifications and reduce transaction costs between independent actors. Relational value chains are based on complex transactions between highly capable actors. In this type of chain, buyers need to establish longer-term relationships with suppliers to be able to obtain the required product specifications. In a captive chain, buyers impose their own product specifications and, especially in the presence of a low supplier capacity, give support and exert strong control over the chain. Finally, in value chains characterised by hierarchy, one firm manages operations internally.
Table4provides a non-comprehensive list—for illustrative purposes—of the variety of internal governance tools adopted by the GLAMUR local and global case studies.
Sustainability 2016, 8, 449 14 of 27
Table 4.Internal governance tools in local and global chains.
Internal Governance Tools
Local
PDO and PGI L’Etivaz (CH), Cinta Senese (IT), Tuscan bread (IT), Single Gloucester (UK)
Organic certification Stone mill bread (IT), Tomato (FR), Tomato (SP), Apples (BE),Pork (NL), Wine (FR), Apples (SP), L’Étivaz cheese (CH), Personal relationships Stone mill bread (IT), Tomato (FR), Tomato (SP), Apples (BE),
Wine (FR), Berries (LV), Berries (SER) Membership of small cooperatives Tomato (FR), Tomato (SP)
Global
PDO and PGI Wine (FR), Le Gruyère (CH)
Corporate brands and labels Pan Bauletto bread (IT),
Organic certification Apples (SP), Le Gruyère cheese (CH)
Global GAP Asparagus (BE), Apples (BE)
British Retail Consortium Bread (UK), Parma Ham (IT). Private labels Industrially-produced bread (UK) Environmental footprints Pan Bauletto bread (IT)
Nutrition metrics Pan Bauletto bread (IT), Global bread (UK), Creamery-scale cheese (UK)
Membership of large and 2nd
level cooperatives Le Gruyère (CH), Wine (FR) Environmental Product
Declaration (EPD) Pan Bauletto bread (IT)
Green label De Hoeve pork (NL)
Many actors of both local and global chains comply with formal standards such as ISO, HACCP, Global GAP, organic certification, and private labels. For instance, Pan Bauletto by Barilla (Italian global bread) adopts the Environmental Product Declaration (EPD), which allows transparent communication on the product footprint based on LCA methodology. The pork chain in the Netherlands Hoeve BV first adopted the national Green Label, but after a while it abandoned the scheme to adopt a new management system (i.e., Sustainable Pork Production), focusing on energy, antibiotics and odour reduction to get more added value. When there is a large difference in size and numbers between farmers and processors or retailers, governance is often enforced through intermediary organizations, such as cooperatives, wholesalers and importers. Cooperatives play a key role in facilitating the access to market of small farmers. In some cases, cooperatives are the “gatekeepers” of big companies to small farmers. In Belgium, apples and asparagus are sold through a system of cooperative auctions. In Languedoc-Roussillon, France, farmers supply cooperatives that adapt the wine to global retailers’ standards. In the Dutch global pork chain, producers set their own standards or negotiate them with buyers. Locality chains, such as Cinta Senese, Swiss Le Gruyère and L’Etivaz, and Italian Tuscan bread, rely upon codes of practice agreed among stakeholders, enforced by European and/or national regulations and subject to third party controls.
Codes of practice implemented through PDO and PGI labelling generally cover a large diversity in product quality. When this is the case, producers may adopt other more stringent standards, such as organic (as in the case of around 5% of producers of Le Gruyère and L’Etivaz cheese). In other cases, producers prefer to interact intensively with buyers to communicate a specificity that cannot be easily codified. Relational patterns are also the most frequent ways of interaction between farmers and consumers in local chains, sometimes combined with hierarchical patterns when the whole cycle of production is carried out on farm.
In our case studies, chains present a combination of different patterns (see Tables5and6for an example based on the Italian bread chains). In general, relations between retailers and processors
Sustainability 2016, 8, 449 15 of 27
are modular (they exchange commodities based on given product specifications), while the relations between farmers and intermediaries or processors, or direct relations with consumers, are either relational (frequent and intense interaction) or captive (when a buyer imposes standards on small farmers, as in the case of Latvian blueberries and Serbian raspberries). Even in the most coordinated global chains, however, we can find parts of the chain regulated by “spot” markets.
Table 5.Governance patterns in supply chain stages of Pan Bauletto, Barilla (IT global bread case).
Case Studies Spot Relational Modular Captive Hierarchy
input providers - farmers x
Farmers - millers x x
Millers - baker x x
Bakers - retailers x
Retailers - consumers x
Table 6.Governance patterns in supply chain stages of Floriddia (IT local bread case).
Case Studies Spot Relational Modular Captive Hierarchy
input providers - farmer x
farmer - miller x
miller - processor x x
processor - retailer x x
retailer - consumer x x
When considering sustainability performance, extended governance can assume a key role. Extended governance refers to the distribution of duties and rights between the firms, state and civil society [57]. Public administrations and civil society organisations set the regulatory context, enforce quality controls and can exert pressure on firms to frame competition on sustainability performance. In the case of pork in the Netherlands, de Hoeve had to adopt the Green Label scheme in order to obtain a “licence to produce” in the region. Where extended governance is weak, as in the case of Latvian blueberries, local chains can be subject to fraud or be susceptible even to criminal dominance. In the case of PDO and PGI products, public administrations and civil society can exert a significant power over firms to improve codes of practice. Farmers or artisans of local chains are often “public persons”, as they provide testimonials to the characteristics of the territory, and their reputation is a strong motivation to improve their sustainability performance [61]. Extended governance is important for global chains as well, as one of the main charges on global food chains is to take advantage of “regulatory vacuums” [62], weak administrations, corruption, and weak civil society, especially when use of local resources and human rights are concerned. In global chains, key players often issue sustainability reports, which are intended to establish a dialogue with civil society and public institutions. Disclosure of information is, in this regard, very important, as it is the basis for a sound dialogue.
3.6. Resources, Knowledge and Technology
Technology changes the balance between distance, size and the identity of the product. It may also affect the identity of the product and the spatial configuration of the chain. Technology determines constraints to input characteristics, so that local production may not comply with the requirements of homogeneity as set by the processing industry. This is what happens in the bakery industry, where the wheat necessary to bake should have a minimum level of proteins that local wheat does not always reach. New technologies may require scaling up the size of operations.
Technologies can be either drivers of localisation and/or globalisation. Most technological innovation in local chains is made to increase the degree of differentiation: genetic improvement (ancient and local varieties vs. hybrids), processing technologies (in the case of local bread in Italy it is
Sustainability 2016, 8, 449 16 of 27
possible to leave the wheat germ in the flour and sourdough is used), specific inputs (as in the case of non-pasteurised milk in the Swiss cheeses). L’Etivaz and Le Gruyère local chains are often associated with organic methods of agricultural production, while global chains use either conventional or “integrated pest management” techniques. Code of practices for PDO products may impose traditional technologies, as in the case of L’Etivaz cheese in Switzerland. Scaling up of traditional technologies, often adopted by local chains, is often done to the detriment of some more or less distinguishing features, when possible.
GLAMUR’s global chain case studies indicate an impressive amount of investment in technologies (Table7), especially in ICTs, advanced logistics, automation, resource-efficient processing plants, clean energy, and quality control. Green technologies are often encouraged by environmental regulations and incentives set since the Kyoto agreements. In some cases, actors in the global chains benefit from linkages with other industries, such as the pharmaceutical industry.
Table 7.Know-how, resources and technologies in the GLAMUR case studies.
Cases Local Global
FR tomato
Knowledge and know-how in plant breeding for both ancient varieties and hybrids, taking into account multiple characteristics (taste, rusticity, forms, colour . . . ). Importance of human resources for “low-tech” and “work intensive” options.
Hybrid varieties, generic round and cluster tomatoes. Technology for packaging, transportation and quality control. High investment in Research, Innovation and Development. Diffusion of knowledge and technologies through agro-industry support. Intensive in natural resource use.
BE asparagus
Modern production technologies and quality insurance through compliance with public and private food quality standards.
Agro-industry uses latest production technologies to increase yields and resource-efficiency, such as pulse irrigation. Compliance to standards ensures high product quality. Public policies and institutions help to increase the competitiveness of the sector. NL pork
De Hoeve focusses on the development of tailor-made solutions grounded in business-based knowledge
global origin of energy inputs, technology, ICT applications and the interlinkages with global operating pharmaceutical industries
SER Berries traditional technologies don’t bring any added value to the product
farms cooperating within the global food chain are technologically more equipped, and consequently, not heavily dependent on seasonal workforce
CH cheese
Technologies used are traditional: the un-pasteurised milk is compulsorily heated in copper boilers on wood fire in accordance with local practices. The PDO specifications forbid any kind of mechanical alteration of the milk such as centrifugation before transformation
or pasteurization.
Le Gruyère is considered as a traditional cheese made with modern and automated technologies, mostly in order to deal with a high demand, hygiene and labour efficiency. The PDO specifications still limit scaling-up. The
un-pasteurized milk from farms not further than 20 km must be processed once a day in vats of maximum 6000 L.
UK cheese
The local/farmhouse sector frequently use their own milk and so much thought and innovation is given to how feed costs can be minimized e.g., closed-system grazing and silage production. Herd nutrition is also a key influence on the quality and composition of the milk used in distinctive territorial farmhouse cheeses and specialist producers are increasingly providing detailed technical advice relating to milk quality, storage and marketing.
Resource use efficiency is an increasingly important influence on production efficiency. Reductions in waste are becoming increasingly important, linked also to retailer-led strategies to reduce packaging. Some cheesemakers are also investing in technologies which use whey, predominantly for onward sale into food manufacturing. Consumer interest in nutritional factors, especially the health consequences of eating fats, sugars and salt, have also led to the development of low-fat and low-salt
Sustainability 2016, 8, 449 17 of 27
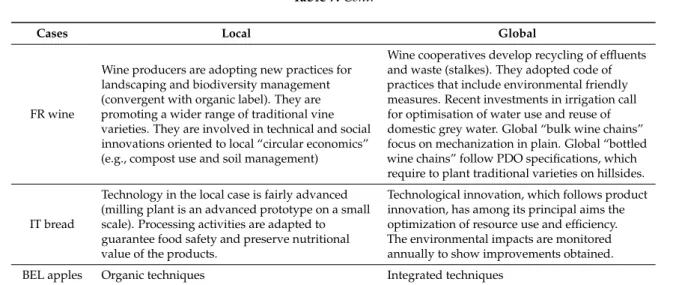
Table 7. Cont.
Cases Local Global
FR wine
Wine producers are adopting new practices for landscaping and biodiversity management (convergent with organic label). They are promoting a wider range of traditional vine varieties. They are involved in technical and social innovations oriented to local “circular economics” (e.g., compost use and soil management)
Wine cooperatives develop recycling of effluents and waste (stalkes). They adopted code of practices that include environmental friendly measures. Recent investments in irrigation call for optimisation of water use and reuse of domestic grey water. Global “bulk wine chains” focus on mechanization in plain. Global “bottled wine chains” follow PDO specifications, which require to plant traditional varieties on hillsides.
IT bread
Technology in the local case is fairly advanced (milling plant is an advanced prototype on a small scale). Processing activities are adapted to guarantee food safety and preserve nutritional value of the products.
Technological innovation, which follows product innovation, has among its principal aims the optimization of resource use and efficiency. The environmental impacts are monitored annually to show improvements obtained.
BEL apples Organic techniques Integrated techniques
4. Discussion
Our research was based on a clear research question: are local food supply chains more sustainable than global food supply food chains? According to our assessment exercise, based on data analysis as well as on conversations with a large number of actors in the supply chains, there is not a clear and univocal answer. Indeed, there are differences between “local” and “global” chains, and these differences matter for sustainability. However, these differences benefit local chains for some attributes and global chains for others. For example, biodiversity and added value at the local level seem to be better addressed by local chains, while efficiency is better achieved by global chains. Moreover, given the variability of market conditions, we may expect that performance indicators and the difference between chains change over time.
At the end of our research, however, we doubt the validity of the question posed in the first place. We have acknowledged that differences between “local” and “global” are dispersed along a local–global continuum, and that in real life local and global do not always belong to separate settings or domains. Food chain actors, adapting continuously to a changing environment, establish relations with a multiplicity of other actors for a variety of reasons and animate multiple chain configurations. The project sheds light on various intermediary cases that reveal the dynamism in both local and global chains and the emergence of new chain configurations in reaction to market opportunities. Rather than considering “local” and “global” as alternative to each other, sustainability assessment must address situations where complementarities and synergies between “global” and “local” food chains occur.
These considerations do not downplay the meaning that “localness” has for many actors in the chain, quite the contrary. Local food chains have challenged the sustainability failures of the food system and have proposed truly alternative business and organisational models and new avenues to sustainability. The verification of a presumption of sustainability—either attached to local or to global—requires the clarification of what is truly local or truly global. Our research confirms that using only physical distance criteria, as in the case of food miles, can be misleading [7], as any other partial attempt to rely on a single criteria. As the qualification of “local” can be a competitive asset, especially for farms and rural actors, inappropriate criteria could lead to misuse of the concept or even illegitimate appropriation.
We have proposed and discussed six food chain characteristics—geographical configuration, product identity, spatial distance, size of operations, governance, and technologies—that we recommend taking into consideration when measuring the “localness” or the “globalness” of food supply chains and their implications for sustainability assessment. In particular, we can conclude that:
![Figure 3. Local and global chains for raspberries in Serbia and their interconnections [31].](https://thumb-eu.123doks.com/thumbv2/123doknet/13986027.454631/9.892.179.715.243.539/figure-local-global-chains-raspberries-serbia-interconnections.webp)