HAL Id: hal-01587285
https://hal.archives-ouvertes.fr/hal-01587285
Submitted on 14 Sep 2017
HAL is a multi-disciplinary open access
archive for the deposit and dissemination of
sci-entific research documents, whether they are
pub-lished or not. The documents may come from
teaching and research institutions in France or
abroad, or from public or private research centers.
L’archive ouverte pluridisciplinaire HAL, est
destinée au dépôt et à la diffusion de documents
scientifiques de niveau recherche, publiés ou non,
émanant des établissements d’enseignement et de
recherche français ou étrangers, des laboratoires
publics ou privés.
recovering for finger-vein verification
Huafeng Qin, Mounim El Yacoubi
To cite this version:
Huafeng Qin, Mounim El Yacoubi. Deep representation-based feature extraction and recovering for
finger-vein verification. IEEE Transactions on Information Forensics and Security, Institute of
Elec-trical and Electronics Engineers, 2017, 12 (8), pp.1816-1829. �10.1109/TIFS.2017.2689724�.
�hal-01587285�
Deep Representation based feature extraction and
recovering for Finger-vein verification
Huanfeng Qin and Mounim A. El Yacoubi
Abstract—Finger-vein biometrics has been extensively investi-gated for personal verification. Despite recent advances in finger-vein verification, current solutions completely depend on domain knowledge and still lack the robustness to extract finger-vein features from raw images. This paper proposes a deep learning model to extract and recover vein features using limited a priori knowledge. Firstly, based on a combination of known state of the art handcrafted finger-vein image segmentation techniques, we automatically identify two regions: a clear region with high separability between finger-vein patterns and background, and an ambiguous region with low separability between them. The first is associated with pixels on which all the segmentation techniques above assign the same segmentation label (either foreground or background), while the second corresponds to all the remaining pixels. This scheme is used to automatically discard the ambigu-ous region and to label the pixels of the clear region as foreground or background. A training dataset is constructed based on the patches centered on the labeled pixels. Secondly, a Convolutional Neural Network (CNN) is trained on the resulting dataset to predict the probability of each pixel of being foreground (i.e. vein pixel) given a patch centered on it. The CNN learns what a finger-vein pattern is by learning the difference between finger-vein patterns and background ones. The pixels in any region of a test image can then be classified effectively. Thirdly, we propose another new and original contribution by developing and investigating a Fully Convolutional Network (FCN) to recover missing finger-vein patterns in the segmented image. The experimental results on two public finger-vein databases show a significant improvement in terms of finger-vein verification accuracy.
Index Terms—Hand biometrics, Finger-vein verification, Deep Learning, Convolutional Neural Network, Convolutional Autoen-coder, Representation learning.
I. INTRODUCTION
W
ITH the tremendous growth in the demand for securedsystems, automatic personal verification using biomet-rics has drawn increasing attention and has become one of the most critical and challenging tasks. Physical and behavioral modalities such as face, fingerprint, signature and gait have been widely applied for the identification of criminals in law contexts, for securing access to sensitive facilities, and for granting access to electronic devices. A number of biometric modalities have been employed for the verification task; these can be broadly categorized in two categories: (1) extrinsic modalities, i.e. face [1], fingerprint [2], and iris [3], and (2) intrinsic modalities, i.e. finger-vein [4], hand-vein [5] and palm-vein [6]. Extrinsic biometric modalities are susceptible
Huafeng Qin and Mounim A. El Yacoubi were with the
SAMOVAR, Telecom SudParis, CNRS, University Paris Saclay, 9 rue Charles Fourier, 91011 Evry Cedex, France (email:[email protected];[email protected])
Manuscript received ; revised × × × ×
中国 l 占床 解剖 学杂 志1 9 97 年第 l 5卷 第 1 期 ・3 9・ ・ 临床 报道 ・
y  ̄ f
指 掌
侧 浅
静 脉
的 解
其 在
断 指
再 植
的 应
用』R
; z
. f 。 于仙 娟 伽 f 【 摘 要】 目的 : 为 吻音 指掌 侧拽 静林 的断 指再 植术 提供 解剖 学基 础。 方法 : 在 1 O个 从桡 动脉 或尺 动脉 加压 灌注 美兰 显示 静 脉的 成人 新鲜 手标 本上 . 解 削观 察指 掌恻 浅静 脉的 形态 、 分 布特 点和 管往 . 结 果・ ①指 掌侧 浅静 脉 1 ~ 3 条 小静 脉起 自指 腹, 从中 节指 远埘 开始 . 形成 2 ~ 3 条 可供 吻台 的纵 向走 行{璺 静脉 , 纵 行静 林之 间 及与 指侧 面的 { 璺静 脉有 变通 . 指 掌侧 浅静 林在 中线 两埘 走向 指根 部.在 指聩 处郎 指掌 侧栈 静脉 { 亡旨 构成 头间 静脉 . 向背 恻注 ^手 背面 的静 脒, 或注 ^手 掌面 远伽 皱的 边缘 静脉 弓. 指掌 伽 { 璺静 脉远 埘指 横纹 处内 径约 0 .3 ~0 6 m m } 中 节指 中部 约0 . 4~ 0 . m m } 近 节指 根部 约O . 6~ 1 .0 m m .@ 吻合 指掌 删静 脉的 断指 再植 6 8倒 9 3指 , 成活 8 8指 , 成活 卑9 4 .6, 6 .结 论r 啕台 指芈 侧浅 静脒 可完 全解 决再 植指 静脉 回 问题 . 【 关键 调】 手指 掌侧 浅静 脉 断指 再植 屈 拳 1 一 ~ 一 断指 再植 自6 0 年 代中 期获 得成 功以 来,断 指横 纹即 指蹼 处, 相邻 的指 掌侧 浅静 脉相 互汇 指再 植术 已广 泛开 展, 经典 的断 指再 植血 供重 建是 吻合 指掌 侧固 有动 脉和 指背 浅静 脉, 但在 指背 浅静 脉损 伤、 缺损 的病 例, 其血 供重 建则 受 到限 制, 又鉴 于经 典的 再植 方法 术中 需要 反复 翻动 患手 解剖 和寻 找指 掌侧 固有 动脉 和神 经及 指背 浅静 脉, 对吻 合的 血管 干扰 大。 因此 , 探讨 新的 再植 方法 具有 重要 意义 。而 有关 指掌 侧浅 静脉 的解 剖研 究, 张良 【 、 陈以 慈 虽然 在手 静 脉研 究中 有所 描述 , 但 缺乏 专题 研究 报道 。 作 者 自1 9 88 年6 月开 始, 密切 结合 吻合 指掌 侧浅 静 脉, 指掌 侧固 有动 时 :的 断指 再植 手术 , 在 1 0个 从桡 动脉 或尺 动脉 加压 灌注 美蓝 显示 静时 : 的新 鲜手 标本 上, 在显 徽镜 放大 1 0倍 下, 解剖 观测 了指 掌侧 浅静 脉形 态、 分布 特点 及管 径。 在此 基 础上 , 以 吻合 指掌 侧浅 静脉 、 指 掌侧 固有 动脉 的 方法 , 在 临床 行断 指再 植6 8例 9 3指 , 成 活8 8 指, 成活 率为 9 4. 6 现就 指掌 侧浅 静脉 的应 用解 剖和 再植 方法 介绍 于下 , 以供 同遭 参考 。 1 应用 解剖 指掌 侧浅 静脉 全程 均位 于真 皮下 层, 浅筋 膜表 面, 以0 . 3~ O .4 mm 左右 的指 腹小 静脉 起 始, 指腹 小静 脉为 单支 的占 3 6 ( 18 指) , 双 支 的占 4 2 ( 21 指) , 3支 的占 2 2 ( 11 指) 。 从 远 指关 节以 近至 近侧 指横 纹, 指掌 侧浅 静脉 为2 ~ 3条 较粗 大的 纵向 主干 静脉 , 2条 的占 6 6 ( 33 指) , 3条 的占 3 4% ( 17 指) 。纵 行浅 静脉 问 互相 吻合 , 并 与指 侧方 的浅 静脉 有吻 合。 在近 侧 ① 2 64 4 00 山东 省史 登市 整骨 医院 合或 单独 构成 头间 静脉 , 然 后向 背侧 注入 指背 侧静 脉, 部分 未构 成头 问静 脉的 指掌 侧浅 静脉 则直 接上 行注 入手 掌远 侧缘 的边 缘静 脉弓 ( 附 图) 。 指掌 侧浅 静脉 主干 大多 分布 于指 掌中 线两 侧, 与指 掌侧 固有 动脉 走向 基本 附合 。 两 侧静 时 : 口径 相仿 的3 6 指 , 口 径不 相等 的1 4指 , 以 拇、 示、 小指 多见 , 拇 指、 示指 桡侧 , 小 指尺 侧浅 静时 : 较粗 大, 中、 环指 两侧 浅静 脉口 径大 多相 等。 甲 弧缘 平面 指掌 侧浅 静脉 内径 0 .3 ~0 . 4 w l m, 由 附图 手 掌和 手指 掌面 的浅 静脉 远至 近口 径渐 增粗 。 拇 指掌 侧浅 静脉 略细 , 甲弧 缘平 面口 径0 . 2~ O .3 mm , 远 侧指 横纹 约0 . 3 维普资讯 http://www.cqvip.comFig. 1: Vein pattern in the finger and palm skin [11]
to spoof attacks because fake face images [7], fingerprints [8], and iris [9], [10] can successfully cheat the verification system. Therefore, the usage of extrinsic biometrics generate some concerns on privacy and security in practical applications. On the other hand, intrinsic biometrics modalities are much harder to forge as they are difficult to acquire without user’s knowledge. In particular, vein verification provides higher security and privacy for the user.
A. Motivation and Related Work
The main three components of the skin, the outermost epidermis, dermis, and subcutaneous layers, contain fat and blood. The veins and arteries are located inside the subcuta-neous layer. The finger-vein pattern extends from finger root to fingertip, showing clear network and good connectivity (as shown in Fig.1). In general, the finger-vein pattern is not easily observed in visible light. Different skin layers have different responses to infrared light, so the vein pattern can be captured by infrared light. In current works [4], [12], [13], infrared illumination with wavelength of 850 nm is typically employed to capture finger-vein images with high contrast.
Finger-vein verification is still a challenging task because the acquisition process is inherently affected by a number of factors: environmental illumination [14]–[16], ambient tem-perature [4], [16], [17], light scattering in imaging finger tissues [18], [19]. In practical applications, these factors are not controlled, so many acquired finger-vein images contain ambiguous regions where the separability between the vein and non-vein patterns is poor. In general, matching from ambiguous regions associated with noise and irregular shadow regions will ultimately compromise the performance of the authentication system. To perform effective verification, a lot of approaches have been proposed to extract the vein network
from finger-vein images, showing promising performance on different databases. They can be broadly classified into two categories:
1) Finger-vein extraction approaches based on detecting valley features: In clear regions of the finger-vein image, the pixel values in vein patterns are lower than those in background, so the cross-sectional profile of a vein pattern shows a valley shape. Therefore, various approaches have been proposed to detect the valley. For example, repeated line tracking methods [20]–[22] extract the vein pattern by computing the difference between the center value and the neighboring ones in the Cross-sectional profile. In region growth-based approaches [23], a Gauss template is designed to compute the valley’s depth and symmetry. In addition, as curvature is sensitive to the valley, curvature-based measures have been shown to be powerful for extracting finger-vein features [16], [17], [24].
2) Finger-vein extraction approaches based on detecting line-like features: In this category, a vein pattern is supposed to be a line-like texture in a predefined neighborhood region. This assumption has been supported by many works based on Gabor filters [4], [18], [25], matched filters [26], wide line detector [15] and neural networks [27]. Gabor wavelets have been applied for ridge and edge detection to enhance the finger-vein image. The enhanced vein pattern is further segmented using a threshold to obtain a binary image for identification. For the matched filters [26], different templates are considered to search vein segments along all possible directions. In wide line detection [7], the vein patterns are detected by comparing the value of the center pixel to the values of the other pixels within the mask. In [27], the finger-vein image, by contrast, is enhanced based on curvelets, and then a local interconnection neural network with a linear receptive field is employed to learn straight-line vein features based on labeled patches. The network is trained to detect a horizontal line and the receptive field of the neural network is further rotated by an angle to extract other lines. Unfortunately, no details on the experimental setup are given and the pixels seem to be manually labeled.
The approaches above extract finger-vein patterns based on attribute assumptions such as valleys and straight-lines. As a result, they suffer from following problems:
A) These assumptions are not always effective to detect the finger vein patterns. Compared to background pixels, the vein pixel values from clear regions do correspond to valleys or straigth-line attributes (shown in Fig.2), so, in this case, the approaches above can distinguish vein from non-vein pixels. However, they cannot work well for ambiguous regions (as shown in Fig.3), because noise can comprise some valley structures in the vein region (Fig.3(b) ) while creating false valleys in the background (Fig.3(c)).
B) As the pixel values can create different distributions (as shown in Fig.3 and Fig.4), it is impossible to model all attributes which are related to finger-vein features. Most of attributes used in current state of the art are those which are easy to observe and model, such as valleys or straight lines. Considering as many existing attributes as possible may alleviate the problem but is costly intensive, beside requiring
X Axis Y Axis X Axis Y Axis (a) −20 0 20 −15 −10 −5 0 5 10 15 90 100 110 120 130 140 150 160 X Axis Y Axis Gray value (b) −20 −10 0 10 20 −15 −10 −5 0 5 10 15 100 110 120 130 140 150 160 X Axis Y Axis Gray value (c)
Fig. 2: (a) Two pixels and their 30 × 30 neighborhood; Left: Patch centered on background pixel; Right: Patch centered on vein pixel; (b) distribution of gray values in the patch centered on background pixel; and (c) distribution of gray values in the patch centered on vein pixel. The color scale from blue to red indicates increasing gray-scale values.
X Axis Y Axis X Axis Y Axis (a) −15 −10 −5 0 5 10 15 −15 −10 −5 0 5 10 15 70 75 80 85 90 95 X Axis Y Axis Gray value (b) −20 −10 0 10 20 −15 −10 −5 0 5 10 15 60 70 80 90 100 110 120 X Axis Y Axis Gray value (c)
Fig. 3: (a) Two pixel in ambiguous regions and their 30 × 30 neighborhood; Left: Patch centered on vein pixel; Right: Patch centered on background pixel; (b) distribution of gray values in the left patch; and (c) distribution of gray values in the right patch
heavy manual inspection.
C) It is not easy to propose a mathematical model to effectively describe the distributions shown, for instance, in Fig.2(c), Fig.3(b) and Fig.4, assuming the attributes are related to finger-vein patterns. The distributions are very complicated to model accurately by a mathematical model, as this is illustrated by the lack of modeling approaches on this problem. Therefore, the performance of previous works has been
limited owing to the issues above. How to learn a good
representation of the vein patterns is still an issue for finger-vein feature extraction. This has motivated us to investigate a robust feature extraction approach for real-world finger-vein verification.
X Axis Y Axis X Axis Y Axis (a) −20 −10 0 10 20 −15 −10 −5 0 5 10 15 60 80 100 120 140 X Axis Y Axis Gray value (b) −20 −10 0 10 20 −15 −10 −5 0 5 10 15 100 110 120 130 140 150 X Axis Y Axis Gray value (c)
Fig. 4: (a) Two vein pixels in the intersection region. and their 30 × 30 neighborhood; (b) distribution of gray values in the left patch; and (c) distribution of gray values in the right patch
B. our work
In recent years, deep learning-based approaches have been successfully applied for computer vision and object tracking [7], [8], speech recognition [28] and handwriting recognition [29]. In the light of their powerful capacity for feature rep-resentation, some researchers brought them into biometrics. Several Deep learning models such as in [30]–[32] have been built for face verification and have shown great success on the LFW face dataset, for instance. Deep neural networks (DNN) have also been employed recently in several medical images segmentation tasks [33]–[36]. In their work, the DNN is trained for segmentation using a ground truthed database. Many experimental results in prior work have shown that deep learning based approaches outperform handcrafted feature-based approaches.
Inspired by this idea, we propose, in this paper, a deep learning model for finger-vein verification. Our approach aims, first, at segmenting foreground (vein) pixels from background pixels by predicting the probability of a pixel to belong to a vein pattern given limited knowledge, and, second, at
recovering missing vein patterns. Compared to current state
of the art segmentation and recovering approaches, that are based on image processing techniques, our approach does not segment or recover an image based only on its pixels and their correlations, but it does so by relying also on rich statistics on nonlinear pixels correlations, through a hierarchi-cal feature representation learned by a deep neural network from a large training set. This is a major advantage over traditional approaches as relying only on noisy input images for segmentation or vein recovery may lead to severe errors. The main paper contributions are summarized as follows: 1) We propose an automatic scheme to label pixels in vein regions and background regions, given very limited human knowledge. We employ several existing baselines approaches to extract (segment) the vein network from an image and use their combined output automatically to assign a label for each pixel. Such a scheme avoids the heavy manual labeling and may also reduce label errors, especially for ambiguous pixels.
2) A CNN-based scheme is employed to automatically learn features from raw pixels for finger-vein verification. First, a dataset is constructed based on patches centered on the labeled pixels, and we take the patches as input for CNN training. Secondly, in the test phase, the patch of each pixel is input into CNN the output of which is taken as the probability of the pixel to belong to a vein pattern. Then, the vein patterns are segmented using a probability threshold of 0.5. Compared to existing approaches, our CNN automatically learns robust attributes for finger-vein representation. Experimental results on large public datasets show that the proposed model is able to extract the vein patterns from raw images in a robust way, which leads to a significant improvement in finger-vein veri-fication accuracy. 3) This paper investigates a new approach for recovering vein patterns in the extracted finger-vein image. As finger-vein patterns may be missing by corruption during the imaging stage and the inaccurate estimation of parameters during the preprocessing stage (i.e. alignment and feature extraction), we develop a robust finger-vein feature recovering scheme based on a Fully Convolutional Network (FCN). In this context, we perform a rigorous experimental analysis that shows that our scheme does succeed in recovering missing patterns which further improves the verification performance.
II. CNNBASED FINGER-VEIN EXTRACTION
Existing approaches extract vein patterns by assuming that they generate distributions such as valleys and line segments. In this section, a CNN is directly trained to model the distribution of vein pixels without any attribute distribution assumption. First, we label each pixel of a training image as either vein or background based on the combined output of several baseline verification systems. For each labeled pixel, a window centered on it is input to CNN for training. If a window extends outside the image boundary, the missing pixels are synthesized by mirroring. The output of the last CNN layer is interpreted as the probability of the patch center pixel to belong to a vein pattern. Applying CNN to all the pixels in this way, the vein patterns are extracted based on a probability threshold. The resulting binarized images are subsequently used for finger vein verification.
A. Labeling finger-vein pattern
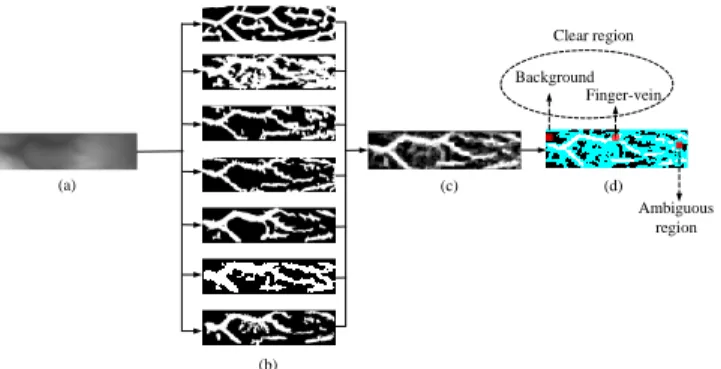
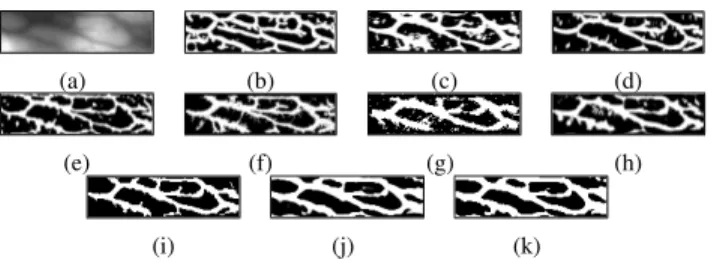
In several image segmentation tasks [33]–[36], the pixels are labeled manually to train a neural network for feature representation. Such a labeling, however, is costly intensive and is prone to errors. To overcome this problem, we propose an automatic labeling scheme. Given an image f (Fig.5(a)), we segment it into vein pattern and background by seven baseline algorithms, namely Repeated line tracking [20], Gabor filter [4], Region growth [23], Maximum curvature point [17], Mean curvature [16], Difference curvature [24] and Wide line detector [15]. Fig.5(b) shows an example of the extracted patterns by the various approaches. Given a pixel (x, y) in each binary image, its value can be treated as its label. As shown in Fig.5(b), the value of vein pixel (white region) is 1 and the value of background pixel (black region) is 0. Let
(a) (b) Background Finger-vein Ambiguous region (c) (d) Clear region
Fig. 5: Labeling the vein and background pixels: (a) Original image; (b) Extracted vein features (patterns) from various approaches; (c) Probability map from (c); and (d) pixels with label (clear region) and pixels without label (ambiguous region, in cyan). Input layer 1×15×15 C1: 24 maps ×15×15 5×5 Convolution M1: 24 maps ×7×7 3×3 Max pooling C2: 48 maps ×7×7 M2: 48 maps ×3×3 3×3 Max pooling F1: 100 maps×1×1 Output layer 2 classes×1×1 5×5 Convolution 3×3 Full connection Fig. 6: Architecture of CNN
the seven methods above, respectively. The probability of each pixel (x, y) being finger-vein feature P(x, y) is approximately computed by P(x, y)= I P i=1fi(x, y) I (1)
As a result, we assign the label L(x, y) of pixel (x, y) as follows L(x, y)= 1 i f P(x, y)= 1 0 i f P(x, y)= 0 (2)
Fig.5(d) shows the labeled pixels (0 and 1 denote back-ground and vein pixels respectively) from clear regions in a finger-vein image. Based on the labels, we can divide an image into different patches with size of N × N which are taken as the input of CNN to learn to extract vein features. For the ambiguous regions (the cyan colored region in Fig. 5(d)), these pixels are not labeled and the corresponding patches are not considered for CNN training.
B. CNN Architecture
Recently, CNN has shown a powerful capacity for feature representation and has been successfully applied in computer vision. In this section, we develop a CNN to learn the finger-vein feature representation based on automatically labeled
patches from clear regions. Our CNN consists of two convolu-tional layers to extract features, followed by two max-pooling layers, two local normalization layers, one fully-connected layer and a Softmax output layer. Fig.6 depicts the CNN architecture for finger-vein feature extraction.
C. Convolutional Layer
The Convolutional layer performs a two-dimensional convo-lution between the input map and a filter to extract the features.
Let xlm be the m-th input map of layer l. The n-th output map
yln of layer l is computed as ynl = max(0, Ml −1 X m wln, m∗ xlm+ bln) (3)
where wln, mis the convolution kernel between the m-th input
and the n-th output maps, ∗ is the convolutional operation,
Ml −1is the number of input maps, and bln is the bias of the
n-th output map. The concept of Rectified Linear Units (RELUs)
(y= max(0, x)) is used as activation function in Eq.(3).
D. Pooling
Pooling can reduce the filter responses to a lower dimension and produces a compact input representation. As shown in Fig.6, we employ max-pooling after computing the ReLU output. In the max-pooling layer, the output is given by the maximum activation over non-overlapping square regions with size of 3 × 3.
E. Local Response Normalization
Local Response Normalization is employed to prevent the
network from saturating. Let Hnl(x, y) be the activity of output
yl
n(x, y) by applying max pooling at position (x, y). The
response-normalized activity Bl n(x, y) is computed as Bln(x, y)= Hnl(x, y)/*. , γ + α min ( Ml,n+p/2) X n=max (0,n−p/2) Hnl(x, y)2+ / -β (4)
where the sum is over p “adjacent” maps at the same spatial
position and Ml is the total number of kernels in layer l. The
parameters γ, p, α and β are set to γ= 2, p = 5, α = 0.0001,
and β = 0.75 by optimization on a validation set. We apply
the normalization after two convolutional layers.
F. Dropout
Dropout is applied for our CNN to prevent overfitting. The dropout technique allows to reduce training parameters and obtain a huge number of different networks by randomly omitting the hidden neurons from the network with probability 0.5. Therefore, it enables the CNN to learn more robust features. Note that we use dropout only in the fully-connected layers.
G. Output layer
In the last layer, a Softmax classifier is employed to predict the probability of the center pixel in the input patch to belong
to a vein pattern. Let xm be m-th the input map of the output
layer and zn the linear combination given by
zn =
M
X
m=1
(wn.m∗ xm+ bn). (5)
where M= 100 (as shown in Fig.6). The probability
distribu-tion of the input data over C different classes is predicted by the following softmax function.
ym= exp(zm) C P n=1exp(zn) (6)
Assume that the label of input data is q. All the weight ma-trices are updated by minimizing the following loss function of reconstruction error.
L= − log (yq) (7)
H. Parameter Update
In this work, we use stochastic gradient descent to train our
CNN with a batch size of 128. The update rule for weight wk
in the k-th iteration is wk+1= ∆k+1+ wk (8) ∆k+1= 0.9 · ∆k − 0.004 · λ · wk−λ · ∂L ∂wk (9) where ∆ is the momentum variable, λ is the learning rate, and
∂L
∂wk
is the derivative of the objective w.r.t wk. The constants
0.9 and 0.004 are the momentum and weight decays which can reduce the training errors [25]. The weights in each layer are initialized using a zero-mean Gaussian distribution with standard deviation 0.001. The neuron biases in each layer is set to be constant 1. We employ a fixed learning rate of 0.0002.
I. Training and test of CNN
For CNN training, the input data consist of patches with size
N × N. When the input size changes, the width and height
of map in each layer will change accordingly. The output dimension is decided according to the number of classes to predict. After forward propagation through the network layers, an image is represented effectively. After training, given a patch either from a training or a test image, the CNN computes the probability of its center to belong to a vein pattern, and labels it according to the winning class (based on a probability
threshold of 0.5). When labeling all pixels in an image using
the trained CNN, the vein network is extracted and stored
in a binary image. In our experiments, we build a database
consisting of 30000 patches for each class to train the CNN. The detailed training process is depicted in algorithm 1.
Algorithm 1 Deep representation for finger-vein pattern ex-traction.
Input: Original finger-vein image f (x, y) and dataset Ω;
Output: Finger-vein enhanced image F (x, y);
Step 1: Extract the finger-vein pattern based on 7 baselines and compute the probability map (as shown in Fig.5(c)). Step 2: Assign a label for each pixel based on the probability map, and select some patches centered on the vein pixels as positive samples and patches centered on the background pixels as negative samples to form the training set A.
Step 3: Train CNN by stochastic gradient descent. Step 4: Input image f (x, y) into CNN to obtain enhanced image F (x, y).
Return F (x, y);
(a) (b)
Fig. 7: Corrupted images. (a) Corrupted gray scale image; (b) Binary image obtained from (a).
J. Feature encoding
After enhancing the vein pattern, we encode it for matching. In our experiments, the vein and background pixels are labeled as 1 and 0, so the output of CNN F (x, y) is the probability of pixel (x, y) to belong to a vein pattern. Therefore, the pixels are effectively encoded using the following binarization scheme. R(x, y)= 1 i f F(x, y) > 0.5 0 i f F(x, y) ≤ 0.5 (10)
III. FULLYCONVOLUTIONALNETWORK-BASED
FINGER-VEIN FEATURE RECOVERING
Based on the anatomy of finger skin (as shown in Fig.1), the vein network patterns are clear and connective. However, the vein patterns are prone to corruption because finger-vein image quality is affected by many factors during the capturing process. On the other hand, in most finger-vein verification systems, several image preprocessing approaches such as normalization, enhancement and segmentation are employed to extract the vein pattern. Therefore, some vein patterns from gray scale images may be further corrupted by inaccurate pa-rameter estimation during the preprocessing stage. In general, these corrupted images show poor connectivity (as shown in Fig.7), and matching them may degrade discrimination among different classes and create variations within the same class. To alleviate this problem, we propose a new and original method based on a Fully Convolutional Network (FCN) to recover missing vein patterns in order to reduce finger-vein mismatching and thus improve verification accuracy. Our deep model consists of four layers: an input layer, two convolutional layers, and an output layer. Fig.8 shows the architecture of our FCN. In the training stage, for each input finger image,
Input layer 1×39×146 C1: 64 maps×39×146 9×9 Convolution C2: 32 maps×39×146 1×1 Convolution 5×5 Convolution Ouput layer 1×39×146 Pad:4 Pad:2 R0 E 3 (R0) R E 1 (R0) E 2 (R0) Fig. 8: Architecture of FCN
we generate a corrupted image by randomly cropping some few pixels from the vein patterns. We provide to the FCN the corrupted image as input and the original image as output , and let the FCN learn how to recover the missing vein patterns, by learning an internal feature representation that minimizes the reconstruction error between the corrupted and original (ground truth) images. In the test phase, given a possibly
corrupted finger-vein image R0, the FCN provides as output
the finger-vein image with recovered missing patterns E3(R0).
Both input and output images (layers) have 39 × 146= 5691
dimensions for database A and 50 × 150= 7500 dimensions
for database B described in section V.
In the first layer, the input image is transformed to n1feature
maps by Eq.(3) which can be reformulated into a matrix form
E1(R0)= max(0, W1∗ R0+ B1) (11)
where E1is a mapping function that extracts features from the
input image, and W1 and B1 represent the weight and bias.
Here, W1 contains n1 kernels [w1, m1 1, w2, m1 1, ..., w1n1,m1], where
m1 is the number of channels in the input image, and B1 is a
vector [b1
1, b12, ..., b1n1]. The first layer extracts a n1-dimensional
feature for each input image.
In the second layer, we map each of these n1-dimensional
vectors into an n2-dimensional one by the function E2:
E2(R0)= max(0, W2∗ E1(R0)+ B2) (12)
where W2 corresponds to n2 kernels [w21, n1, w22, n1, ..., w2n2,n1]
and B2 is a n2-dimensional vector [b21, b22, ..., b2n2]. Based on a
nonlinear mapping, each of the output n2-dimensional vectors
is conceptually a representation of a connective finger-vein image that will be used for reconstruction.
In the output layer, the n2-dimensional vector E2(R0) is
transformed to reconstruct a finger-vein image by generating possibly missing patterns using the following reconstruction
function E3:
E3(R0)= W3∗ E2(R0)+ B3 (13)
where W3= [w31, n2, w32, n2, ..., w3n3,n2] and B3= [b
3
1, b32, ..., b3n3].
The size of weight kernels in each layer is set to 9×9, 1×1 and 5×5, and the dimensions of the network layers are respectively
n1 = 64, n2 = 32 and n3 = 1 as shown in Fig.8 (the selection
of FCN architecture is detailed in section V-C). We pad the output in each layer such that the reconstructed image and the Ground truth have the same size. All the weight matrices are updated by minimizing the loss function of reconstruction error, and then a end-to-end mapping function E is obtained to recover possibly missing vein patterns in the corrupted
input image. Let R0i be a corrupted finger-vein image and its
corresponding ground truth image, denoted by Ri. The loss
function is defined by the mean squared error (MSE):
L(W, B)= n X i=1 k E (R0i; W ; B) − Rik 2 (14) where W = [W1, W2, W3] and B= [B1, B2, B3].
Similar to the parameter update rule in section II-H, we use stochastic gradient descent with standard backpropagation to minimize the loss function and then update the weight
Wl(l = 1, 2, 3) by Eqs.(8) and (9). The batch size is 128. The
kernels of each layer are initialized by drawing randomly from a Gaussian distribution with zero mean and standard deviation 0.001, and the biases are set to 0. The momentum and weight decays are set to 1 and 0.0005. The learning rate is set to 0.0001.
IV. FEATURE MATCHING
After extracting the Region of Interest (ROI), we apply preprocessing to normalize translation and rotation variations. As some variations remain due to inaccurate localization and normalization, a matching method is employed to compute the non-overlapping region between two images with possible spatial shifts. Let R and T denote registered (reference tem-plate) and test binarized feature maps with size of m × n. The
template ¯R is an expanded image of R that is obtained by
extending its width and height to 2w+ m and 2h + n; ¯R is
expressed as: ¯ R(x, y)= R(x − w, y − h) if 1+ w ≤ x ≤ m + w, 1+ h ≤ y ≤ n + h −1 otherwise (15)
The matching score between R and T is computed by φ(T, R) = min 0 ≤i ≤2w,0 ≤ j ≤2h Pm x=1Pny=1Θ( ¯R(x+ i, y + j), T (x, y)) Pm x=1Pny=1 ( ¯R(x+ i, y + j), −1) (16) where Θ(X, Y )= 1 i f X − Y = 1 0 ot her wise (17) and (X, Y )= 1 i f X , Y 0 ot her wise (18)
φ(T, R) basically computes the amount of overlap between
R and T excluding the pixels located in the expanded
region. The parameters w and h are employed to control the translation distance over horizontal and vertical directions and are heuristically set to 20 and 60.
V. EXPERIMENTS AND RESULTS
In order to evaluate the performance of the proposed ap-proach for finger-vein verification, we carry out experiments on two realistic databases, collected at different times using a contactless device and a device with contact respectively. Some classical approaches such as Repeated line tracking [20] and Maximum Curvature points [17] have shown promising results on private databases. Also, the extraction of finger-vein features using Mean curvature [16], Different Curvature [24], Region growth [23], Wide line detector [15], and Gabor filter [4] achieved high performance for finger-vein verification. Based on the encoding scheme in Eq.(19), we extract the finger-vein patterns from the probability map P(x, y) com-puted by combining the segmentation outputs of the seven approaches above (as shown in Eq.(1)). The corresponding performance is shown in the following experiments. To sim-plify the description, we denote it as the combination scheme. We compare all the finger-vein extraction approaches men-tioned above and the combination scheme with )the one we prin Eq.(19))opose on the two databases described below. All approaches are tested on a high performance computer with 8 Core E3-1270v3 3.5 GHz processor, 16GB of RAM, and a NVIDIA Quadro K2000 graphics card. We train the proposed approach with Caffe [16] on a single GPU of NVIDIA Tesla K20c and the remaining experiments are implemented with Matlab on CPU. G(x, y)= 1 i f P(x, y) > 0.5 0 i f P(x, y) ≤ 0.5 (19) A. Database
1) Database A: The Hong Kong Polytechnic University
finger-vein image database [4] consists of 3132 images ac-quired from 156 subjects using an open and contactless imaging device. The first 2520 finger images were captured from 105 subjects in two separate sessions with an average interval of 66.8 days. In each session, each of the subjects provided 6 image samples from index finger and middle finger respectively. Therefore, there are 12 images for each subject in one session. The remaining 51 subjects only provided 612 images in one session. To test our approach, we select the sub-database with 2520 finger images (105 subjects × 2 fingers × 6 images × 2 sessions) of the first 105 subjects because it is more realistic. As images are acquired using a contactless imaging device, there exists more variations such as translation, rota-tion, scale and uneven illumination. Therefore, the acquired finger vein images are firstly subjected to pre-processing steps before feature extraction. In our experiment, the region of interest (ROI) image is extracted, and then translation and orientation alignment are carried out using the method in [4]. As the image background will contribute a lot of errors and computation cost during the matching stage, all images are cropped and resized to 39×146. Fig.9(a) and Fig.9(b) show the original finger-vein image and normalized finger-vein image.
2) Database B: The finger-vein images in Finger Vein
USM database [13] were captured from 123 volunteers with 83 males and 40 females using a closed and contacted imaging
(a) (b) (c) (d)
Fig. 9: (a) Original image from database A; (b) Normalized gray image from (a); (c) Original image from database B; (d) Normalized gray image from (c)
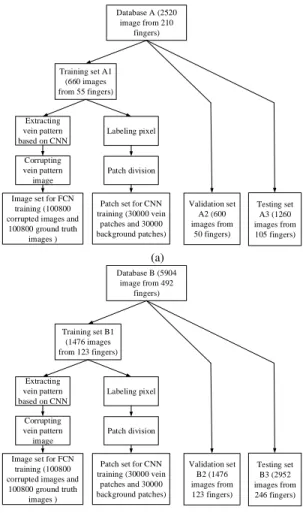
Database A (2520 image from 210 fingers) Training set A1 (660 images from 55 fingers) Validation set A2 (600 images from 50 fingers) Testing set A3 (1260 images from 105 fingers) Patch set for CNN
training (30000 vein patches and 30000 background patches) Patch division Labeling pixel Extracting vein pattern based on CNN
Image set for FCN training (100800 corrupted images and
100800 ground truth images ) Corrupting vein pattern image (a) Database B (5904 image from 492 fingers) Training set B1 (1476 images from 123 fingers) Validation set B2 (1476 images from 123 fingers) Testing set B3 (2952 images from 246 fingers) Patch set for CNN
training (30000 vein patches and 30000 background patches) Patch division Labeling pixel Extracting vein pattern based on CNN
Image set for FCN training (100800 corrupted images and
100800 ground truth images ) Corrupting vein pattern image (b)
Fig. 10: Data partitioning and training set construction process on (a) Datbase A and (b) Database B
device. Each subject provided index and middle fingers from two hands resulting in a total of 492 finger class. The cap-tured finger images are collected in two sessions, separated by more than two weeks’ duration. In each session, each finger provided 6 images and thus 2952 images are obtained. Therefore, there are a total of 5904 images for two sessions. Original images have the spatial resolution of 640 × 480. In their work, a preprocessed dataset consisting of ROI images with size of 300 × 100 is provided for finger-vein recognition. Since the focus of our work is on finger-vein verification, the preprocessed images are normalized to 50 × 150 and used in following experiment. The original image and preprocessed image are shown in Fig.9(c) and Fig.9(d).
(a) (b) (c) (d)
(e) (f) (g) (h)
(i) (j)
Fig. 11: (a) Original finger-vein image; (b) finger-vein image obtained by filtering the isolate regions from (a); Corrupted
samples when (c) θ = 0o and s= 5; (d) θ = 22.5o and s= 5;
(e) θ = 45o and s= 5; (f) θ = 67.5o and s= 5; (g) θ = 90o
and s= 5; (h) θ = 112.5o and s= 1; (i) θ = 135o and s= 3;
(j) θ = 157.3o and s= 7;
B. Experiments setting
To test the proposed approach, we split the two public databases into three sub-datasets for training, validation and
testing, respectively. Fig.10 shows the data partition and
training set construction schemes for databases A and B.For
database A, there are 105 subjects associated with 210 fingers to provide the images in two sessions. The different fingers of the same hand are treated as different classes, based on which we divide the dataset into three subsets: training dataset with 660 (55 fingers × 12 images) images, validation dataset with 600 (50 fingers × 12 images) images and test dataset with 1260 (105 fingers × 12 images) images. To simplify the description, the three datasets are denoted as dataset A1, A2 and A3, respectively. For database B, there are 123 subjects associated with 492 fingers. Similarly, there are 1476 images (123 fingers × 12 images) in the training dataset, 1476 images (123 fingers × 12 images) in the validation dataset, and 2952 images (246 fingers × 12 images) in the test dataset, which are represented as dataset B1, B2, and B3. To extract finger-vein features, the CNN is trained as follows: First, the finger-vein and background image pixels from the training and validation sets are labeled using the scheme described in subsection II-A. To train the CNN, we then select patches centered on vein pixels as positive samples and patches centered on background pixels as negative ones. In our experiments, for each image in datasets A2 and B2, we use about 50 and 25 vein pixels as positive examples, respectively, and the same amount of pixels randomly sampled (without repetition) from the background pixels. This results in 60000 training examples in total (30000 positive examples and 30000 negative examples) which are generated from each training dataset (A1 or B1) for CNN training. The validation sets A2 and B2 are used to select the model hyper parameters, and datasets A3 and B3 are employed for verification.
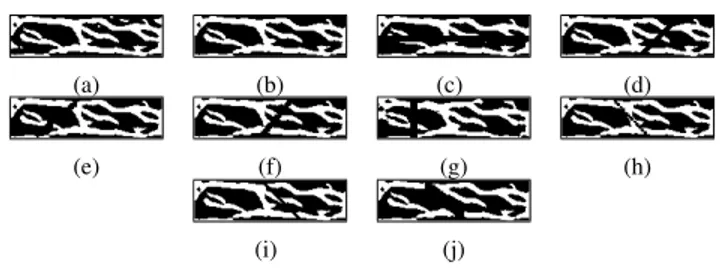
To recover missing finger-vein patterns, we construct a train-ing set for FCN traintrain-ing (as shown in Fig.11). First, to obtain the ground truth image, we filter some isolated regions that have fewer pixels than a threshold from the finger-vein image (as shown in Fig.11(a)) and the resulting finger-vein image is selected as ground truth image (as illustrated in Fig.11(b)). Second, to generate corrupted images, we randomly crop the vein pattern image along a straight line in the orientation
θ (θ = 0o, 22.5o, 45o, 67.5o, 90o, 112.5o, 135o, 167.5o) with
four widths (s = 1, 3, 5, 7 pixels), and at different locations,
as shown in Figs.11(c)-(j). We obtain, in this way, 100800 corrupted (cropped) images (with missing patterns) and their corresponding ground truth images in the training set. For each ground truth image, there are about 200 and 100 corrupted images for datasets A1 and B1. The FCN is trained by minimizing the distance between the corrupted image and its ground truth image.
C. Parameter selection
Our approach consists of applying extensively deep neural networks on finger vein images. For instance, the CNN is applied pixelwise on each image pixel centered on a patch. It is therefore, of paramount importance, to optimize the architec-ture of the DNNs in order to obtain an optimal accuracy-speed tradeoff. To select optimal parameters for CNN and FCN, we conduct extensive experiments by assessing performance on the validation set A2 for database A, and the validation set B2 for database B. There are 600 images (50 fingers × 6 images × two sessions) associated with 50 fingers in dataset A2 and 1476 images (123 fingers × 6 images × two sessions) associated with 123 fingers in dataset B2.
1) Determination of CNN parameters: In this section, we
modify the parameters of a basic CNN network (as shown in Fig.6) to investigate the best trade-off between accuracy and speed. From Fig.6, the basic network consists of two convolutional layers and one full connected layer. The number of kernels in the three layers are 24, 48 and 100 respectively, and the sizes of kernels in both convolutional layers are 5. To simplify description, we denote this CNN as 24(5×5)-48(5×5)-100. To select the optimal CNN architecture, the size of input patch is initialized to 15 × 15 (as shown in Fig.6).
Number of layers: Recent work [37] implies that the CNN can benefit from an increasing depth of the network. So, we extend the basic network by adding some convo-lutional layers or full-connection layers. For example, two deeper networks (48(5×5)-64(5×5)-100 and 24(5×5)-48(5×5)-200-100) are created by adding a convolutional layer of 64 kernels with size of 5 × 5 and a full-connected layer of 200 kernels to the basic network (24(5×5)-48(5×5)-100), respectively. The two new CNNs and the basic one are compared by the following experiments. The three CNNs above (24(5×5)-48(5×5)-100, 24(5×5)-48(5×5)-64(5×5)-100, and 24(5×5)-48(5×5)-200-100) are trained to extract the vein patterns of images in dataset A2. The first 6 images acquired at the first session are employed as registration templates and the remaining as testing images. Therefore, there are 300 (50 × 6) genuine scores and 14700 (50 × 49 × 6) impostor scores. The False Rejection Rate (FRR) is computed by genuine scores and the False Acceptance Rate is computed by impostor scores. The Equal Error Rate (EER) is the error rate when FAR is equal to FRR. Table I shows the EER and the average feature extraction processing time of one finger-vein image for different CNNs. From Table I, we observe that, compared to the three-layers network, the four-layers networks achieve the same accuracy on the validation set, but the time cost increases significantly.
TABLE I: Results of using different layer numbers
Methods 24(5×5)-48(5×5) 24(5×5)-48(5×5) 24(5×5)-48(5×5)
-100 -64(5×5)-100 -200-100
EER(%) 1.33 1.33 1.33
Time(sec) 2.58 3.45 3.77
TABLE II: Results of using different kernel numbers
Methods 12(5×5)-24(5×5) 24(5×5)-48(5×5) 48(5×5)-96(5×5)
-50 -100 -200
EER(%) 2.67 1.33 1.33
Time(sec) 2.03 2.58 4.86
Number of kernels: In general, a larger number of convo-lution kernel leads to better performance but the computation time will increase accordingly. We modify the width of the basic network by changing the number of kernels and we then conduct the following experiments to determine the network width. First, we create a larger network 48(5×5)-96(5×5)-200 and a smaller network 12(5×5)-24(5×5)-50. Then, the ERR and computation time of both networks are computed based on dataset A2. To facilitate comparison, the performance of the basic network is also listed in Table II. The experimental re-sults in Table II show that the networks 24(5×5)-48(5×5)-100 and 48(5×5)-96(5×5)-200 achieve the same EER. However, the basic network 24(5×5)-48(5×5)-100 significantly reduces the computation time. If a fast segmentation speed is desired, a small network width is preferred.
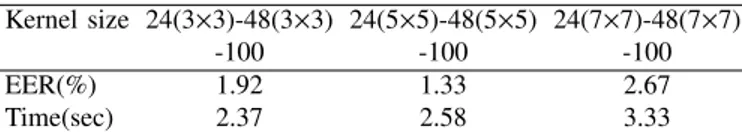
Size of kernel: In the previous section, the kernel size for each convolutional layer is fixed to 5 × 5. In this experiment, we examine the network sensitivity to different kernel sizes. We change the kernel size of all convolutional layers to 3 × 3 and 7 × 7, respectively, and conduct experiments on dataset A2. The experimental results in Table III show that the best verification accuracy is achieved at the size of 5×5. Therefore, we adopt the model with better performance speed trade-off: a three-layer network 24(5 × 5)-48(5 × 5)-100.
Patch size: The selection of the patch size for CNN is critical for achieving high performance. If the size is too small, more detailed vein patterns are extracted but including more noise. This noise can produce mismatch errors that degrade verification accuracy. On the contrary, for too large patches, the CNN will take into account more global information than needed as vein patterns that are far away from the center pixel may actually confuse CNN training. In this section, we deter-mine the appropriate patch size for CNN experimentally. For database A, we train the CNN to extract the vein patterns of the finger-vein images in the dataset A2 at different patch sizes.
TABLE III: Results of using different kernel sizes
Kernel size 24(3×3)-48(3×3) 24(5×5)-48(5×5) 24(7×7)-48(7×7)
-100 -100 -100
EER(%) 1.92 1.33 2.67
Time(sec) 2.37 2.58 3.33
TABLE IV: Results using different patches Patch size 7×7 11×11 15×15 19×19 23×23
EER(%) 1.92 1.33 1.33 1.33 2.33
Time(sec) 2.23 2.38 2.58 2.93 3.46
The first 6 images acquired at the first session are employed as registration templates and the remaining as testing images. We thus obtain 300 (50 × 6) genuine scores and 14700 (50 × 49 × 6) impostor scores. Finally, we compute the EER at different patch sizes.
Table IV. illustrates the relationships between patch size, EER and computation time. The results are obtained on the validation dataset A2. From Table IV, we can see that a smaller equal error rate is achieved at a patch size of 11, 15 and 19 (11 × 11, 15 × 15 and 19 × 19) for database A, which implies better separation between the two score distributions. We observe, hence, that a patch size of 11 gives a good trade-off in terms of accuracy and speed for Database A. As the vein width in the two databases are similar, the partition size
is fixed to the same value for Database B.It is true that the
human visual system in very effective in integrating more global information for making sound decisions at the local level. Thus, a patch with a larger size may be more helpful to judge whether a pixel is a vein pixel or a background pixel. Our brain, nonetheless, uses rich prior knowledge that guides it in distinguishing noise from relevant information, and in deciding whether to use information from a region far away from the center pixel or not. For instance, the vein network usually consists of numerous veins with different lengths, and if the pixel to be decided upon pertains to a small vein, the connectivity around this small vein is the most relevant to decision, not the other veins that happen to be far away. The brain is able to make sound decisions in this regard, but a machine learning algorithm will have difficulty to do it unless it integrates good prior knowledge about the problem, which is a very hard problem by itself. One idea to partially circumvent the problem, nonetheless, is to consider the whole image in a learning scheme that gives less weights to the pixels as their distance to the pixel to be classified increases. That said, considering a whole image-based scheme, the learning would be based only on the available training image datasets, which are generally limited in biometrics, especially for finger-vein images. Our patch-based approach, by contrast, allows considering much larger training datasets (patch-based) on which CNN-like models can be robustly trained. Furthermore, optimizing the patch size on a validation set ensures that the selected patch provides an optimal tradeoff between the number of training patches (sufficiency for parameter estima-tion) and the spatial dimension of the patch (reaching enough information to classify the center pixel)
2) Determination of FCN parameters: To evaluate the
sensitivity of FCN, we employ a similar experimental protocol to that described in the previous section. Our baseline FCN (as shown in Fig.8) consists of two convolution layers and one reconstruction layer: 64 kernels with size 9 × 9 in the first convolutional layer, 32 kernels with size 1 × 1 in the
0 1 2 3 4 5 0.5 1 1.5 2 2.5 3
Number of iteration step
EER(%)
Database A Database B
Fig. 12: Relationship between the number of iteration steps and EER on both Databases
TABLE V: Results using different layer numbers
Kernel size 64 (9 ×9) − 32(1 × 1) 64(9 ×9) − 32(1 × 1) 64 (9 ×9) − 32(3 × 3)
-1(5 ×5) -32(1 ×1) − 1(5 × 5) -32(3 ×3) − 1(5 × 5)
EER(%) 1.33 1.67 2.33
Time(sec) 0.04 0.05 0.13
second convolutional layer, one kernel with size 5 × 5 in the reconstruction layer . It is denoted as 64(9×9)-32(1×1)-1(5×5) to simplify the description. We train and test the network with different numbers of layers, numbers of kernels and sizes of kernels. Table V shows how the performance varies with the number of layers. We observe that the performance from the two four-layer networks decreases w.r.t the baseline performance. This may be caused by the difficulty of training (overfitting issues). In our experiments, we can observe that the four-layer networks converge more slowly than the three layer network does. The experimental results in Tables VI and VII show that the basic FCN is not sensitive to the number and size of kernels. As the choice of the network scale should be a trade-off between performance and speed, the baseline network should be preferred.
For database A, the FCN of 64(9×9)-32(1×1)-1(5×5) with the best trade-off between the speed and verification accuracy are trained for pattern recovering. For database B, as the image size is slightly different from that in database A, we adapt the FCN. For example, we set the size of kernels in the first convolutional layer to be 13 × 9 instead of 9 × 9 shown in Fig. 8.
Recursive Recovery of Missing Vein Patterns: After TABLE VI: Results using different kernel numbers
Kernel size 32(9 ×9) − 16(1 × 1) 64 (9 ×9) − 32(1 × 1) 128 (9 ×9) − 96(1 × 1)
-1(5 ×5) -1(5 ×5) -1(5 ×5)
EER(%) 1.67 1.33 1.33
Time(sec) 0.03 0.04 0.09
TABLE VII: Results using different kernel sizes
Kernel size 64(9 ×9) − 32(1 × 1) 64 (11 ×11) − 32(3 × 3) 64 (13 ×13) − 32(5 × 5) -1(5 ×5) -1(7 ×7) -1(9 ×9) EER(%) 1.33 1.33 2.00 Time(sec) 0.04 0.12 0.24 (a) (b) (c) (d) (e) (f) (g) (h) (i) (j) (k)
Fig. 13: Experimental results from various approaches. (a)
Original image; (b) Gabor filter; (c) Difference curvature; (d) Maximun curvature point; (e) Mean curvature; (f) Region growth; (g) Repeated line tracking; (h) Wide line detector; (i) Combination; (j) Output from CNN; (k) Finger-vein feature from image (j) by encoding scheme in Eq.(10).
(a) (b) (c)
Fig. 14: Extracted results of two images from a finger; (a) Original images;(b) vein feature extracted by combination scheme; and (c) vein feature extracted by the proposed ap-proach.
training, the FCN takes a binary finger-vein image as input and provides its recovered image as output, as shown in Fig.8. If this output is fed back as input to the FCN, more vein patterns can be recovered, which enables the recovering to be done in a recursive way. The number of iteration steps is important in order to achieve high verification accuracy. When the number of the iteration steps is small, some missing vein patterns may not be recovered. By contrast, if the number of iteration steps is large, some non-vein patterns may be wrongly generated. In our experiments, the number of iteration steps is optimized by assessing performance on the images from the two validation sets A2 and B2. First, each image in two sets is enhanced by our CNN. The enhanced image is subsequently subject to binarization using Eq.(10). The vein patterns in the set above are recovered at different numbers of iterative steps. Then, we select the images acquired in the first session for training and remaining ones for testing. For dataset A2, 300 (50 × 6) genuine scores and 14700 (50 × 49 × 6) impostor scores are produced by matching images from the same finger and different fingers, respectively. For dataset B2, there are 1476 images from 123 fingers. We match the images from the same finger and from different fingers to generate 738 (123 × 6) genuine scores and 90036 (123 × 122 × 6) impostor scores. The results of EER on both databases are shown in Fig.12.
From Fig.12, we see that the lowest EERs for A2 and B2 are achieved when the numbers of the iteration steps are 2 and 1 respectively. Therefore, we fixed the number of the iteration steps as 2 and 1 for database A and database B.
D. Visual Assessment
In this section, we visually analyze the extracted patterns from various approaches and recovered images from our
(a) (b) (c) (d)
Fig. 15: Recovered images. (a) Original finger-vein image; (b) Recovered finger-vein image (the number of iteration steps is 1); (c) Recovered finger-vein image (the number of iteration steps is 5); (d) Recovered finger-vein image (the number of iteration steps is 10);;
scheme, so that we can get more insights into the proposed approach. Fig.13 illustrates the finger-vein extraction results of various existing approaches in addition to their combination scheme. From the obtained results, we can see that, compared to the other approaches, the proposed method effectively suppresses the noise in ambiguous regions and extracts more smooth and continuous vein features from raw finger-vein images. Fig.14 shows the extracted vein patterns of two images from the same finger using the proposed approach and the combination scheme. As shown in Fig.14(a), there are translational variations between the two images. Some corresponding vein patterns are corrupted and marked by the red rectangle. Surprisingly, there are huge differences between vein networks of the two images from the same finger, which are extracted based on the combination scheme. By contrast, the proposed approach extracts similar vein networks in spite of the translational variations and corruption. This may be explained by the fact that the CNN learns vein patterns based on pixel correlations in a probabilistic way from the whole training dataset, rather than based on simple image processing operations on the input image. The experimental results from Fig.13 and Fig.14 imply that the proposed approach is able extract robust vein patterns from raw finger-vein images.
The experimental results of recovering the finger-vein image are shown in Fig.15. After one iteration, few missing vein patterns are recovered by the proposed scheme. More vein patterns are recovered with an increasing number of iterations. When the number of iterations is 10, the recovered vein patterns show very good connectivity. It is interesting to see that the missing vein patterns are naturally recovered in spite of a huge corruption in the input finger vein image.
E. Verification results with CNN-based segmentation This experiment aims at estimating the verification perfor-mance in terms of effectiveness and robustness of various algorithms on the finger-vein image datasets. In test dataset A3, there are 1260 images associated with 105 fingers which are captured in two sessions. In test dataset B3, 2952 images from 246 fingers are employed for verification. For both datasets, we select 6 finger-vein images acquired during the first imaging session as training data while the corresponding
10−4 10−3 10−2 10−1 100 0 0.1 0.2 0.3 0.4 0.5 0.6 0.7 0.8 0.9 1 FAR FRR Proposed approach Combination Gabor filter Mean curvature Region growth Wide line detector Difference curvature Maximum curvature point Repeated line tracking
(a) 10−4 10−3 10−2 10−1 100 0.65 0.7 0.75 0.8 0.85 0.9 0.95 1 FAR FRR Proposed approach Combination Gabor filter Mean curvature Region growth Wide line detector Difference curvature Maximum curvature point Repeated line tracking
(b)
Fig. 16: Receiver operating characteristics from (a) Datbase A and (b) Database B
6 images acquired during the second session are employed as testing data to assess the verification performance. The genuine scores are computed by matching images from the same finger while the impostor scores are obtained by matching images from different fingers. This results in 630 (105×6) genuine scores and 65520 (105×104×6) impostor scores from dataset A3, and 1476 (246×6) genuine scores and 361620 (246×245×6) impostor matching scores from dataset B3. The experimental results from various approaches are summarized in Table VIII. The receiver operating characteristics (ROC) curves (the Genuine acceptance rate (GAR=1-FAR) against the FAR) for the corresponding performances are illustrated in Fig.16.
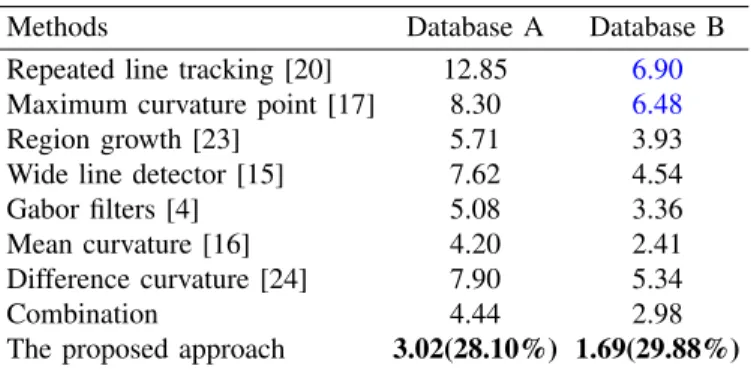
TABLE VIII: EER of various approaches on both datasets
Methods Database A Database B
Repeated line tracking [20] 12.85 6.90
Maximum curvature point [17] 8.30 6.48
Region growth [23] 5.71 3.93
Wide line detector [15] 7.62 4.54
Gabor filters [4] 5.08 3.36
Mean curvature [16] 4.20 2.41
Difference curvature [24] 7.90 5.34
Combination 4.44 2.98
The proposed approach 3.02(28.10%) 1.69(29.88%)
We observe from Fig.16 and Table VIII that the proposed approach using a CNN deep representation achieves, on both datasets, the best performance among all the approaches considered in this work, including the combination scheme of the seven baseline approaches. For instance, the proposed approach reduces by more than 28% the EER obtained by the best one (Mean curvature [16]) among existing approaches on each of the two datasets. Certainly, the verification accuracies may be further enhanced by including, in the training set, some patches from ambiguous regions with high probability of being associated with vein or background patterns. Such a good performance may be explained as follows: 1) as the vein pixel is labeled based on several baselines, it can guide the learning approach to extract robust features for vein
pattern representation.2) The handcrafted segmentation-based
images as they segment each image independently from the others. By contrast, the proposed approach harnesses a rich prior knowledge acquired by training the CNN on a huge patch set from different images so that it is capable of predicting the probability of a pixel to belong to a vein pattern even if
there exists incorrect labels for few training patches. 3) CNN
can automatically extract high level features by representation learning that are objectively related to vein patterns. The CNN takes as input the raw image pixels and iteratively uncovers hierarchical features in such a way to minimize its decision errors on vein patterns. CNN avoids the need of first explicitly extracting some image processing-based features that might discard relevant information about image quality. Similar advantages have been demonstrated based on visualization of feature maps in recent work in other tasks [7], [8], [38].
The baseline approaches that are based on detecting valleys have been shown to offer promising performance, on their own finger-vein databases, but they do not generalize and perform well on the two datasets A and B that are more realistic. Such a poor performance may be attributed to their assumption that valleys exist only in vein regions. However, pixels in ambiguous r egions can also create valleys, even though they are not associated with veins, as shown in Fig.3(c). Performing matching in such regions, genuine vein pixels or background pixels may generate additional verification errors. Similar to valley detector, the line feature detectors make the assumption that the vein pattern can be treated as line, which limits the performance. As shown in Fig.3(c), the distribution of pixel values in non-vein regions also shows line-like attributes while the vein pixels, as shown in Fig.4(c), create more complex attributes instead of lines. The line feature-based approaches above [4] [15] obtain EER above 5% on dataset A. Surprisingly, combining vein features from the seven baselines do not show higher performance than each of them. For example, Mean Curvature [16] achieves 4.2% EER which is lower than that of the combination scheme. This may be explained by the fact that some approaches such as [17] [20] provide less evidence to identify vein features in ambiguous regions. Furthermore, existing approaches may generate conflicting evidences owing to their segmentation errors in ambiguous regions. On the contrary, it is easy for all baselines to distinguish veins from background in clear regions. In this case, their combination can further enhance the evidence. Considering clear patches, either from veins or background, for training CNN is important for the CNN to effectively predict the probability of each pixel, not only in clear regions, but actually in other regions, including the ambiguous ones.
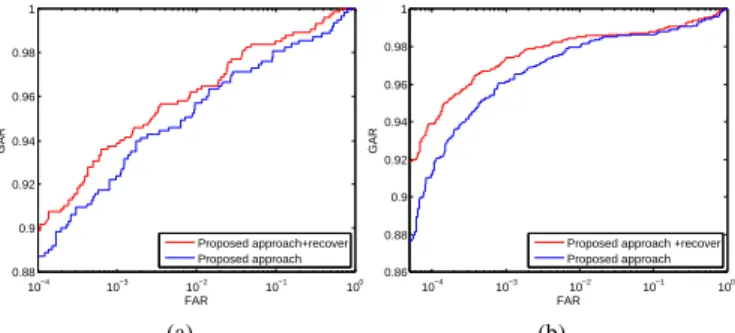
F. Verification results based on missing veins recovery The experimental results presented in this section are fo-cused to assess the performance improvement that can be achieved by recovering missing finger-vein patterns. The CNN is first employed to extract the finger-vein pattern network which is then input to the FCN to recover possibly missing vein pixels. We denote it as ”The proposed approach + recover”. Fig.17 (a) and Fig.17 (b) show the ROC curve on
10−4 10−3 10−2 10−1 100 0.88 0.9 0.92 0.94 0.96 0.98 1 FAR GAR Proposed approach+recover Proposed approach (a) 10−4 10−3 10−2 10−1 100 0.86 0.88 0.9 0.92 0.94 0.96 0.98 1 FAR GAR
Proposed approach +recover Proposed approach
(b)
Fig. 17: Receiver operating characteristics from (a)Datbase A and (b)Database B
TABLE IX: EER of various approaches on both datasets
Methods Database A Database B
The proposed approach 3.02 1.69
The proposed approach + recover 2.70(10.6%) 1.42(15.98%)
database A and database B acquired at two sessions after recovering vein patterns, and the corresponding EERs are listed in Table IX. To facilitate comparison, the results of corresponding approaches before recovering are also depicted in Figs.17 and Table IX.
From the experimental results on the two databases, the per-formance is significantly improved after the missing patterns are recovered. For database A, the EER (Table IX) is reduced to 2.7% (about 10% relative error reduction), for the dataset set collected at two sessions. The corresponding ROC curve (as shown in Fig.17(a)) shows that the GAR is significantly improved in different FAR regions. For database B, a lower EER, namely 1.42% (about 16% relative error reduction) is achieved by the proposed approach + recover. Also, the ROC curve (as shown in Fig.17(b)) shows that using the recovering scheme allows to achieve a higher GAR at lower FAR.
Overall, the finger-vein verification error rate on the two datasets is decreased by recovering the missing vein patterns, which implies the recovered vein features can contribute more discriminative information for verification. Such a good per-formance may be explained by the fact that the proposed FCN is able to uncover the vein network structure by learning as it is trained by plenty of images. Therefore, the FCN can locate the cropped region and recover the missing vein patterns. The proposed recovering scheme may show better performance in finger-vein verification systems where the verification error is mainly created by missed vein patterns. Also, some minutia-based matching methods [39]–[41] may benefit from the recovering scheme because missing minutia points (bifurcation and ending points) are created after recovering vein patterns (as shown in Fig.15).
As shown in Fig.1, the finger-vein pattern extends from finger root to fingertip, showing good network connectivity However, the vein network extracted from a finger-vein image by existing approaches becomes essentially not connected as some vein patterns are corrupted by various factors such as illumination and noises. To recover missed vein patterns, we
crop the vein patterns to construct a dataset for FCN training. The reasons for generating training samples in this way (Section V-B) are as follows. A key point for vein recovering is how to obtain the ground truth. In practice, it is impossible to get the ground truth image. So we crop (along different lines, orientations and widths) the vein patterns in the input image to generate new images with miss-connected veins. Each vein pattern image generated in this way is considered an input image, while the ground truth image corresponds to the original uncropped input image. A FCN is then trained based on each pair of cropped image and associated ground truth uncropped image. The ground truth images are the images to be recovered by the FCN. The rationale behind this idea is that even though the FCN is trained on manually cropped vein patterns, the fact that the training set is very large and consists of over 100 000 (cropped input, uncropped ground truth) image pairs helps the FCN to learn to recover, not only the manually cropped vein parts, but also actual unknown missing vein patterns that possibly exist in the input images although no ground truth is available for them. In other words, by learning the underlying structure of labeled cropped vein patterns on a huge dataset, the FCN is able to generalize over unknown and unlabeled missing vein patterns. Additionally, our FCN-based vein recovery approach is linked to all other segmentation techniques. When the vein network in a finger-vein image is quite ambiguous owing to non-optimal acquisition conditions, any segmentation technique is likely to fail in retrieving perfectly the vein network, which leads to missing vein parts or, on the contrary, to the introduction of noise. Our FCN model will allow in this case to both recover missing vein patterns and suppress noise resulting from segmentation of these low-quality images.
VI. CONCLUSION ANDPERSPECTIVES
This paper proposed a deep learning based segmentation model for finger-vein verification. First, a CNN based ap-proach is developed to predict the probability of pixels to belong to veins or to background by learning a deep feature representation. As a finger-vein consists of clear regions and ambiguous regions, several baselines are employed to automat-ically label pixels as vein or background in the image clear regions, thus avoiding the tedious and prone-to-error manual labeling. Then, a CNN is trained to extract the vein patterns from any image region. Second, to improve the performance, we proposed an original method based on a FCN to recover missing finger-vein patterns in the binary image. Experimental results show that the proposed approach extracts robust vein patterns and significantly improves the verification error rate w.r.t the state of the art.
Currently, the proposed approach achieves promising perfor-mance for finger-vein verification, but a lot remain to be done for the improvement of verification accuracy in future. First, our CNN model have achieved better performance to robustly extract the finger-vein patterns. As the CNN has shown robust learning capacity based on big scale data, a large database will be collected to further improve the performance. Second, in the experiments, we found that the proposed FCN shows
good performance for images where some vein patterns are missing instead of over-segmented images where there are not only plenty of vein patterns but also a lot of false vein regions. This may lead to the false region being enlarged by the recovering scheme, which degrades the verification accuracy. A deep learning based approach will be investigated to conjointly recover the missing vein patterns and suppress noise and irregular shadowing in grayscale images so that robust vein patterns are extracted for finger-vein verification.
Another important issue is the imbalanced and poor local illumination problem. To develop our CNN based-approach, we had to make an important choice on whether to manually or automatically label the pixels before feeding them to CNN for training. We have opted for the automatic labeling scheme as it avoids the tedious manual labeling work and the huge cost it incurs, besides being easily and quickly applicable to any new database and system. The automatic labeling, however, will depend on the accuracy of the baseline methods employed for this purpose. This is why we have combined seven baseline methods for this purpose as the combination will reduce labeling errors. However, if this combined baseline system often fails in segmenting patches with imbalanced local illumination, the CNN will often be fed with wrongly labeled pixels for poorly illuminated regions and its classification performance on such pixels will not be good. The opposite is true, if the combined scheme fails in some cases but often gives a correct label for the center pixel of a patch with imbalanced local illumination, the CNN will be able to learn automatically how a vein pixel is characterized when the surrounding patch has poor illumination. Therefore, an analysis that is specific to these kinds of patches would be helpful to assess the quality of the automatic labeling. If such a quality is judged as not sufficient, one solution is to consider a small subset of the training images with poor illumination, and to label the pixels therein. Even if such a subset is small, it will generate a large amount of patches that can allow our patch-based CNN to learn, with minimal manual labeling effort, the characteristics of vein pixels inside patches with poor illumination.
REFERENCES
[1] M. A. Turk and A. P. Pentland, “Face recognition using eigenfaces,” CVPR, pp. 586–591, 1991.
[2] A. Jain, L. Hong, and R. Bolle, “On-line fingerprint verification,” IEEE Transactions on Pattern Analysis and Machine Intelligence, vol. 19, no. 4, pp. 302–314, 1997.
[3] J. Daugman, “How iris recognition works,” IEEE Transactions on Circuits and Systems for Video Technology, vol. 14, no. 1, pp. 21–30, 2004.
[4] A. Kumar and Y. Zhou, “Human identification using finger images,” IEEE Transactions on Image Processing, vol. 21, no. 4, pp. 2228–2244, 2012.
[5] A. Kumar and K. V. Prathyusha, “Personal authentication using hand vein triangulation and knuckle shape,” IEEE Transactions on Image Processing, vol. 18, no. 9, pp. 2127–2136, 2009.
[6] Y. Zhou and A. Kumar, “Human identification using palm-vein images,” IEEE Transactions on Information Forensics and Security, vol. 6, no. 4, pp. 1259–1274, 2011.
[7] A. Krizhevsky, I. Sutskever, and G. E. Hinton, “Imagenet classification with deep convolutional neural networks,” in NIPS, pp. 1097–1105, 2012.