OATAO is an open access repository that collects the work of Toulouse researchers and
makes it freely available over the web where possible.
This is an author-deposited version published in :
http://oatao.univ-toulouse.fr/
Eprints ID : 8851
To link to this article : DOI:10. 1007/s11340-013-9730-9
URL : http://dx.doi.org/10.1007/s11340-013-9730-9
O
pen
A
rchive
T
OULOUSE
A
rchive
O
uverte (
OATAO
)
To cite this version : Brault, R. and Germaneau, A. and Dupré, J.C.
and Doumalin, P. and Mistou, Sebastien and Fazzini, Marina
In-situ Analysis of Laminated Composite Materials by X-ray
Micro-Computed Tomography and Digital Volume Correlation. (2013)
Experimental Mechanics . ISSN 0014-4851
Any correspondence concerning this service should be sent to the repository
administrator:
[email protected]
In-situ
Analysis of Laminated Composite Materials
by X-ray Micro-Computed Tomography
and Digital Volume Correlation
R. Brault&A. Germaneau&J.C. Dupré&P. Doumalin&
S. Mistou&M. Fazzini
Abstract The complex mechanical behaviour of composite materials, due to internal heterogeneity and multi-layered composition impose deeper studies. This paper presents an experimental investigation technique to perform volume kinematic measurements in composite materials. The asso-ciation of X-ray micro-computed tomography acquisitions and Digital Volume Correlation (DVC) technique allows the measurement of displacements and deformations in the whole volume of composite specimen. To elaborate the latter, composite fibres and epoxy resin are associated with metallic particles to create contrast during X-ray acquisition. A specific in situ loading device is presented for three-point bending tests, which enables the visualization of transverse shear effects in composite structures.
Keywords Composite materials . Micro-computed tomography . Digital volume correlation . In-situ loading . Three-point bending
Introduction
Up to the present numerous studies have been performed about the mechanical response of composite structures, at
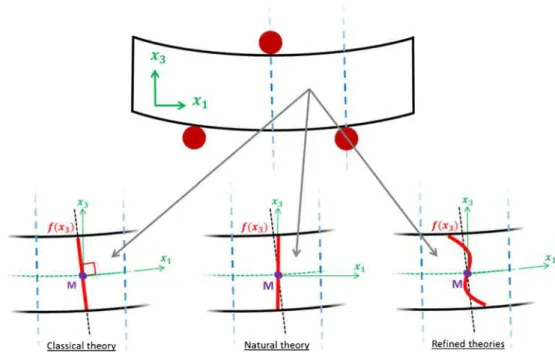
different scales. Among the characteristics of composite materials, transverse shear stress effects constitute an impor-tant phenomenon which must be taken into account in the design of composite structures [1]. Structural damages or fractures can occur because of wrong evaluation of the transverse shear effects. A large number of works shows that the warping of sections due to the transverse shear can be identify with various analytical theories [2,3]. Kirchhoff-Love and Reissner-Mindlin have respectively proposed the classical and natural theories to consider these effects, which are now available in commercial finite element softwares. The first one does not take into account an influence of the transverse shear effects, where f(x3) is zero. Reissner & Mindlin have proposed to consider a linear evolution of the longitudinal displacement along the section [4–6]. More recently, refined theories, based on polynomial, trigonomet-ric and complex mathematical formulations have been de-veloped on the formulation of warping functions f(x3) [7,8]. All these kind of theories are illustrated in the Fig.1. How-ever, very few studies exist on the identification and the validation of these theories by the experimental way [9]. This paper which is a part of a research project, which deals with the visualization of transverse shear effects from vol-ume measurements, with the major interest of observing the evolution of results in the thickness. It is proposed to devel-op an experimental method to make 3D displacement fields measurements in composite structure volumes [10].
Many difficulties exist to achieve volume measure-ments in composite structures [11]. Firstly, it is necessary to use an experimental acquisition tool which is coherent with non-transparent materials. X-ray micro-computed to-mography (X-μCT) is widely employed to analyze vari-ous materials presenting heterogeneities or porosities [12,
13]. It is also employed in composite materials to inspect material defects, damage effects or porosities for instance [14, 15].
R. Brault (*)
:
S. Mistou:
M. FazziniENIT-LGP, PRES Université de Toulouse, av. Azereix, BP1629, 65016 Tarbes, France
e-mail: [email protected]
R. Brault
:
A. Germaneau:
J.C. Dupré:
P. Doumalin Institut Pprime, CNRS UMR 6610, S.P.2 M.I., boulevard Marie et Pierre Curie, Téléport 2, BP 30179, 86962 Futuroscope Chasseneuil Cedex, FranceR. Brault
:
S. MistouNimitech Etudes, 33 Av. du Général Leclerc, 65200 Bagnères de Bigorre, France
As well, X-ray tomography can be used to study some effects linked to composite material mechanical response like mechanical reinforcement behavior or deformation micro-mechanisms of fibers from model materials [16].
Secondly, this work aims to perform experimental obser-vations within composite materials under loading. For that, a laboratory X-ray micro-tomography device is employed. Furthermore, experimental measurements of displacement fields within the material must be performed from a volume measurement method. That’s why it is proposed to use the Digital Volume Correlation (DVC) technique. Volume mea-surement techniques are very interesting to perform kine-matic calculations which provide a high level of results. As it is made for 2D field measurement techniques where a specific speckle pattern is used to make the discretization of specimen surfaces [17], a 3D pattern must be made inside the composite structure, by marker inclusion, to make a 3D grey level distribution [18].
Thirdly, in order to analyze transverse shear effects in composite materials, an in situ loading device has been specially developed. Up to the present, in situ loading devi-ces developed for X-ray micro-computed tomography allowed tensile-compression [18–23] and bending tests [24]. The new loading device presented in this paper allows bending loadings to analyze other 3D mechanical effects linked with transverse mechanical response. Also, tests are carried out at the scale of composite structures, which is new in comparison with previous volume measurement studies, where the used scale is around the micrometer [21–23,25]. It is interesting to notice here that the used filament diameter is equal to 7 μm and the ply thickness is equal to 0.4 mm. The measurement scale employed in this work is more consistent with real application cases of final composite
structures (millimeter), and measurements are less sensitive of strain local differences of fibers and resin. This paper presents first of all the experimental protocol developed for the tests, including details about experimental techniques, X-μCT and DVC. Also the process used to manufacture specimens is described, followed by the development of the proposed in situ loading device. Then, experiments in the three-point bending configuration are presented to dem-onstrate interests of volume measurements for transverse shear effects analysis. Results of these tests are shown to give information about obtained kinematic and strain fields. In conclusion, a discussion of experimental results is pro-posed in terms of composite mechanical behavior and vol-ume measurement accuracy.
Materials & Methods Experimental Techniques
Two main experimental techniques are used in this study: X-ray Micro-Computed Tomography (X-μCT) and Digital Volume Correlation (DVC). The next paragraph details each technique and presents a review in the composite materials context, through the description of four steps of the exper-imental protocol, presented in Fig.2.
The first step concerns all the work out of the X-μCT device, i.e. the composite specimen manufacturing, with the inclusion of particles and the mounting of the exper-imental loading device with the initialization of all sen-sors. This step, which is detailed in a section below, must be performed in accordance with needs of X-μCT and DVC techniques.
Fig. 1 Schematic representation of different warping section theories
Second step concerns volume data acquisitions: several load states are imposed and volume images must be recorded for each one. In the present work, volume images are generated by a laboratory tomography device (Viscom X8050). Used acquisition parameters are a tension of 100 kV and an intensity of 833 μA. Specimen is positioned on a rotation stage and 360 projections of transmitted X-ray intensity field are recorded at each angular step of 1° by a CCD camera through an X-ray detector (Fig. 5). Each pro-jection is obtained by averaging four images recorded at the same angular position.
Third step is the tomographic volume reconstruction. A volume image of the variations of the linear attenuation coefficient in the specimen is reconstructed from all radiog-raphies by using a filtered back-projection algorithm [26]. The distribution of grey levels in 3D images is due to local differences of density and so corresponds to a 3D represen-tation of the microstructure of the studied specimen (Fig.3). Final experimental step is the calculation of 3D displace-ments by DVC in the studied composite specimen volume between each loaded state.
Experimental Volume Measurement
DVC has been developed [20] from the volume extension of Digital Image Correlation (DIC) technique, largely employed in experimental mechanics [24,27]. In this work,
displacement and strain fields are obtained with CorrelVol software, developed in the Pprime Institute of Poitiers [28]. Volume displacement of each point of a virtual grid defined in the initial volume image is calculated by intercorrelation of the grey levels of the neighbourhood limited in a volume subset D surrounding the considered point in both states. Two different mechanical configurations of a specimen are linked by a 3D material transformation ϕ: x=ϕ(X), X and x are the coordinates of a same point in the reference state and the deformed state. Material transformation ϕ is approxi-mated by its expansion at the first order corresponding to a rigid body motion combined with a homogeneous deforma-tion [29]. Computation of the best parameters characterizing this approximation in each point is based on the optimiza-tion of a correlaoptimiza-tion coefficient C which measures the de-gree of similarity of grey level distributions in D and its transformed one by ϕ. Formulation of C employed in this work is insensitive to small contrast and brightness fluctua-tions which can appear in images: a zero-normalized cross correlation formulation is based on grey level gaps in re-spect to the average on the subset. A first calculation is made to approach the position results with a voxel resolu-tion and a null local gradient of D. Final posiresolu-tions of each point of the virtual grid are determined from a first-gradient minimization procedure and a trilinear interpolation of the grey levels in the deformed image. In this way, it is possible to achieve the position of the subset D in fractions of voxel Fig. 3 Example of composite
specimen tomographic volume Fig. 2 Experimental procedure for composite materials volume measurements
(subvoxel accuracy). DVC gives displacement field U(Ux, Uy,Uz) at all centers of the subsets, so all the components of Green-Lagrange strain tensor can be calculated by centered finite differences. [29]
Materials and Manufacturing Process
A study by Finite Element Modelling (FEM) has been preliminary realized to determine materials adapted to the mechanical phenomenon studied and to the measurement accuracy. Specimens with the higher rate longitudinal mod-ulus E11 on transverse shear modulus G13, and the higher rate thickness h on length l are the most adpated [1]. So, carbon/epoxy and rectangular geometry (50x20x4 mm) have been chosen for the specimen geometry, with a longi-tudinal Young’s modulus E11equal to 140 GPa and a trans-verse shear modulus G13equal to 5 GPa. These results are used to design the in situ loading system developed to perform experimental tests. To use DVC, it is necessary to generate volume images with a 3D grey level distribution which follows material transformation during the loading. This grey level distribution is involved by X-ray contrast and can be produced by density differences of material microstructure. Consequently, inclusion of particles is nec-essary to give contrasts within composite structures in to-mographic images. Copper is chosen for particle material because of its density which is higher than the ones of carbon fibers and epoxy resin. The particle size is calibrated at 150 μm which is coherent with a DVC subset size of 313 voxels and a voxel size of 52 μm to find several markers per subset [19]. These particles may involve an effect on me-chanical behavior, in particular damage behavior. For our material, no defect has been observed with the tomograph and the resolution used (1 voxel = 52 μm). That is not meaning that there is any defect but the defects are at scale smaller than the resolution. So the influence on strain mea-surement is very limited because the gauge-length of dis-placement calculation is largely upper (31 voxels=1612 μm) than the defect size. The mass proportion of particles inserted in the composite manufacturing is equal to 5 %, which is very low. Furthermore, tensile tests have been carried out in the direction of fiber to analyze differences in mechanical properties of the material with and without particles. Results give only a difference of 1 % on the longitudinal modulus values between the both configurations, which confirms that
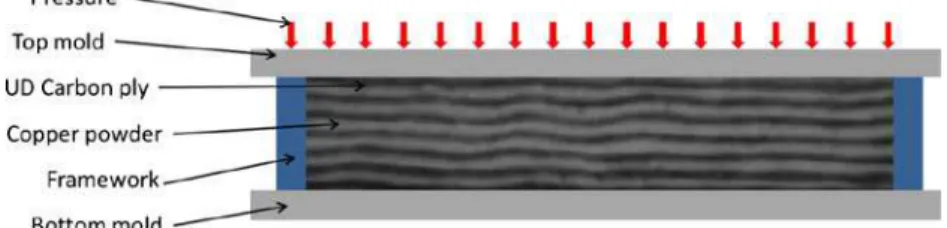
the influence of particle addition is not significant on the mechanical response of the material. Concerning the com-posite manufacturing process, prepreg is the best choice to make composite specimens with the good distribution of particles. Indeed, the use of liquid processes, like Resin Transfer Molding (RTM) or Liquid Resin Infusion (LRI), is not appropriate, because of the increase of resin viscosity with inclusion of particles. To have the maximum of infor-mation inside the specimen volume, particles are included between each consecutive plies of composite specimens (Fig. 4). Prepreg product is composed by UD carbon fibers and epoxy resin. 10 plies at 0° are used for the stacking sequence, with a ply thickness equal to 0.4 mm. Thickness is calibrated at 4 mm by a rigid framework around prepreg plies (Fig. 4). The cured cycle is 1 h at 150 °C under an imposed pressure of 7 bars inside a hydraulic heated press to ensure constant pressure and temperature during the whole cure cycle.
In-situ Loading System
A specific in situ loading device has been developed for the study. A new development is necessary to make measure-ments with this kind of materials and with the micro-tomography device environment. By this context, the Fig. 4 Principe of composite
specimen manufacturing process
three-point bending test is chosen to apply specimen me-chanical transformations. The experimental loading device (Fig. 5) is constituted by an actuator of 6 kN load capacity and 50 mm stroke fixed on a tubular structure with a middle part made in PMMA (X-ray transparent material). Top and bottom parts are made in steel to support reaction forces during tests. Elements of the three-point bending test are included in this tube. Mechanical loading provided by the actuator is recorded by a load sensor of 20 kN capacity and 0.002 kN resolution, and by its controller for imposed dis-placement values.
Experiments & Results
To study mechanical response of composite material during three-point bending tests, five load states have been per-formed, until 3.7 kN of load and 2.1 mm of imposed bending displacement. According to the experimental procedure, six tomographic volumes have been reconstructed to make the displacement fields computation by DVC. Each volume im-age is reconstructed with the same voxel size of 52 μm and with dimensions of 991 voxels along the longitudinal direc-tion, 457 voxels along the transverse direction and 193 voxels along the thickness one.
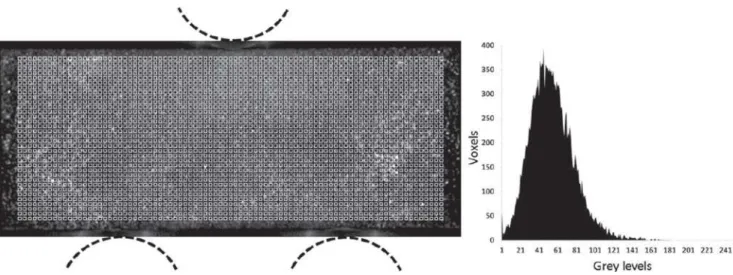
DVC computation is made with a volume grid of 20 230 measurement points per specimen defined in the initial volume image with a step equal to 10 voxels in the three directions. According to the voxel size and the particle dimensions, the size of the correlation subset is 313voxels. A gauge length equal to 20 voxels is used to calculate strains. Figure 6shows the surface covered by the grid and the level grey distribution of a sample image. The obtained dynamic covers is around 150 grey levels, which corre-sponds to good conditions to make correlation computations with a good accuracy [18].
Results
Three kinds of measurement results are presented in this section: the longitudinal displacement Ux, the displacement Uy(bending direction) and the transverse shear strain εxy.
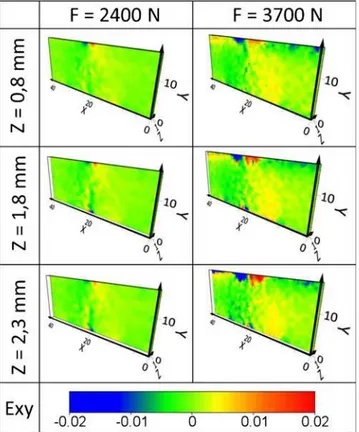
Figures7,8and 9illustrate respectively these results at two load levels during the tests (F=2400 N & F=3700 N), at three positions along the specimen thickness (0, 1 & 1.5 mm). These figures show that there is a significant evolution between the different loads. Figure 7shows that Fig. 6 DVC grid of measurement points and level grey distribution within the sample
the evolution of the warping section during the bending is clearly observable closer to the top and bottom surfaces. The amplitude of the bending displacement Uy, of the order of 0.2 voxel is also visible with a very good definition (Fig.8). Nevertheless, an evolution is detectable along the specimen thickness due to a X-axis rigid rotation of the specimen between two load states. Direct effect is that the load is not distributed evenly over the top surface, which explains the Uyvariations. It is also observed that there is a matting phenomenon due to the too high contact pressure between the metallic bending supports and the specimen surface. By the UD manufacturing and the specimen orientation in the setup, this is only the low resin resistance, which is support-ing the load. There are consequences with the local displace-ment computation, 3D grey level distribution can be damaged in the matting area between different load states. As a consequence, there can be bad evaluation of the 3D displacements concerning the voxels inside the matting vol-ume, which explain the increase of measurement uncertainty near the supports (Figs.7and8). This remark is also right for shear strain values shown in Fig. 9. In the context of trans-verse shear analysis, the visualisation of maximum shear is very interesting to study the mechanical behaviour of the structure, including the warping section phenomenon. In this application, the maximum shear value is greater than 1 %, which allows visualizing a significant warping.
Mea-surement noise is also visible in the third observed thickness plane (Z=2.3 mm), at the center of the specimen. Presence of this noise can be explained by reconstruction artefacts, which involve a false local representation of the internal structure. This noise appears very close to the X-μCT ac-quisition rotation axis, which is a very sensitive location for the reconstruction artefacts [19].
Discussions
This work gives an interesting response to the different kind of problematics, exposed in the introduction. The used vol-ume measurement method in the composite structures gives Fig. 9 Shear strain fields of three-point bending test
Fig. 10 Displacement Error along the X direction Fig. 8 Transverse displacement field of three-point bending test
results allowing making an interpretation more detailed than the one obtained from 2D methods. Indeed, the possibility to determine full real boundary conditions is very interesting to build richer FEM studies. Out-of-plane and volume infor-mations are directly extracted from the test results given by DVC process, while it is not available with 2D measurement techniques.
The results of the previous section (Figs.7,8and9) show a low level of displacement and strain. To discuss the pertinence of strain results and displacement gaps between models and experimental data, it is useful to know the measurement uncertainty. As the level of strains is low, only an analysis of imposed displacement is sufficient [18,29] because an as-sumed local homogeneous transformation is closer to the real heterogeneous transformation. So rigid body translations have been performed in order to characterize measurement errors obtained with this kind of sample and laboratory tomographic device (grey level gradients given by speckle pattern under x-rays, device noise, parameters of recording and reconstruction
of volume images…). Imposed displacement values go from 0 to 1 voxel with a step of 0.1 voxel. A volume image is recorded and reconstructed for each imposed value. Voxel size is equal to 52 μm. Figure10shows evolution of displacement error and uncertainty according to imposed displacement val-ues. Obtained results from these displacement tests give values and an error evolution which correspond to the well-known sinusoidal evolution usually obtained for 2D studies by DIC [27,28,30,31] or 3D ones by DVC [18]. The global error taking into account upper error and measurement uncertainty is around 0.04 voxel (2 μm). For small strain values, the measurement error can be calculated by the ratio between the displacement global error (0.04 voxel) and the used gauge length given previously (20 voxels) [29], which is equal to 0.002. This value is correct in comparison with observed strain results shown in Fig.9.
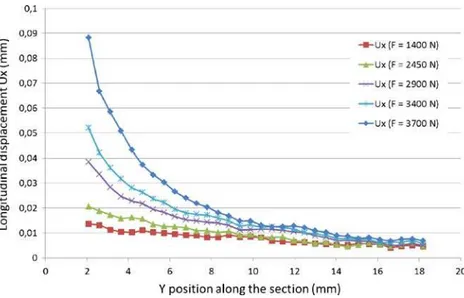
Concerning the transverse shear analysis, the longitudinal displacement field Uxis useful to determine the evolution of the different sections in function of transverse shear amplitude. Fig. 11 Evolution of
longitudi-nal displacement Uxversus
bending load along a section between supports
Fig. 12 Warping evolution in the thickness direction
Interesting sections are those who are at the middle length between the upper and the left or right supports (L/4 and – L/4). Figure 11 illustrates the evolution of the longitudinal displacement Ux along the Y-position versus applied load (3400 N), for the middle section between supports. It shows that warping appears with the increase of shear strains provided by bending loads. For low values of load, the shear is minimum, so warping section seems to be null, Ux values along the section are linear. At the limit load, the warping section is clearly visible, there is an evolution of Ux which seems to correspond with an evolution given by results obtained with refined theories. These elements have to be confronted with analytical results to determine the validity of existing warping functions. Figure 12 presents several evolutions of warping section during the bending along the thickness, which have to be compared with results obtained from standard and refined theories. First observa-tions made on this case show that the warping does not have a linear evolution according to the Y-position, which traduce the validity of refined models in the case where geometric and mechanical properties of specimens present a high sen-sibility to the transverse shear stresses. This figure shows the symmetry of the results of both sides of the upper support, due to the bending testing configuration. However, warping seems to be uniform along the thickness, which can only be verified by DVC measurements. A sample of numerical results is also included in this figure as reference. This one shows that the correlation of graphs seems good. Differences can be observed between the displacements determined by DVC and finite elements models, in Fig. 12. Experimental values near the bottom side are diverging from the numerical results. Mating effects have local influences on boundary conditions on the bottom and top face of specimen, which explains the absence of symmetry of displacement evolution in the experimental results. The longitudinal displacements around the support are locked by the penetration of top
support during mating which is not simulated by FE model, so there is no similar mechanical response between the both cases. Figure13presents Uxdisplacements, and so warping, for DVC, and FEM with different kind applied boundary conditions, at the load of 3700 N. To consider the testing conditions, displacement values measured by DVC are used in the FEM modeling at the support locations, including where is applied the bending load. Perfect theorical condi-tions are also applied on points corresponding to the contact with bending supports. It shows that the use of measured boundary conditions in FEM, only applied at supports points, gives better results than FEM with perfect conditions, which not allow taking into account real longitudinal dis-placements due to the mating effects. In this case, the correlation between experimental and FEM values is better. Then, future works can be envisaged to study different analytical or numerical modes in accordance with experi-mental results.
Also, the volume measurement give the possibility to take account the edge effects, by results in the specimen thickness. The in situ loading device developed in this work, three-point bending configuration, in association with the proposed experimental protocol become a very attractive tool to achieve experimental results to compare with analyt-ical and numeranalyt-ical formulations.
Conclusion
This paper presents an innovative experimental method to make an in situ mechanical investigation of composite structures. It is based on X-μCT acquisitions which give volume images, used for the volume displacement measure-ment by DVC. A specific manufacturing process is pro-posed to make composite specimens, with inclusion of copper particles, needed to give a good contrast of grey Fig. 13 Influence of used FEM
boundary conditions on warping results
level distribution in X-ray tomographic images. Also a new in situ mechanical loading device has been especially de-veloped to achieve testing in the three-point bending con-ditions, until 6 kN of load and 50 mm of displacement.
This loading device has been set up during tests on UD Carbon/Epoxy specimens in order to validate the experi-mental procedure and to visualize displacement fields at different positions of thickness in the specimen volume. Obtained results allow validating the use of copper particles to achieve displacement and strain computation by X-μCT and DVC techniques in composite materials, with a good uncertainty of 0.04 voxel. DVC gives a good evaluation of the mechanical response of the composite specimen under the bending load, which is illustrated with consistency for longitudinal displacements, bending displacements and shear strain. These results highlights the transverse shear effects which appear during the bending test, included the warping section. Future project works will be conducted to compare experimental results with analytical and FEM results to conclude on interest of refined theories in com-posite structures mechanical studies.
References
1. Berthelot JM (2005) Matériaux composites - comportement mécanique et analyse des structures, 4ème Edition. Editions TEC et DOC
2. Karama M, Afaq K, Mistou S (2009) A new theory for laminated composite plates. J Mater Des Appl 223:53–62
3. Mantari J, Oktem A, Guedes Soares C (2011) Static and dynamic analysis of laminated composite and sandwich plates and shells by using a new higher-order shear deformation theory. Compos Struct 94:37–49
4. Karama M, Afaq KS, Mistou S (2003) Mechanical behaviour of laminated composite beam by the new multi-layered laminated composite structures model with transverse shear stress continuity. Int J Solids Struct 40:1525–1546
5. Reissner E (1945) Reflection on the theory of elastic plates. J Appl Mech 38:1453–1464
6. Kirchhoff G (1850) Uber das gleichgewicht und die bewegung einer elastischen schreitbe. Reine Angew Math 40:51–58 7. Reddy J (1984) A simple high-order theory of laminated
compos-ite plate. J Appl Mech 51:745–752
8. Touratier M (1991) An efficient standard plate theory. Int J Eng Sci 29:901–916
9. Dufort L, Grédiac M, Surrel Y (2001) Experimental evidence of the cross-section warping in short composite beams under three point bending. Compos Struct 51:37–47
10. Brault R, Germaneau A, Doumalin P, Dupre J, Fazzini M, Mistou S (2011) Evaluation of transverse shear in laminated composite plates by digital volume correlation
11. Gates M, Lambros J, Heath M (2010) Towards high performance digital volume correlation. Exp Mech 51:491–507
12. Salvo L, Suéry M, Marmottant A, Limodin N, Bernard D (2010) 3d imaging in material science: application of x-ray tomography. C R Phys 11:641–649
13. Buffière J, Proudhon H, Ferrie E, Ludwig W, Maire E, Cloetens P (2005) Three dimensional imaging of damage in structural materi-als using high resolution micro-tomography. Nucl Instrum Methods Phys Res, Sect B 238:75–82
14. Tan K, Watanabe N, Iwahori Y (2011) X-ray radiography and micro-computed tomography examination of damage character-istics in stitched composites subjected to impact loading. Compos B: Eng 42:874–884
15. Schilling PJ, Karedla BPR, Tatiparthi AK, Verges MA, Herrington PD (2005) X-ray computed microtomography of internal damage in fiber reinforced polymer matrix composites. Compos Sci Technol 65:2071–2078
16. Latil P, Orgéas L, Geindreau C, Dumont P, Rolland du Roscoat S (2011) Towards the 3d in situ characterisation of deformation micro-mechanisms within a compressed bundle of fibres. Compos Sci Technol 71:480–488
17. Sutton M, Wolters W, Peters W, Ranson W, McNeill S (1983) Determination of displacements using an improved digital corre-lation method. Image Vis Comput 1:133–139
18. Germaneau A (2007) Développement de techniques de mesure dans le volume: Photoélasticimétrie 3D par découpage optique et corrélation volumique par tomographie optique et rayons X. Application à l’étude des effets mécaniques 3D dans les structures et les biomatériaux. PhD Thesis. Université de Poitiers
19. Germaneau A, Doumalin P, Dupre J (2008) Comparison between x-ray micro-computed tomography and optical scanning tomogra-phy for full 3d strain measurement by digital volume correlation. NDT E Int 41:9
20. Bay B, Smith T, Fyhrie D, Saad M (1999) Digital volume corre-lation: three-dimensional strain mapping using x-ray tomography. Exp Mech 39:217–226
21. Buffière J, Maire E, Adrien J, Masse J, Boller E (2010) In situ experiments with x ray tomography: an attractive tool for experi-mental mechanics. Exp Mech 50:289–305
22. Verhulp E, van Rietbergen B, Huiskes R (2004) A three-dimensional digital image correlation technique for strain meas-urements in microstructures. J Biomech 37:1313–1320
23. Lenoir N (2006) Comportement mécanique et rupture dans les roches argileuses étudiés par micro-tomographie à rayons X. PhD Thesis. Université de Grenoble I
24. Forsberg F, Sjödahl M, Mooser R, Hack E, Wyss P (2010) Full dimensional strain measurements on wood exposed to three-point bending: analysis by use of digital volume correlation ap-plied to synchrotron radiation micro-computed tomography image data. Strain 46:47–60
25. Roux S, Hild F, Viot P, Bernard D (2008) Three-dimensional image correlation from x-ray computed tomography of solid foam. Compos A: Appl Sci Manuf 39:1253–1265
26. Feldkamp L, Davis L, Kress J (1984) Practical cone-beam algo-rithm. J Opt Soc Am A1:612–619
27. Bornert M, Brémand F, Doumalin P, Dupré J, Fazzini M et al (2009) Assessment of digital image correlation measurement errors: methodology and results. Exp Mech 49:353–370 28. Germaneau A, Doumalin P, Dupre J (2007) 3d strain field
mea-surement by correlation of volume images using scattered light_-recording of images and choice of marks. Strain 43:207–218 29. Germaneau A, Doumalin P, Dupré J (2007) Full 3d measurement
of strain field by scattered light for analysis of structures. Exp Mech 47:523–532
30. Sutton M, McNeill S, Jang J, Babai M (1988) Effects of subpixel image restoration on digital correlation error estimates. Opt Eng 27:870–877
31. Choi S, Shah S (1997) Measurement of deformations on concrete subjected to compression using image correlation. Exp Mech 37:307–313